 |
| About Bioline | All Journals | Testimonials | Membership | News |
|
||||||
|
||||||
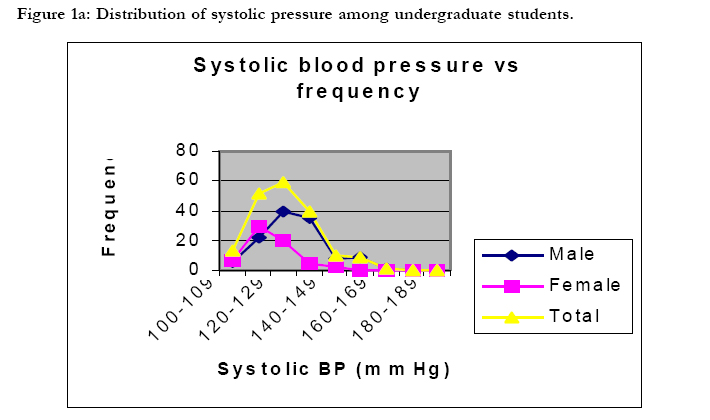
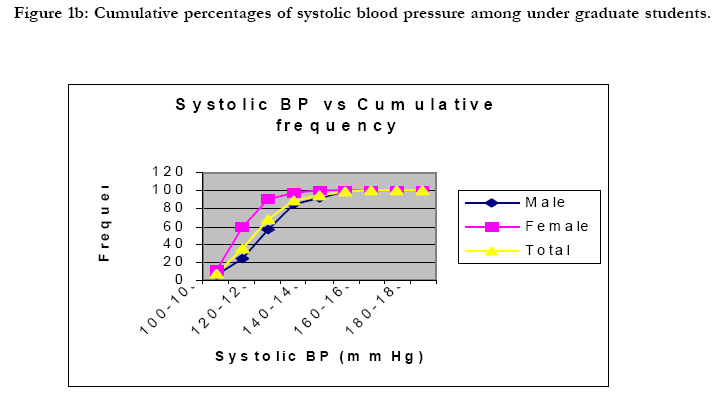
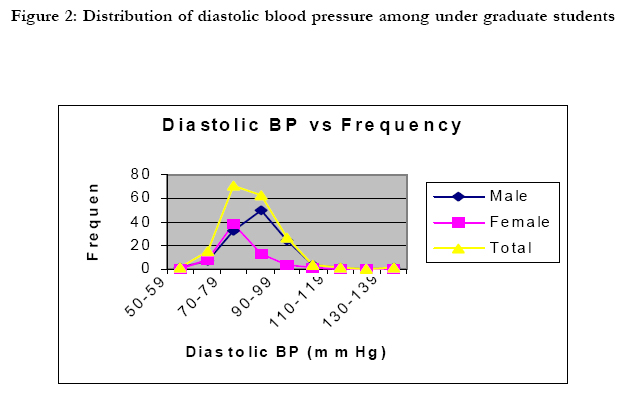
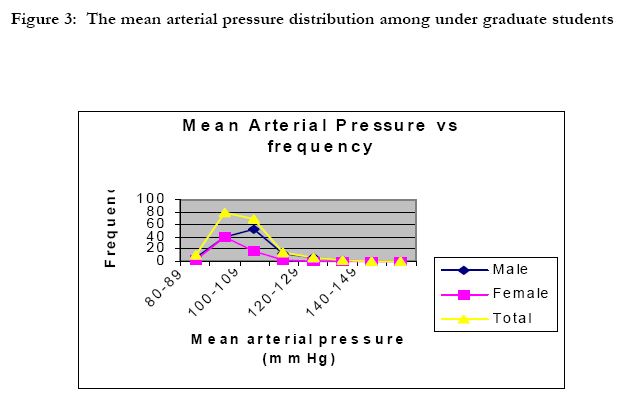
African Health Sciences, Vol. 5, No. 2, June, 2005, pp. 99-106 Blood pressure profiles among Makerere University undergraduate students G. S. Bimenya, W. Byarugaba, S. Kalungi, J. Mayito, K. Mugabe, R. Makabayi, E. Ayebare, H. Wanzira and M. Muhame. Department of Pathology, Faculty of Medicine, Makerere University, P.O. Box 7072, Kampala, Uganda Correspondence author: G. S. Bimenya Department of Pathology Faculty of Medicine Makerere University P. O. Box 7072 Kampala, Uganda Email: gsbimenya@med.mak.ac.ug Code Number: hs05020 ABSTRACT:The purpose of this study was to set reference values for spot blood pressure
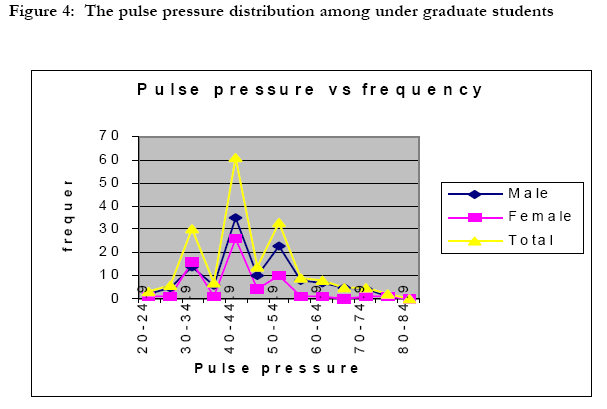
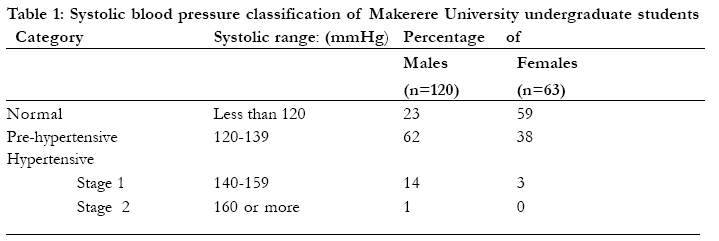
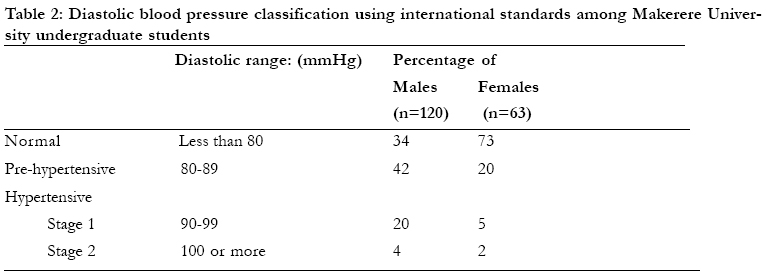
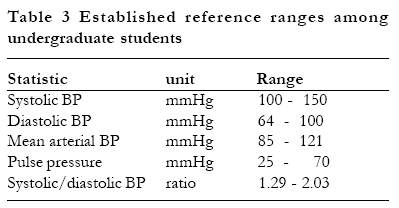
and its derivatives among Makerere university undergraduate students. Blood pressure is the pressure of blood against the walls of the arteries. Blood pressure results from two forces: one is created by the heart as it pumps blood into the arteries through the circulatory system and the other is the force exerted by the arteries as they resist the blood flow1. Each time the blood pressure is checked, two figures are recorded: the upper, or systolic pressure, and the lower, or diastolic pressure. The normal range varies with age, but a young adult would be expected to have a systolic pressure of around 120 mmHg and a diastolic pressure of around 80 mm of mercury.2, 3. There are several reasons for studying the casual blood pressure in any community: a) it has the most ready application to clinical medicine as it is used by all doctors all the time; b) it is the pressure which people live with most of their wake lives; c) the data obtained may be generally comparable with those found in other casual blood pressure surveys; d) and the demands on the population are not arduous, an important fact for epidemiological work4, 5 High blood pressure (hypertension) is considered when a blood pressure of 140/90 or higher is recorded three or more consecutive times. With high blood pressure, the heart works harder, the arteries take a beating, and the chances of stroke, heart attack, and kidney problems are greater 6. High blood pressure is a silent danger because there are no typical symptoms sending out early warning signals. On the contrary, many people feel well and energetic despite their high blood pressure. There is only one-way of finding out whether or not one’s pressure is normal and that is to have it checked. Blood pressure measurements must be repeated at least once every year. If an elevated pressure is detected early, prompt treatment can help prevent the possible fatal consequences7. There has been much debate on the relative importance of systolic and diastolic hypertension in epidemiological studies. Both systolic and diastolic blood pressures are important risk factors for cardiovascular disease6. There is evidence to suggest that certain derivatives of systolic and diastolic measurements may be the most important risk indicators in some patient categories8. Derivatives of systolic and diastolic blood pressureThe most commonly used derivatives of systolic and diastolic pressure include the mean arterial pressure, the pulse pressure and the systole/diastole pressure ratio. The Mean Arterial PressureThe mean arterial pressure (MAP) is the perfusion pressure experienced by end organs such as the kidney, the liver and bones. This pressure converts pulsatile systolic and diastolic pressure into a continuous pressure that determines the average rate of blood flow from the left ventricle to the right atrium9. To determine MAP with accuracy, analogue electric circuitry or digital techniques that are either invasive, or expensive and sometimes both, are needed10. In field practice, MAP is taken as the average arterial blood pressure, obtained by taking the average of systolic and diastolic pressure. The pulse pressureThe difference between the systolic and diastolic pressure is called the pulse pressure. It is an important predictor of cardiovascular events and predicts the risk of congestive heart failure in the elderly8. It is associated with ventricular hypertrophy and increases with age as the aortic compliance decreases10. Measurement of pulse pressure continues to gain support as a potential and clinically useful predictor of cardiovascular disease risk and all-cause of mortality in a variety of populations11. It is the most important component of pressure associated with severe coronary heart disease6. Systolic: Diastolic ratioThe systolic / diastolic ratio is the systolic pressure divided by the diastolic pressure. This ratio with its variants is useful in obstetrics 12, 13 and in cases of acute myocardial infarction14. Worldwide population differences do exist as the findings in the Kikuyu and Samburu showed that indigenous neighbouring communities in Africa may differ from one another, in blood pressure levels just as they may from Europeans5. As the number of fatalities from cardiovascular disease declines in western industrialised nations, the reverse has been observed in East Africa 15. Hypertensive heart disease was, as far back as 1969, reported as a major cardiovascular problem in the African population attending Mulago Hospital, Kampala16. To date, uncontrolled systemic hypertension is the most important risk factor for cardiac disease and heart failure at Mulago Hospital17. Therefore the aim of this work was to establish reference values of systolic and diastolic pressure and their derivatives among Makerere University undergraduate students. MATERIALS AND METHODS Study site Casual blood pressure measurements were carried out in the nine halls of residence at the main campus of Makerere University in Kampala, Uganda. Study populationThe study involved healthy male and female consenting undergraduate students, aged between 20 and 26 years. Pregnant students were excluded. ProceduresQuestionnaire: The participants were given self-administered question- naires to provide information on demographic, lifestyle and health characteristics. Blood Pressure Measurements: Systolic blood pressure (SBP) and diastolic blood pressure (DBP) were measured to the nearest one-millimeter of mercury while the participant was seated using a sphygmomanometer and stethoscope. Data analysisThe systolic and diastolic blood pressure values were used to derive the mean arterial pressure, pulse pressure and systolic: diastolic ratios, which were then plotted in histograms to establish the pattern of distribution. The central 95 percentile read off cumulative percent curves gave the reference values. RESULTSOne hundred and eighty three students, 120 males and 63 females participated in the study. The age ranged from 20 to 26 years. Systolic blood pressureThe systolic blood pressure ranged from 100 to179 mmHg. As shown in Figure 1a the distribution is positively skewed. The central 95th percentile reference range is 100 to 150 mmHg as read off the cumulative curve shown in figure 1b. Diastolic pressureThe diastolic blood pressure ranged from 60 to 139 mmHg. As shown in figure 2, the distribution is positively skewed. The central 95th percentile range is from 64 to 100 mmHg as read off a cumulative percentage curve (not shown). Mean arterial pressureThe mean arterial pressure ranges from 80 to 159 mmHg. As shown in Figure 3, the distribution is positively skewed. The central 95th percentile ranges from 85 to 121 mmHg as read off from a cumulative percentage curve. Pulse pressure The pulse pressure ranged from 20 to 85 mmHg (Figure 4). The distribution is tri-modal and positively skewed. The central 95th percentile ranges from 25 to 70 mmHg as read off from a cumulative percentage curve. Systolic: diastolic ratio The systolic: diastolic pressure ratio ranged from 1.20 to 2.30 mmHg (Figure 5). The distribution is tri-modal and positively skewed. The central 95th percentile ranges from 1.29 to 2.03 mmHg as read off a cumulative percentage curve. Blood pressure categorisation of Makerere University undergraduate students based on international standards10 a) Systolic blood pressure Table 1 gives the detailed classification according to sex. Using the systolic blood pressure, 36% of the sample population is normotensive while 53% are pre-hypertensive and 11% are hypertensive. b) Diastolic blood pressureTable 2 gives the detailed classification according to sex Using the diastolic pressure, 48% of the sample population is normotensive while 34% is pre-hypertensive and 18% is hypertensive. c) Mean arterial pressureMAP is not routinely used in patient investigation and so far has no international reference values. Our results, however, show the same distribution pattern as those of diastolic and systolic pressure. d) Pulse pressureThere are so far no published internationally standardized values for pulse pressure to which these results could be compared. Our results, however, are categorised into three clusters with peaks at 35, 45, and 55 mmHg. e) Systolic: diastolic ratioThis ratio is not routinely used in patient management, so there are no values to refer to. None the less, our results are categorized into three groups of peaks at 1.4, 1.6 and 1.8. These correspond to the three peaks of the pulse pressure. Summary of reference rangesTable 3 gives a summary of the reference ranges within the central 95 percentile of each statistic among the university undergraduate students. DISCUSSIONThe distribution of systolic and diastolic pressure obtained in this work is in agreement with many epidemiological studies, which show that blood pressure in the population has a distribution curve that is slightly skewed to the right18. The mean arterial pressure is distributed like the "parent" pressures of systole and diastole. This is the first time these patterns are reported among Ugandans. The trimodal distribution of pulse pressure and systolic:diastolic ratio is being reported for the first time to the best of our knowledge and is apparently not used conventionally in patient management. The three peaks correspond respectively to normotension, prehypertension and hypertension. According to the international reference values given above, it has been shown in this work that some of the university student population have systolic and diastolic pressure values of clinical prehypertension and hypertension. Although it is commonly believed that essential hypertension usually begins between 35 and 45 years18and worsens with age, our findings show imminent danger of hypertension in a young population of 20-26 years. The risk group needs to be put under medical surveillance to confirm the hypertension and to study predisposing factors. Although mean arterial pressure (MAP) is not routinely considered by clinicians in patient management it is important because it is the pressure experienced by the end organs which, on average, demand a minimum of 60 mm Hg19. The student sample has MAP range of 85-121 mmHg, which is well above the essential minimum that negates systemic ischaemia. The pulse pressure is an indicator of stiffness and inflammation in the vessel walls; the higher the value, the greater the risk of cardiovascular disease11. Although not yet used by clinicians to determine the treatment, evidence suggests that it may prove a strong indicator of heart problems20, 21. For example, recent studies have indicated that a 10 mm Hg wider pulse pressure increased the risk of major cardiovascular complications22. The tri-modal profile obtained in this work outlines normotension, pre-hypertension, and hypertension of both systolic and diastolic origin. This is the first time these derivatives are reported among Ugandans. The pulse pressure and the systolic:diastolic pressure ratio may turn out to be diagnostic statistics to identify risky groups which require medical surveillance. CONCLUSIONS AND RECOMMENDATIONS
We acknowledge SIDA/SAREC Uganda for funding the study. REFERENCES
Copyright 2005 - Makerere Medical School, Uganda |
