 |
| About Bioline | All Journals | Testimonials | Membership | News |
|
||||||
|
||||||
African Health Sciences, Vol. 8, No. 3, Sept, 2008, pp. 174-179 Anthropometric measurements of children attending a vaccination clinic in Yaounde, Cameroon. A. Chiabi 1, P.F. Tchokoteu2 , V. Takou3 , F. Fru 3, F. Tchouine 4 1 Faculty of Medicine and Biomedical Sciences, University of Yaounde I / Consultant Paediatrician, Yaounde
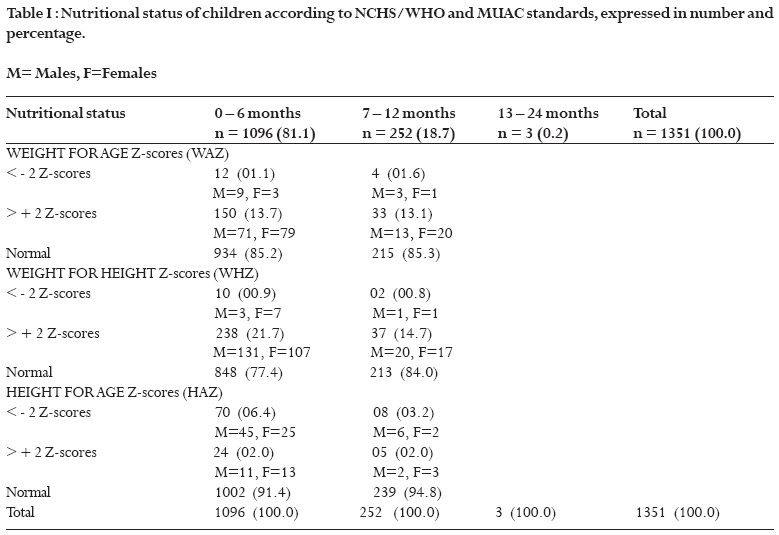
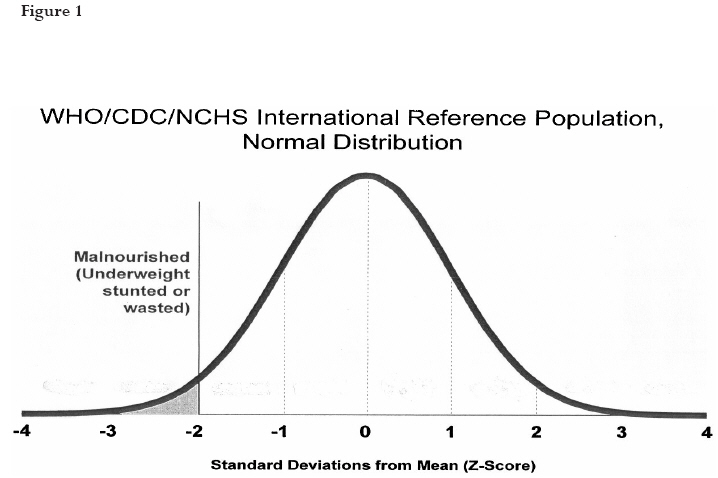
Gynaeco-Obstetric and Paediatric Hospital, Cameroon, Code Number: hs08037 Abstract Background: Growth faltering is a frequent public health problem in children and anthropometric measurements are useful tools for follow-up and early diagnosis. This problem has not been studied in the Cameroonian setting, that's why we undertook this study.Objectives: To have a synopsis of the nutritional status in apparently healthy children attending a vaccination clinic and show the importance of anthropometric measurements in routine child health care. Design: A retrospective study. Patients and Participants: 1351 children aged (6-24months), who attended the vaccination clinic of the Yaounde Gynaeco-Obstetric and Pediatric Hospital over a 6 month period, were enrolled in the study. Method: The registers of the vaccination clinic of the above hospital were retrospectively reviewed from 1st March to 31st August 2005. The following parameters were noted: age, height, weight, mid-upper arm circumference (MUAC), and Z scores calculated for the following indicators: weight for age (WAZ), weight for height (WHZ), and height for age (HAZ). Results: Our results show that 12 children (1.1percent) in the 0-6 months age group and 4 (1.6 percent) in the 6-12 months age group had WAZ less than -2 indicating underweight. Also 10 children (0.9 percent) and 2 (0.8 percent) in the 0-6 and 6-12 months age groups respectively had WHZ less than -2, indicating wasting. HAZ was less than -2 in 70 children (6.4 percent) and in 8 (3.2 percent) in the 0-6 and 6-12 months age groups respectively indicating stunting. The MUAC was less than 12.5 cm in 6 children (2.4 percent). Conclusions: From our results, we conclude that growth faltering is common in supposedly healthy children attending our vaccination clinic. Anthropometric measurements are thus recommended and should be encouraged in routine child care settings for early diagnosis of growth retardation and to provide useful interventions. Key Words: Anthropometry - Children - Growth - Z scores - Yaounde - Cameroon. Introduction Poor childhood growth is a widespread public health problem in many low income countries especially in Asia and sub-Saharan Africa. Growth faltering is associated with subsequent cognitive and physical disadvantage, morbidity and mortality.1 Suboptimal growth is a sensitive and readily measurable indicator of malnutrition or other health problems of children under 5 years of age.1 According to the World Health Organization (WHO), malnutrition accounts for 6.6 million out of 12.2 million deaths among children under 5 (54 percent of child mortality) in developing countries.2 The majority of these deaths are due to the potentiating effect of mild-to-moderate malnutrition as opposed to severe malnutrition. In practice, growth faltering is often undiagnosed because some children are not often systematically weighed nor measured in routine medical visits and some measures are often poorly recorded or not at all. These inaccuracies might lead to unnecessary consultation requests or non request of necessary consultations.3 Consistent and precise anthropometric assessment of growing children thus facilitates early identification and timely interventions for emerging health problems.We thus carried out this retrospective study, the first of its kind, on 1351 supposedly healthy children brought for regular vaccinations at the Yaounde Gynaeco-Obstetric and Paediatric Hospital to see whether there exists any latent nutritional problems in them. Objectives To evaluate the nutritional status of supposedly healthy children attending our vaccination clinic and to show the importance of anthropometric measurements in routine child health care. Patients and methods This is a retrospective study over a 6 month period (1st March to 31st August 2005) in 1351 children. Vaccinations are done 3 times per week (Tuesday, Wednesday and Thursday). The extended program of immunization (EPI) in Cameroon targets the 0 11 months age group. At birth BCG, Polio 0 are given, Polio 1, DPT 1, hepatitis B vaccine at 6 weeks, Polio 2, DPT 2, hepatitis B vaccine at 10 weeks, Polio 3, DPT 3, hepatitis B vaccine at 14 weeks and measles and yellow fever vaccines and Vitamin A at 9 months. In Cameroon, Vitamin A administration starts as from 6months of age or synchronized with the measles and yellow fever vaccine at 9 months, the twice yearly until 5 years of age.We went through the vaccination registers and noted the names, age, sex, weight and the mid upper arm circumference. Twenty four children for whom one or more of the above parameters were not noted in the registers were excluded from the study. Weights were measured with a Seca-Säuglingwage balance (for small infants) and a Health Scale Mic balance (for older children) to the nearest 0.1kg. Lengths were measured with a Seca height gauge in the supine position. The mid upper arm circumference (MUAC) was measured to the nearest 0.1cm with a normal non-stretch tape (the mid upper arm point is half the distance between the tip of the shoulder blade and tip of the elbow). The children were undressed during these measurements. Data was analyzed in Epi info 6.04 software and Z scores calculated from WHO references (National Center for Health Statistics/Center for Disease Control/World Health Organization reference population). The indicators studied were, weight for age Z scores (WAZ), height for age Z scores (HAZ), weight for height Z scores (WHZ) and the mid upper arm circumference (MUAC). The malnutrition thresholds according to NCHS/WHO standards are, between -2 Z scores and -3 Z scores for moderate, and < 3Z scores for severe malnutrition. A standard MUAC measure of less than 12.5 cm denotes severe malnutrition. The nurses working in this unit, had undergone training from the Ministry of Public Health and the pediatrician in charge of the out-patient department, not only on vaccinations but also on the taking of anthropometric measurements, keeping registers and plotting onto the "Road to Health Charts" and the hospital booklets with WHO reference curves. Results Epidemiologic findingsSex: Of the 1351 children recruited in this study, 727 (53.8 percent) were males and 624 (46.2 percent) females, giving a male: female sex ratio of 1.16. Age: There were 1096 (81.1 percent) children below 6 months of age, 252(18.7 percent) in the 6 to 12 months age group and 3(0.2 percent) in the 12 to 24 months age group. The mean age of the children was 3.7months (range 0.7 to 24months). Weight for age Z scores (WAZ) Twelve (1.1 percent) children below 6 months had the WAZ less than -2, and 4(1.6 percent) less than -2, in the 6 to 12 months age group. Concerning the +2 Z- scores, 150(13.7 percent) children in the 0 to 6 months age group had WAZ greater than +2 and 33(13.1 percent) in the 6 to 12 months age group greater than +2 (Table I). Weight for height Z scores (WHZ) Ten (0.9 percent) children below 6 months and 2 (0.8 percent) in the 6 to 12 months age group had WHZ less than -2. On the other hand, 238(21.7 percent) children in the 0 to 6months age group, and 37(14.7 percent) children had WHZ greater than +2 (Table I). Height for age Z scores (HAZ) Seventy (6.4 percent) children below 6 months and 8 ( 3.2 percent) in the 6 to 12 months age group had HAZ less than -2. Concerning the +2Z scores, 24(2.2 percent) children under 6 months and 5(2 percent) in the 6 to 12 months age group had scores greater than +2Z (Table I). Discussion According to the World Health Organization (WHO), children with Z scores less than -2 are malnourished (underweight, stunted or wasted) (Figure 1). Weight for age Z scores (WAZ) WAZ less than -2 reflects past (chronic) and/or present (acute) malnutrition but does not distinguish between the two. It indicates underweight.5 It is the most widely used indicator to follow up nutritional status and growth of young children in health facilities.6 In our study 16(2.7 percent) children had WAZ less than -2, with 12(1.1 percent) in the under 6 months age group and 4(1.6 percent) in the 6 to 12 months age group. In the 2004 Demographic Health Survey (DHS III) in Cameroon, 1.2 percent of children in the 0 to 6 months age group were underweight and 35.9 percent in the 6-12 months age group.6 In an earlier survey in 1998 (DHS II), the prevalence of underweight was 1.9 percent and 19.8 percent in the under 6months and 6 to 12 months age groups respectively.7 In Kenya, the prevalence of underweight was 5.1 percent and 22.3 percent in the 0 to5 months and 6 to 59 months age groups respectively.8 De Onis et al, projected the worldwide prevalence of childhood underweight to a decline from 26.5 percent in 1990 to 17.6 percent in 2015, a change of 34 percent (95% CI, 43% to 23%). In developing regions, the prevalence was forecasted to decline from 30.2 percent to 19.3 percent, a change of -36 percent (95% CI, 45% to 26%), whereas in developed countries, the prevalence was estimated to decrease from 1.6 percent to 0.9 percent, a change of 41 percent (95% CI, 92% to 343%). The same study forecasted an increase in the prevalence from 24.0 in 1990 to 26.8 percent in 2015, a change of 12 percent (95% CI, 8% to16%) in Africa.9 Considering regions in Africa, the prevalence was estimated to increase in sub-Saharan Africa by 9 percent (from 26.8% to 29.2%), and in Eastern Africa by 25 percent (from 26.7 to 33.3 percent). It was projected to be reduced by 15 percent for Middle Africa; 5 percent, Southern Africa; and 6 percent, Western Africa. Only Northern Africa, had a forecasted reduction from 9.5 percent to 4.2 percent.9 We also noted in our study that out of 1348 children in 0-12 month age group, 183 children (13.6%) had Z scores greater than +2; they were considered thus very overweight for age.7 Weight for height Z scores WHZ less than -2 is a sign of acute malnutrition and indicates wasting. It detects short-term growth factors and seasonal changes in food supplies or short term nutritional deficits following an acute illness.5 The overall prevalence of wasting in our study was 1.7 percent, and was identical in the two age groups. In the 2004 DHS III, 2.2 percent of children were wasted in the first 6 months and 11.7 percent between 6 and 12 months.6 In the previous1998 DHS II, 1.9 percent of children were wasted in the first 6 months and 9.6 percent between 6 and 12 months.7 In the 2004 DHS III, the following factors were identified as causes of weight for height deficits: infectious diseases(measles, diarrhea); seasonal variations (drought); poor weaning practices; family rank; birth spacing; rural (6 percent) versus urban (4 percent) residence and the mother's level of education.6 In a study of 261 children less than 30 months of age in Uganda, only 2(0.8 percent) children were wasted.10 Worldwide, Latin America has little or no wasting and Asia has very high prevalences of wasting (8 percent or more). Africa on the average does not have such high levels of wasting as in Asia, although some West African countries (Benin, Niger, and Mali in particular) as well as Chad from Central Africa show extremely high levels of wasting, even higher than those for Asian countries. The prevalence of wasting in these countries is more than 10 percent in both urban and rural areas and the prevalence in Mali is even more than 20 percent.11 Concerning Z scores greater than +2, we observed that 275 (36.4 percent) children, fall in this category. These children are considered very overweight for height compared to the 2% from the study on the nutrition of young children in Yaounde.7 Height for age Z scores (HAZ) Height for age Z scores reflect past or chronic malnutrition. Z scores less than -2 indicates stunting.5 In our study 78(9.6 percent) children were stunted, with 70(6.4 percent) in the first 6months and 8 (3.2 percent) in the 6 to 12 months age group. In the 2004 DHS III, 5.8 percent of children in the first 6months of life were stunted and 39.4 percent in the 6 to 12 months age group.6 In the 1998 DHS II, the prevalence of stunting in the first 6months was 5.5 percent and 18 percent in the 6 to 12 months age group.7 For Z scores greater than +2, some 29 (4.2 percent) children were affected, with 24 (2.2 percent) below 6 months and 5 (2 percent) between 6 to 12 months of age. These children are considered very tall for age. Mid upper arm circumference (MUAC) A MUAC of less than 12.5cm is indicative of moderate to severe malnutrition in children of 6months to 5years of age.5 Low MUAC was found in 21.6 percent of Ugandan children less than 30months of age.10 In our study, 6 (2.4 percent) children between 6 and 12 months of age had the MUAC less than 12.5cm. The MUAC is a fast screening method in detecting acute global malnutrition and a good predicting indicator of risk of imminent death.5 It is also a predictor of childhood mortality.11 It is important to note that, it was not possible to determine obesity in these children. The body mass index (BMI) defined as the weight (Kg) divided by the height in square meters was not calculated, because the ages of patients (< 2 years) did not permit the study of these anthropometric parameters with the National Center for Health Statistics/WHO international growth reference (the NCHS reference), as reported as noted by James.12 In adults, it is the most widely studied and most accepted index to assess obesity. In April 2006, the WHO released new standards for assessing the growth and development of children from birth to 5 years of age. These are the product of a systematic process initiated in the early 1990s involving various reviews of the uses of anthropometric references and alternative approaches to developing new tools to assess growth. The new standards adopt a fundamentally prescriptive approach designed to describe how all children should grow rather than the more limited goal of describing how children grew at a specific time and place. Importantly, for the first time, there now exist standardized Body Mass Index (BMI) for infants to age five, which is particularly useful for monitoring the increasing epidemic of childhood obesity.13 Another key characteristic of the new standard is that it establishes breastfeeding as the biological "norm" and the breastfed infant as the standard for measuring healthy growth. Previous reference charts were based on the growth of a random mixture of breastfed and artificially-fed children. These reference curves were not available at the time of this study, so infant obesity was not assessed. The results of the DHS II show that 2 percent of Cameroonian children are very overweight or very tall for their age or very overweight for height.7 On the whole, the prevalences of underweight, wasting and stunting were 2.7 percent, 1.7 percent and 9.6 percent respectively. Being a retrospective study with data from registers, it was not possible to exclude low birth weight babies who had not obtained their catch-up growth nor those with intercurrent or acute illnesses such as diarrhea which might affect these measurements. These children are normally brought for vaccination by their mothers, when they feel the child is healthy or at least not having an acute illness as fever, diarrhea or a respiratory tract infection. Also, it was not possible from the registers to assess the feeding habits or say how many children had anthropometric parameters above or below the reference for age. Despite their training, most often health workers do not interpret consequently anthropometric measurements after recording. Conclusion Our study shows that growth faltering is a common finding in children attending our vaccination clinic. This study underlines the importance of routine anthropometric monitoring of children in our context. It is useful as it will permit early identification and appropriate management of these abnormalities. Plotting these anthropometric parameters onto reference curves, will permit personnel giving vaccinations to refer to the pediatrician for nutritional assessment during the same visit, children with parameters above or below the reference for age. Use of the new WHO growth standards should be adopted and encouraged as they make breastfeeding the biological "norm" and establishes the breastfed infant as the normative growth model. Acknowledgements Thanks to Mme Malomo Rebecca for secretarial assistance and all the nurses of our vaccination clinic for taking the anthropometric measurements of the children and keeping the records. References
Copyright © 2008 - Makerere Medical School, Uganda The following images related to this document are available:Photo images[hs08037t1.jpg] [hs08037f1.jpg] |
| |||||||||