 |
| About Bioline | All Journals | Testimonials | Membership | News |
|
||||||
|
||||||
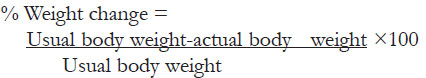
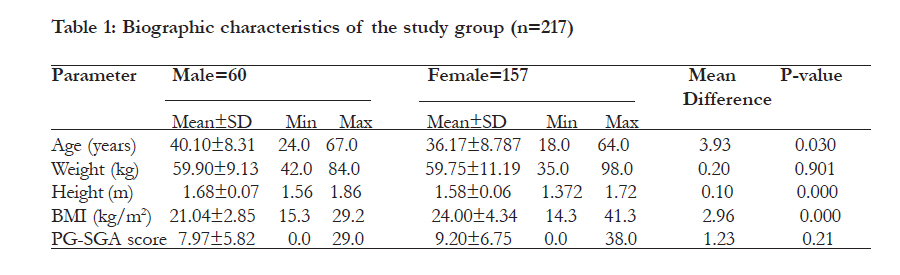
African Health Sciences, Vol. 11, No. S1, Aug, 2011, pp. S86-S92 Reliability of scored patient generated subjective global assessment for nutritional status among HIV infected adults in TASO, Kampala *Mokori A1, Kabehenda MK1, Nabiryo C3, Wamuyu MG2 1 Department of Food Science and Technology, Makerere University, Kampala, Uganda Code Number: hs11063 Abstract Objective: Establish the reliability of the scored Patient Generated-Subjective Global Assessment (PG-SGA) in determining nutritional status among Antiretroviral Therapy (ART) naive HIV-infected adults. Keywords: Patient Generated -Subjective Global Assessment; sensitivity; specificity Introduction HIV affects all aspects of human survival including nutritional status1. The effect of HIV on nutritional status begins early in the course of infection, possibly even before an individual is aware of being infected2,3,4. HIV and AIDS cause increased energy requirements, reductions in dietary intake, nutrient malabsorption and loss, and complex metabolic alterations that culminate in weight loss and wasting5,6,7. The resultant malnutrition increases the frequency and severity of opportunistic infections, impairs immune response, decreases response and tolerance to treatment, reduces survival and increases health-care costs8, 9. People living with HIV thus need good nutritional support and this requires early identification of risk for malnutrition by including routine nutritional assessments in the management of HIV in order to determine the level of deficit and appropriate nutrition intervention8. This helps prevent and treat unintentional weight loss and muscle wasting prevalent in HIV patients10. Nutritional assessment tools that can accurately predict risk for malnutrition and capture body composition parameters of fat, muscle and fluid are needed11. Malnutrition frequently goes unrecognized in many HIV patients and is often left untreated partly because of lack of simple, reliable and comprehensive methods for assessing nutritional status. Most equipment that can accurately assess nutritional status in HIV-infected persons is expensive. The reliable tools such as dual energy x-ray absorptiometry (DEXA), stable isotopes and bioelectrical impedance analysis are not readily available in HIV and AIDS care centres in poorer countries such as Uganda. Nutritional assessment should be non-invasive, easy to perform, practical, and yield immediate results12. In addition, it should be applicable at bedside, show appropriate sensitivity and specificity and which should not require use of complicated or expensive devices. Assessment tools with these qualities and which incorporate several nutritional variables are needed to accurately identify HIV-infected persons at risk of malnutrition. The scored PG-SGA is a suitable tool because it is inexpensive, easily applied, provides a comprehensive assessment of nutritional status and offers more information affecting nutritional status. Health practitioners in HIV and AIDS care centres with limited resources can use this cheap tool for timely identification of patients who are at risk of poor nutritional status and provide them with appropriate care (such as nutritional education and management of symptoms). This may then reduce the prevalence of malnutrition among patients and improve their quality of life. This study thus sought to establish the reliability of the scored PG-SGA to determine nutritional status among ART naive HIV-infected adults in TASO, Mulago Centre, Uganda. The sensitivity and specificity of PG-SGA in characterizing risk of malnutrition as indicated by Body Mass Index (BMI) among HIV-infected adults were determined. Methods A descriptive, cross sectional study was undertaken. The study group consisted of 217 adult patients aged 18-67 years who attended the out-patient HIV medical clinics at The AIDS Organization Support Organization (TASO), Mulago Centre, Kampala. Subjects who had records of weight history for the previous 6 months and consented to participate in the study were selected using purposive sampling. At the waiting area, the patients were asked if they were enrolled for ART and only those not on ART were selected for the study. All pregnant and/or lactating mothers, HIV weakened and bed ridden subjects were excluded from the study. Approval for the study was obtained from the TASO Research and Ethics committee. Patient generated subjective global nutritional status assessment Nutritional history (changes in body weight, dietary intake, gastrointestinal symptoms, functional capacity, and infections) and clinical status were determined using the PG-SGA form. The sum of scores obtained in each domain of the PG-SGA were used to determine the total PG-SGA scores. These scores were then applied in global assessment of each participant’s nutritional status by assigning a global rating of Stage A (well-nourished), Stage B (moderately malnourished/moderately thin) or Stage C (severely malnourished/very thin). Subjects rated in Stage A did not have any weight loss or deficits in nutrition impact symptoms, dietary intake, functioning, and physical exam. Those in Stage B had moderate deficits or showed recent improvement in weight, nutrition impact symptoms, dietary intake, function and physical exam. Subjects with any severe PG-SGA categories (weight loss, nutrition impact symptoms, dietary intake, function and physical exam) were rated as severely malnourished. Domains of the PG-SGA The PG-SGA has seven domains: weight loss, nutrition impact symptoms, dietary intake, activity and function, diseases, metabolic demand and physical exam. Each of these domains is awarded points 04 depending on the impact of the component on nutritional status. The summed score of the domains provides a guideline as to the level of nutrition and pharmacological intervention required for each patient. Each of the domains is described below: Weight This section of PG-SGA indicates current body weight (kilogram) and height (metres) of the patient. It also includes the past 6 months and 1 month weight. The domain documents if the patient’s weight decreased; remained unchanged or increased in the past 2 weeks. The obtained current body weight is used to determine the level of weight changes in the past two weeks, and is scored from 0 to 1. Patients with weight loss in the previous two weeks get a score of 1 while those without any change in weight status obtain 0. Food intake The domain rates the current food intake of the patient compared to the past month. It establishes if the food intake is unchanged, more than usual or less than usual. The domain checks if the patient is currently taking normal or less than normal amount of food; little solid food; only liquids; only nutritional supplements; very little of anything; and only tube feedings or nutrition by vein. Nutrition Impact Symptoms The domain contains a checklist of gastrointestinal problems that interfere with adequate dietary intake of the patients during the past two weeks. These include nausea, oral sores/ulcers, painful swallowing, dysphagia, loss of appetite, diarrhoea, being bothered by smell, feeling full quickly and fatigue. Scoring for these items ranged fromm 0 to 3 points depending on their impact on dietary intake. A score of 0 indicated no problem eating whereas 3 indicated presence of problems with severe impact on dietary intake. Vomiting, anorexia, diarrhoea and pain had the highest points. Activities and function The domain rates the patient’s activity over the past month to find out whether it was normal with no limitation; not normal but able to get up and about with fairly normal activities; not feeling up to most things but in bed or chair less than half the day; able to do little activity and spend most of the day in bed or chair, or pretty much bedridden, rarely out of bed. Disease and its relation to nutritional requirements Within this section all relevant diagnoses are listed in a checklist and others not in the list are required to be specified. A maximum score of 1 point is awarded for each diagnosis. Metabolic demand The domain determined the score for metabolic stress by obtaining the number of variables known to increase proteins and calorie needs. It specifically scores levels of fever, duration of fever and corticosteroids used. Nutrition–Related physical Examination The domain includes a subjective evaluation of 3 aspects of body composition: fat, muscle and fluid status. Each aspect of the exam is rated for degree of deficit with muscle defict impacting point score more than fat deficit. Temples (Temporalis muscle), clavicles (pectoralis and deltoids), shoulders (deltoids), interosseous muscles, scapula (latissimus dorsi, trapezius and deltoids), thigh (quadriceps), and calf (gastrocnemius) muscles are assessed for wastage. Orbital fat pads, triceps skin fold, and fat overlying lower ribs are examined to determine the level of fat loss. Since the assessment is subjective, each aspect of the examination is rated for a global degree of deficit. Patients without any deficit are given a score of 0 while those with mild, moderate and severe deficits get scores of 1, 2 and 3. Anthropometric assessment Current body weight (kilogram) and height (metres) were taken following WHO standard procedures. Weight was measured with Seca 762 scale and recorded to nearest 0.1 Kg. Measurements were repeated twice and the average used as final value for each subject. Height of each subject was measured with Seca 220 telescopic height rod and was recorded to the nearest 0.1 cm. The measured body weight and height were used to calculate the BMI of the subjects by dividing body weight by square of height (weight/height2). The BMI was classified as underweight (<18.5), normal weight (18.5-24.9), overweight (25-29) and obese (>30) according to the WHO criteria. The current body weight was also used to determine the level of weight changes in the past two weeks, and was scored from 0 to 1 as indicated in PG-SGA. Subjects who reported weight loss in the previous two weeks obtained a score of 1 while those with no change in weight status obtained 0. Weight taken over the last 6 months was retrieved from each participant’s file, and was used to compute percentage of body weight change as follows13:
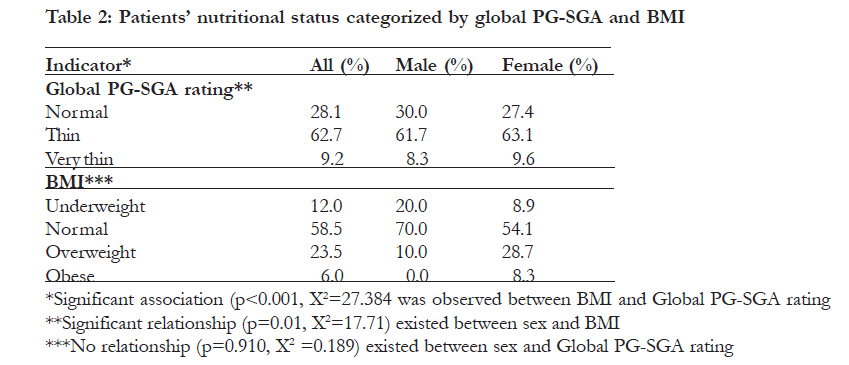
To determine weight loss score, previous 1 month weight data was used while 6 month weight data was used only if there was no 1 month weight data. Weight loss in 1 month of 10% or greater was given a score of 4 while weight loss of 0-1.9% obtained a score of 0. Weight loss in 6 months of 20% or greater was given a score of 4 while that of 0- 1.9% obtained a score of 0. Statistical Analysis Anthropometric and PG-SGA scores were presented by means of descriptive statistics (mean, standard deviation [SD] and frequencies) using SPSS 12 software package (SPSS Inc. Chicago, USA). Sensitivity and specificity of the scored PG-SGA were determined by comparing total PG-SGA scores with underweight (BMI<18.5). Underweight (BMI<18.5) subjects were assigned a value of 1 while those with BMI >18.5 were assigned 0. The ROC curve, which is a plot of sensitivity against false positive rate (1-specificity), was used to compute sensitivity, specificity, and negative- and positive predictive values for each PG-SGA score cut-off point ranging from 0 to 38. This curve determined the PG-SGA score cut-off point with the highest accuracy (minimal false positive and negative results). ROC curve was generated using STATA 8 statistical package for windows (StataCorp Texas, 77845 USA). Correlations were calculated for different indicators, with the statistical significance set at p <0.05. Results The biographic characteristics of the study group are indicated in table 1. The mean age for female and male participants was 36.17 years and 40.10 years, respectively. Males had a lower BMI (21.04) than females (24.01). The minimum and maximum BMI values for both females and males were 15.3-29.2 and 14.3-41.3, respectively. In table 2 we see the nutritional status of the study group. The prevalence of underweight among the subjects was 12% and was higher among males (20%) than females (8.9%). Over half of the subjects (58.2%) had BMI within the normal range. The results also revealed that 23.5% of the subjects were overweight while 6% were obese. According to Global PG-SGA rating illustrated in table 2, 62.7% of the subjects were in stage B (thin) while 9.2% were in stage C (very thin). Comparison of nutritional Comparison of nutritional status by global PG-SGA rating and BMI (Table 2) showed majority of HIVinfected adults were malnourished and this prevalence was much higher as indicated by global PG-SGA rating than that indicated by BMI. Chi square analysis of the relationship between global PG-SGA categories and BMI indicated that an association existed between the two nutritional status assessment tools (p <0.0000). A significant weak correlation was observed between the PG-SGA scores and BMI (r= -0.311, p <0.000). From the ROC curve analysis shown in Figure 1, the area under the curve for the test variable (BMI) was 0.661(95% CI: 0.592-0.722). This area (p = 0.0013) indicates that PG-SGA cut-off (8 points) obtained from the ROC curve did adequately discriminate between underweight and normal subjects. The results from ROC curve analysis. Indicated that the PG-SGA score cut-off point of 8 had the highest accuracy (minimal false positive and false negative results) for screening subjects with BMI <18.5. At this point, the sensitivity of the scored PG-SGA was 69.2%, while its specificity was 57.1%. The associated positive predictive value was 36.4%, whereas negative predictive value was 83.2%. Overall, PG-SGA correctly classified 55.3% subjects as underweight. The tool had higher negative predictive value (83.2%) as compared to positive predictive value (36.4%). Discussion The current prevalence of underweight indicated by BMI among the subjects is lower than the 13.3% prevalence reported in a similar population in TASO, Mulago14. This lower prevalence of underweight could be due to improved medical care in terms of treatment and prevention of opportunistic infections and decreased HIV and AIDS stigma among PLHIV. It could also be as a result of better nutrition due to nutritional counseling and education. The results also revealed co-existence of overweight (23.5%), obesity (6%) and underweight (12%) among the studied patients. It is therefore important that nutritional status assessment is continued so as to identify and correct underweight and overweight among the subjects. The findings from PG-SGA categories showed the majority of HIV-infected adults were malnourished (62.7% moderately malnourished/thin and 9.2% severely malnourished/very thin) and this prevalence was higher than that indicated by BMI. This is mainly because Global PG-SGA rating is derived from many more risk factors such as deficits in dietary intake, nutrition impact symptoms, physical examination, weight loss and function. The findings from PG-SGA categories are the first in this population in Uganda and thus comparison is not possible. However, this finding is consistent with what was obtained among patients with heart disease in Brazil12. Our study also revealed a significant association between BMI and PG-SGA categories for the study group. These results indicate Global PG-SGA may help identify more patients at risk of developing malnutrition before adverse changes in BMI occur. The current study found that the scored PG-SGA score >8 had a low sensitivity and a low specificity for characterizing the risk for malnutrition indicated by BMI. Since the area under the ROC curves was <0.7, this indicates that the scored PG-SGA could not adequately discriminate17 between underweight and normal subject and therefore failed to correctly identify about 30% of underweight subjects. Misclassifying underweight patients means that they will be left out and cannot get timely health and nutrition interventions for overcoming malnutrition risks. Consequently, their health and nutritional status will be adversely affected. The limitation of the tool in correct identification of all underweight subjects could be explained by the fact that PG-SGA scores reflect many risk factors for malnutrition. Besides changes in weight, PG-SGA also includes nutrition impact symptoms (such as vomiting, diarrhea and anorexia), dietary intake, functioning, physical examination, metabolic disturbances and diseases. This reveals that not all subjects classified by BMI as being underweight had PG-SGA scores >8. It is possible for subjects to obtain PG-SGA scores e”8 without being underweight depending on their pre-HIV infection nutritional status. Recent studies among HIV-infected women in Sub-Saharan countries have reported increased proportions of overweight and obese patients15. Even the current study showed over 6% of patients were obese, 23.5% were overweight and 58.5% had normal weight. All these patients experienced nutritional problems such as weight loss, vomiting, anorexia, early satiety and reduced dietary intake. All these factors contribute to PG-SGA score <8 and yet the BMI of the patients is greater or equal to 18.5.The study group was also diverse in terms of HIV progression and yet this was not controlled for during the study. This may have reduced the accuracy of the tool in identifying subjects at risk of malnutrition as indicated by BMI <18.5. Although there are currently no published PG-SGA validation studies among HIV-infected ART naive adults, the obtained results are also comparable to earlier studies by Yamauti12 and Bauer16. Yamauti and colleagues compared Subjective Global Assessment (SGA) with anthropometric measurements (body weight, midarm circumference, triceps skin fold thickness and arm muscle circumference) and found that SGA composite score of 16 points had the highest sensitivity (62.2%) and specificity (55.7%) for identifying cardiac patients with malnutrition indicated by anthropometric measurements. According to another validation study of PG-SGA as an assessment tool in cancer patients, BMI was correlated with PG-SGA16. The association between PG-SGA score and BMI is not wholly due to the weight of the subjects because change in weight section of the tool contributes to a maximum of 5% of the total PG-SGA score. Current weight of the patients that is part of BMI is not directly used in the calculation of PG-SGA score but rather in determining changes in weight over the past 6 months. This shows the correlation between the BMI and PG-SGA is not therefore entirely due to weight similarity. Conclusion The study showed that there was a high prevalence of malnutrition among the study group. However, overall PG-SGA could not adequately discriminate between underweight and normal subjects. The tool was thus not reliable enough for assessing nutritional status in this population. A longitudinal study using BMI and more objective anthropometric tools is recommended to confirm the reliability of the scored PG-SGA for determining nutritional status among HIV-infected adults in TASO and other HIV care centres in Uganda. References
Copyright © 2011 - African Health Sciences The following images related to this document are available:Photo images[hs11063t4.jpg] [hs11063t3.jpg] [hs11063f1.jpg] [hs11063t2.jpg] [hs11063t1.jpg] |
| |||||||||