 |
| About Bioline | All Journals | Testimonials | Membership | News |
|
||||||
|
||||||
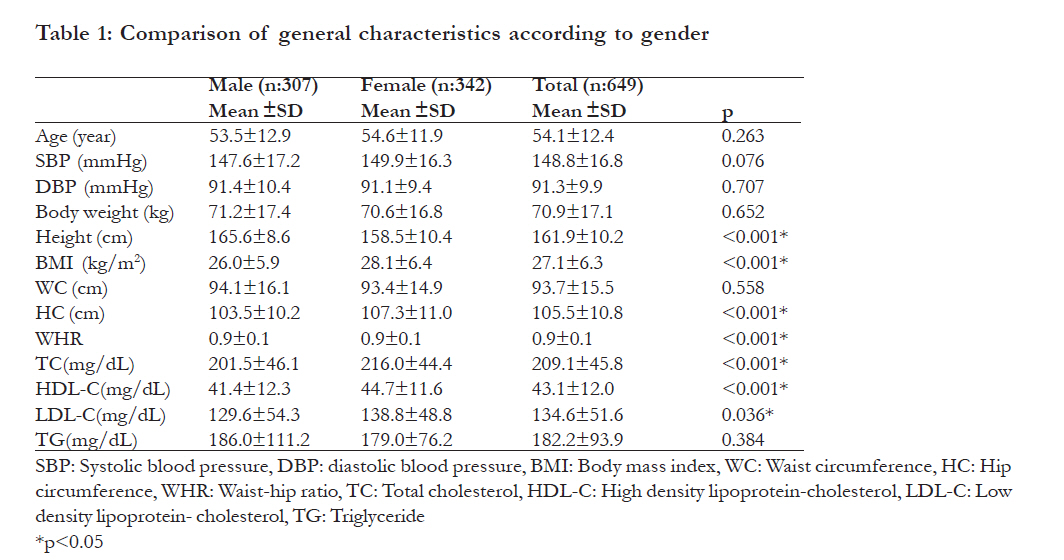
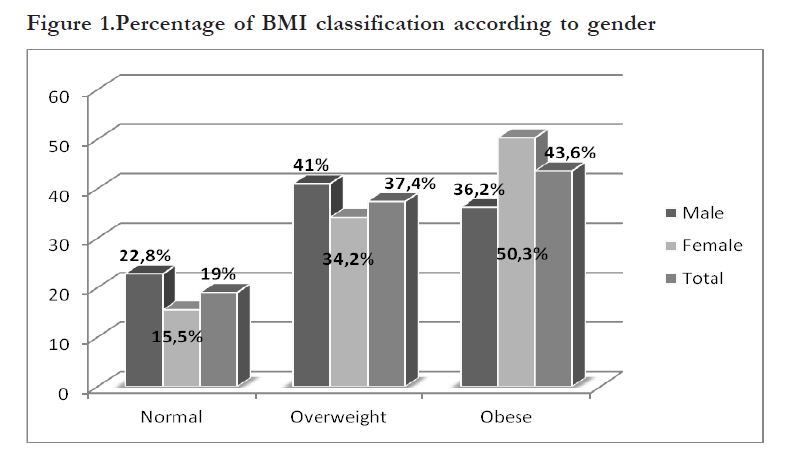
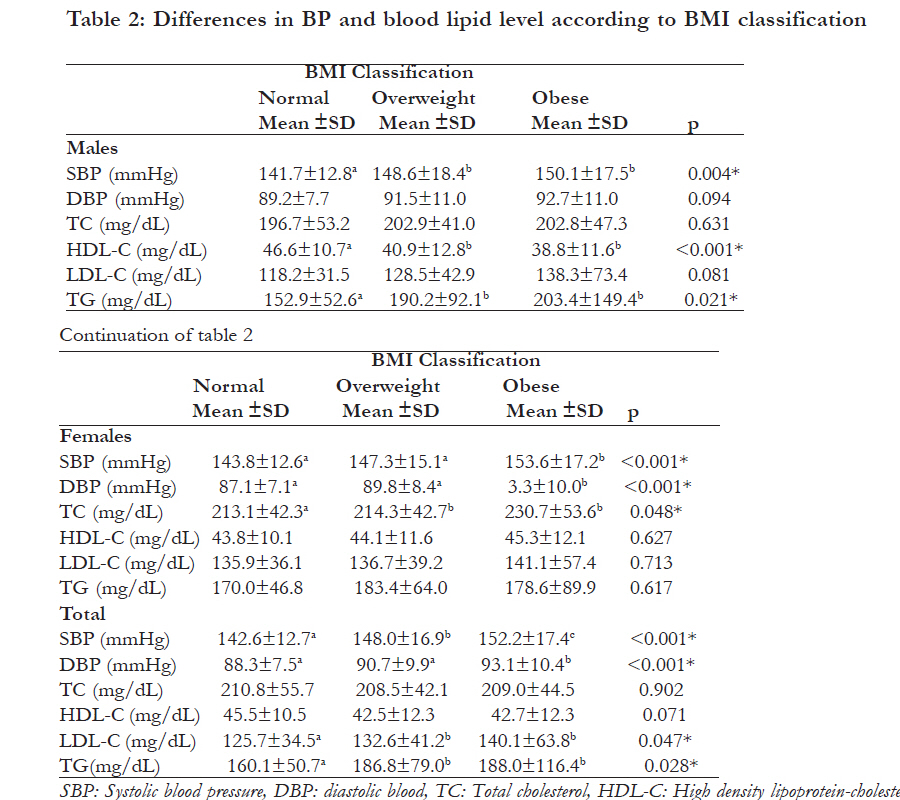
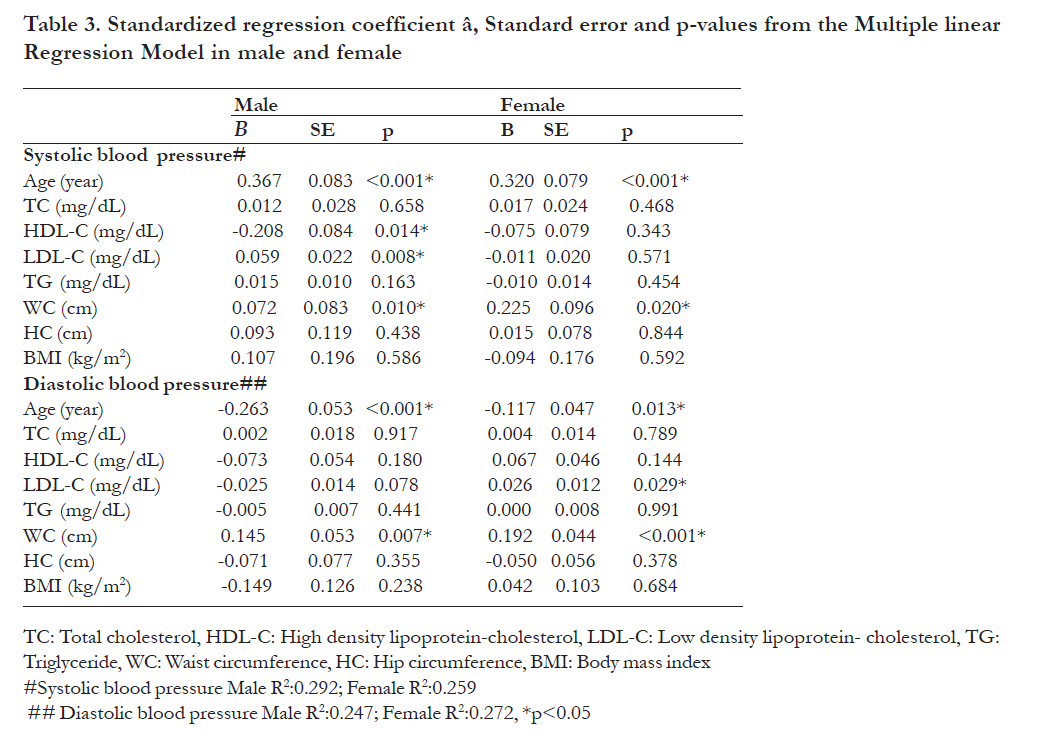
African Health Sciences, Vol. 11, No. 3, Sept, 2011, pp. 407 - 413 The association of anthropometric measurements and lipid profiles in Turkish hypertensive adults Hilal Yildiran, Acar TN, Koksal E, Gezmen KM, Akbulut G, Bilici S, *Sanlier N Department of Nutrition and Dietetics, Faculty of Health Sciences, Gazi University, Besevler, Ankara, Turkey Code Number: hs11085 Abstract Background: Few studies have associated anthropometric measurements and lipid profile with hypertension in adult populations and to the best of our knowledge none has been done in Turkey Keywords: Hypertension, body mass index, waist circumference, lipid profiles. Introduction Hypertension, as defined by Joint National Committee-7, is an important public health problem worldwide and is the most widely recognized modifiable risk factor for cardiovascular disease, cerebrovascular disease (stroke) and end-stage renal disease1,2. Worldwide, prevalence estimates for hypertension may be as much as one billion individuals per year, and approximately 7.1 million deaths per year may be attributable to it3. In particular, Turkey has a high prevalence figure of hypertension: age- and gender-adjusted prevalence was 31.8% 4. Obesity is a major independent risk factor for hypertension5. The performance of different anthropometric measurements and indices in predicting obesity-related outcomes has been addressed in several reports6-8. There is, however, controversy regarding which anthropometric indicator best defines obesity and conveys the highest risk of hypertension5. Cross-sectional and prospective epidemiological studies have shown that blood pressure (BP) and, worse still, hypertension increases significantly with higher body mass index (BMI) and waist circumference (WC) 7,8. Hypertension is also positively associated with a cluster of risk factors characteristic of the metabolic syndrome, of which overweight/central obesity could be the cornerstone. Indeed it is recommended that management of arterial hypertension should focus both on lowering high BP and correcting associated lipid disorders9. The present study was therefore undertaken to determine and evaluate the overweight/obesity and hiperlipidemia status in a group of hypertensive adults. Methods This study was conducted among 649 (307 male, 342 female) hypertensive adults with an age range of 20 to 64 years between November 2009 and May 2010 in Ankara, Turkey. The participants were chosen randomly from the nephrology clinics of governmental hospitals. All subjects were hypertensive and they had no chronic diseases. The study design was case series. In total, 931 individuals were admitted to the clinics but the individuals who had not had lipid profile analyses in the last month were excluded from the study sample. We used data of individuals who had had lipid profile analyses in the last month. The lipid profile included total cholesterol (TC), high-density lipoprotein-cholesterol (HDL-C), low-density lipoprotein-cholesterol (LDL-C) and triacylglycerols (TG). Early-morning venous blood samples had been obtained from each participant for biochemical screening tests, following a twelve-hour overnight fasting. Professional staff had performed venipuncture by using vacutainers to obtain 15 ml of whole blood. Blood had been centrifuged for plasma separation at the governmental hospitals where the actual biochemical analyses were performed. Roche Diagnostic Kits were used for TG, HDL-C and TC analysis. The LDL-C was calculated by Friedewald and colleagues’ formula; LDL-C= TC - (HDL-C + (TG/5)) 10. In this study, BP measurements were performed by specially trained and experienced healthcare workers. Sitting BP was measured after 10 minutes of rest with a standard adult sphygmomanometer at the beginning of the interview and again at the end. The mean BP value was used for analysis. Hypertension was defined on the basis of the Joint National Committee-7 cut-off point of 140 mmHg and above for systolic blood pressure (SBP) and/or 90 mmHg and above for diastolic blood pressure (DBP), and also took into account whether the subject was on antihypertensive medication11. After measurement of SBP and DBP volunteers were included if they met these criteria: All anthropometric measurements were taken by trained dieticians and with participants wearing light clothes and no shoes. A portable scale was used to measure body weight to the nearest half-kilogram. Height was measured to the nearest 0.1 cm with a wall-mounted stadiometer. Body mass index (kg/m2) was calculated by weight in kilograms divided by the square of height in meters. Adults were classified according to their BMI into three groups: normal weight (BMI: 18.5-24.9 kg/m2), overweight (BMI: 25.0-29.0 kg/m2) and obese (BMI e” 30 kg/m2)12. Waist circumference was measured above the iliac crest and below the lowest rib margin at minimum respiration. Hip circumference (HC) was measured at the widest part of the hip at the level of the greater trochanter to the nearest halfcentimetre13. The waist and hip circumferences were measured with a flexible tape. None of the participants used any vitamins, mineral supplements or oral contraceptives. None of the females were pregnant or breast-feeding. The participants were informed about the subject, purpose and rules of the research. Each participant signed a voluntary participation form. Data Analysis The data analysis was carried out using SPSS version 13.0 software (SPSS Inc., Chicago, IL, USA). The descriptive statistics of means with 95% coefficient interval were used to summarise the data collected. Means were compared by using independent, the ttest according to gender. Pearson’s correlation coefficients were used for continuous variables. Oneway analysis of variance (ANOVA) was conducted to compare the anthropometric measurements and lipid profiles of the participants on BMI classification. A significance level of 0.05 was used in all statistical analyses done in this study. Results Mean age, BP, anthropometric measurements and blood lipid levels of participants according to gender are given in [Table - 1]. Mean age of participants was 54.1±12.4 years. Mean SBP and DBP of participants were 147.6±17.2 and 91.4±10.4 mmHg for males and 149.9±16.3 and 91.1±9.4 mmHg for females, respectively. There were significant differences between height, BMI, HC, TC, HDL-C and LDL-C according to gender (p<0.05). No statistically significant differences were found in BP measurements by gender (p>0.05); but SBP was found to be higher in females than in males. In the evaluation of BMI classification, 43.6% of subjects were classified as obese and 37.4% of them overweight. In terms of gender prevalence obesity was higher in females (50.3%) although prevalence of overweight was higher in males (41.0%) as shown in [Figure - 1]. According to BMI classification SBP was significantly evaluation of BMIs for lipid profile HDL-C in higher in obese males and females, and DBP was normal males, TC in normal females was found to only higher in obese females (p<0.05). In the be lower than in other BMI groups [Table - 2]. Age and WC in particular were the most related factors for SBP and DBP in both genders (p<0.05). In addition, LDL-C was found to be positively associated with SBP in males and DBP in females and only in males HDL-C level was found to be negatively associated SBP with (p<0.05) [Table - 3]. Discussion There is much evidence showing that being overweight and having hypertension are positively associated in developed countries14-16 but only a few published data analysing the relationship betweenbeing overweight and hypertension17-19 are available in developing countries, which have relatively lower overweight rates. We aimed to determine the overweight/obesity and hiperlipidemia status in a group of hypertensive adults in this study. Generally the studies data indicated that age has a positive correlation with BP14,15,20. Park et al.20 found that there was a significant difference in hypertension prevalence between the age groups: hypertension prevalence rates of 19-29-year-old and 30-49-year-old groups were 3% and 14.6%, respectively (p<0.001). In another study, the prevalence rate of hypertension between 25 and 64 years of age was 18.9 % and between 45 and 64 years it was 33.5 % 15.Similarly, in this study, age was found to be positively related with SBP and DBP (p<0.05). Cross-sectional and prospective epidemiological studies have shown that BP and hypertension risk increase significantly with higher BMI5,7,21-23. The relation between BP and BMI is explained by an increase in body weight and thus BMI is related to increases in body fluid volume, peripheral resistance, and cardiac output23. Individuals with a BMI of 24 kg/m2 or more showed an increase in both SBP and DBP20. A study done in the United States has shown that the risk of hypertension increases by 12% for an increase of 1 kg/m2 in BMI24. In our study, the mean BMI of hypertensive males was 26.0±5.9 kg/m2 and that of females was 28.1±6.4 kg/m2 . In this study, we classified obesity according to BMI and we found that SBP of overweight and obese males was higher than for normal-weight males, but only obese females’ SBP and DBP were higher than that of normal-weight groups (p<0.05). In both genders SBP and DBP of obese people were significantly higher than for other groups. It was seen that, although the hypertensive adults in this study had antihypertensive medical therapy, their BP tends to increase with an increase of their body weight. It is known that weight loss moderates activation of the renin–angiotensin–aldosterone axis and the sympathetic nervous system and diminishes sodium retention. Decreases in abdominal visceral fat also improve the functioning of both conduction and resistance of vessels25. The long-term effect of weight control has demonstrated elsewhere that weight reduction could lower the odds of hypertension by 77%26This is a very important point for our subjects: with the help of a weight-reducing diet , BP would be lower and therefore better than it is now. Compared with BMI, WC and WHR are good indicators for body fatness in adults at the population level and provide additional information about central fat distribution23,27,28. Men whose WC increased >6 cm had an odds ratio of 1.22 of becoming hypertensive compared with those whose waists decreased7. A follow-up study using casual BP measurement reported that among males with WC-102 cm the odds ratio for hypertension was approximately three times that of males with waist circumference <94 cm and females with WC-88 cm have a risk of hypertension twice that of females with WC<80 cm8. In this study hypertensive females had higher mean WC than risk level, but in males mean WC was at border level. In addition to this, both gender WC were found to be related with both SBP and DBP Tuan et al.23 studied on 7,336 Chinese adults aged 18 to 65 years in the 2004 China Health and Nutrition Survey and found that the prevalence of hypertension (17% and 23% for women and men, respectively) was significantly and positively related to increased BMI, WC, and WHR (p for trend < 0.001) 23. Similarly, in another study it was found that weight, BMI, and WC were significantly different between normal and hypertensive groups; the hypertensive group had higher weight, BMI, and WC than the normal group (p<0.001) 20. In the present study, in both genders WC were found to be related with both SBP and DBP. There is evidence of a relationship between serum lipids and blood pressure. Furthermore, a combination of hyperlipidaemia and hypertension increased the risk of cardiovascular disease in a potentiating rather than an additive manner14,27. Research has shown that low HDL-C, high LDL-C and high TG levels are positively associated with an increase in BMI14,18,27. Xu et al.27 indicated that there was a significant upward trend for blood pressure, TG, TC, and LDL-C to increase, whereas HDL-C decreases, with increasing BMI and WC adjustment for age. In the same study, for men and women the age-adjusted means of TC, LDL-C, TG, SBP and DBP were higher. In this study, we observed that hypertensive overweight and obese subjects had lower HDL-C levels than normal-weight hypertensive people, but no statistical significance among BMI classes was noted. In the regression analysis model, LDL-C was found to associate with SBP in male and DBP in female positively and HDL-C was found to associate with SBP in males negatively (p<0.05). Similarly to our study, in another study it was found that significantly more non-medicated and medicated hypertensive subjects had higher LDLcholesterol and lower HDL-cholesterol than normotensive subjects14. Study limitations The main limitation of this study is that we were not able to adjust for, e.g., the physical activity level, dietary food intake and socioeconomic status of participants: Further studies therefore need to be conducted on a large population. Additionaly the blood pressure of participants was taken during the interview three times. These measurements might not reflect the changes in the blood pressure during the day. Conclusion Central obesity is a stronger correlation factor than BMI for high blood pressure. This study suggests that earlier prevention of excessive weight gain is needed to reduce hypertension in these populationbeneficial effects of lifestyle modification, and this and the ‘Dietary Approaches to Stop Hypertension’ (DASH) diet should be top priorities for health and government officials. Epidemiological studies are needed to indicate the relation between central obesity and hypertension incidence across the country. Acknowledgement We would like to thank all the participants who devoted their time to participate in this study. Their helpful and wholehearted cooperation is warmly acknowledged. References
Copyright © 2011 - African Health Science The following images related to this document are available:Photo images[hs11085t2.jpg] [hs11085f1.jpg] [hs11085t3.jpg] [hs11085t1.jpg] |
| |||||||||