 |
| About Bioline | All Journals | Testimonials | Membership | News |
|
||||||
|
||||||
African Health Sciences, Vol. 11, No. 3, Sept, 2011, pp. 421 - 426 Comparative performance of HbA1c 6.5% for FPG >7.0 vs 2hr PG>11.1 criteria for diagnosis of Type 2 diabetes *Adamu AN Department of Medicine, University of Ilorin, Nigeria
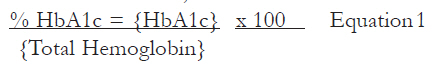
Code Number: hs11087 Abstract Background: International expert committee on the use of HbA1c to diagnose diabetes mellitus in 2009 and World Health Organization (WHO) in 2011 has advocated the use of HbA1c to diagnose diabetes mellitus. Key words: HbA1c, Diabetes diagnosis, Fasting Plasma Glucoe, 2-hour post-prandial glucose. Introduction The prevalence of diabetes mellitus (DM) has more than doubled in the last two decades in Nigeria1,2. A national survey reported an average prevalence of 2.2% in the late 1990s1 and it is currently put at 4-5% among 20-79years old age group2. The global projection of DM from now is put at 54% by the year 2030 and poor resource nations, like Africa, it will increase by 98%2. Similarly, the projection among those that are 20-79years old by year 2030 it will be 7-9%2.The health implication and financial burden of DM and its consequent complications is estimated to increase dramatically and could consume as much as 40% of some countries budget3. Traditionally, measurement of HbA1c levels has been largely restricted to monitoring diabetic patients. However, HbA1c was endorsed for diagnosis of DM by the International Expert Committee Report on the role of HbA1c assay in the diagnosis (IECRHbA1c) of DM and was also recommended by World Health Organization (WHO)4,5. A diagnostic cut-off point of 6.5% was recommended, based on the risk for developing microvascular complications such as retinopathy. The advantages of HbA1c assay is that it is quicker to perform, reflect longer term glycaemia (up to three months) and is less affected by current stress levels (physical or emotional). Therefore, it is more likely to give an accurate result. Glucose tests do not have these advantages; however, HbA1c is not accurate in individuals with certain conditions like haemoglobinopathies. Oral glucose tolerance test (OGTT) is considered by the WHO as “gold standard” 6 and recognized by American Diabetes Association (ADA) for the diagnosis of DM. It is more sensitive and specific; however it is less reproducible, more time consuming, expensive and more inconvent. Because of the problems with OGTT, ADA has adopted use of fasting plasma glucose (FPG) for the diagnosis of DM which is also acknowledged by WHO because it is faster, easier to perform, more convenient and acceptable to patients and less expensive compared to oral glucose tolerance test7. High normal blood pressure and hypertension are associated with the development of type 2 DM8. These associations persisted even after adjustments for several known or suspected predictors of type 2 DM, including age, body mass index (BMI), smoking habit, leisure-time physical activity, parental history of type 2 DM and daily alcohol consumption8,9. None of the available studies has used the new cut off value of HbA1c advocated by IECRHbA1c/ WHO to compare the diagnostic yield between FPG and 2hour plasma glucose of OGTT (2hrpp) criteria among hypertensive Nigerians. The aim of this study is thus, to compare the performance of IECRHbA1c with FPG and 2hrpp criteria. This comparison shall be useful in giving credence to the test that gives a better performance and help in choice selection of diagnostic standard in subsequent studies. Methods Study design and location It is a cross sectional study. It was carried out at the Department of Medicine of the Lagos University Teaching Hospital (LUTH) and the Endocrine Unit Laboratory of the Department of Medicine of the College of Medicine, University of Lagos over a period of three months, from January to March 2004. Subjects The subjects recruited for screening for type 2 diabetes were those with a known history of systemic hypertension on life-style modification and/ or drug(s) for the control of the hypertension. They attended the Cardiology and Renal units’ medical out patients’ department of the hospital. Those patients with established secondary form of hypertensions, chronic renal failure and chronic liver disease were excluded from the study. They are not previously known to have diabetes. Sample Size Thirty-three subjects were recruited although two HbA1c assay results revealed error. The remaining thirty one results were finally used for the data analysis. Approval was obtained from the Ethical Committee of the Lagos University Teaching Hospital. An informed consent was obtained from the patients/ subjects before commencing the studies. The patients on usual medical follow up were approached and given a brief health talk on the importance of screening for diabetes among people with systemic hypertension. A questionnaire containing biodata and anthropometry of the subjects were taken. The information taken included: name, age, gender, hospital number, height (m) with measurement taken to the closest centimeter, weight (kg) to the closest mg, and BMI calculated as the ratio of weight in kg to the square of height in m. Waist circumference was taken at umbilical level, to the closest centimeter, hip circumference was measured at the widest dimension of the buttocks, to closest centimeters. Waist to hip ratio was calculated by finding the ratio of the waist to that of hip10. Procedures for OGTT and HbA1c Assay At 7.30am, after an eight hour over-night fast, all had their venous blood sample taken for HbA1c and FPG. Subsequently, they were given 75gm of dissolved anhydrous glucose in chilled water to drink at once. Another blood sample was taken at 9.30am, 2hrpp. The samples for FPG and 2hrpp were centrifuged, and aliquots were prepared within 30 minutes of collection. Plasma aliquots for glucose determinations were frozen at -80oC until conduction of the analyses in the same laboratory. Plasma glucose was analyzed according to the method of Trinder11 using glucose oxidase enzyme buffered in phenoxylate and dissolved in colour reagent. The coefficient of variation for intra-assay was 3.5% and inter-assay was 9% for FPG and 2hrpp. FPG of e”126mg/dl and 2hrpp of e”200mg/dl is considered to have DM as “gold standard”. HbA1c determination HbA1c assay were run immediately using DCA 2000® autoanalyser machine and reagent kit produced by Bayer Corporation Inc, USA.This assay is based on a latex immunoagglutination inhibition method (DCA 2000®+ Manual). This provides a convenient, quantitative method for measuring the percentage concentration of HbA1c in blood; both the concentration of HbA1c specifically and the concentration of total haemoglobin are measured, and the ratio reported as percent HbA1c. The chemical principle for the measurement of total haemoglobin: potassium ferricyanide is used to oxidize haemoglobin in the sample to thiocyanate to form thiocyan-methemoglobin and the coloured species which is measured. The extent of colour development at 531nm is proportional to the concentration of total haemoglobin in the sample. The procedure for the measurement of specific HbA1c is as outlined by the leaflet that comes with the kit (DCA 2000®+ Manual). Computation of percent HbA1c is shown in equation 1 below. The HbA1c of <6.5% was considered not to have DM and > 6.5% was considered to have DM. The percentage HbA1c in the sample is then calculated as follows;
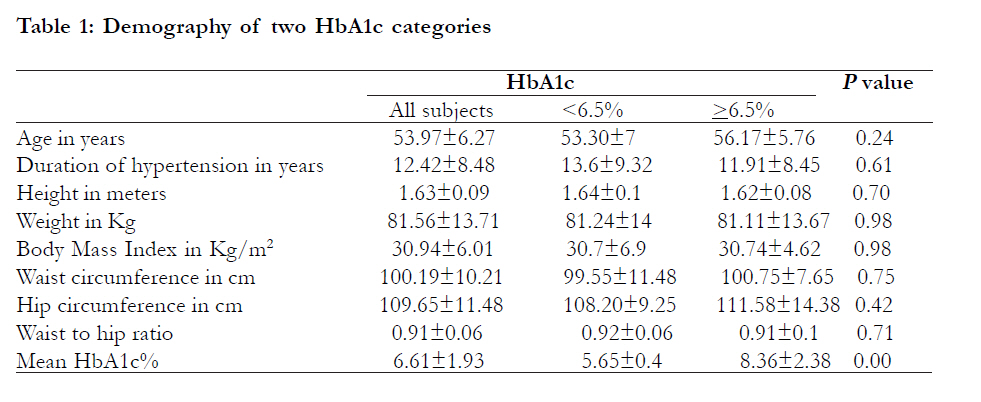
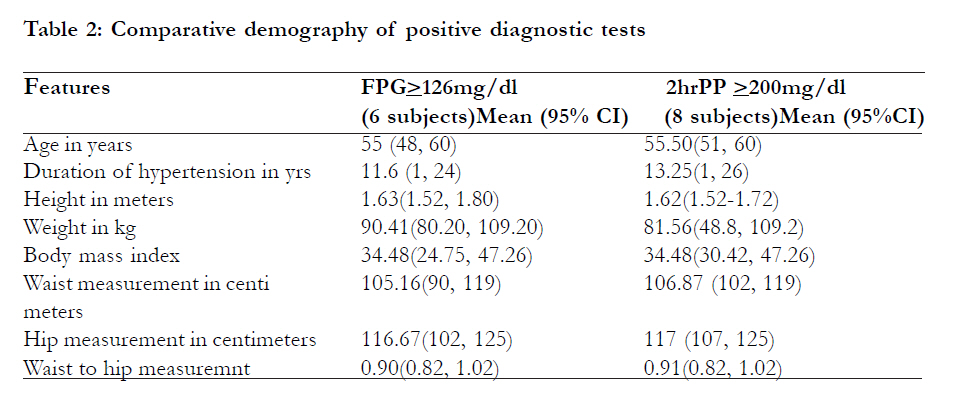
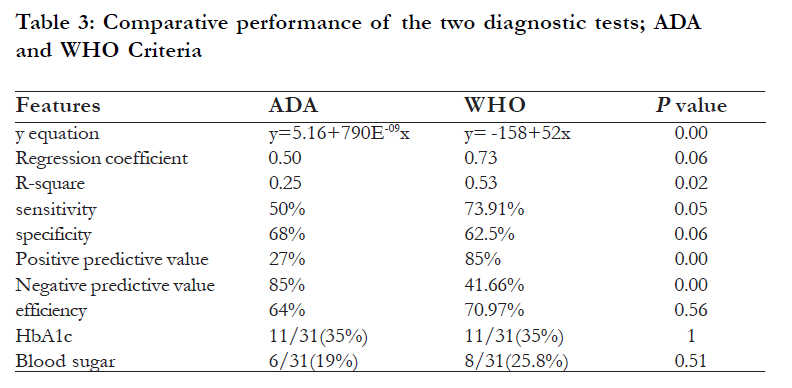
The coefficient of variation of assay method was 0%, depicting a high precision of the machine and method. Statistics The Analysis of data was done with SPSS version 11. The Means±SDs or mean (confidence interval) were assessed for continuous variables, and frequencies and proportions were assessed for categorical variables. Differences among groups with FPG and 2hrpp parameters were assessed using t-test and p < 0.05 is considered significant. Sensitivity, specificity, predictive values and efficiency were assessed from 2x2 table made between HbA1c and the two diagnostic tests. A plot of correlation was made using a linear regression model where r, rsquare and y were estimated. Definitions Sensitivity is the proportion of those with FPG >126mg/dl and 2hrpp >200mg/dl that were detected as positive by HbA1c. Specificity is the proportion of those with normal FPG <126mg/ dl and 2hrpp <200mg/dl and were detected to have HbA1c <6.5%. Positive predictive result is the proportion of HbA1c positive results in a mixed population of sick and healthy people using FPG and 2hrpp criteria. Negative predictive value is the proportion of HbA1c negative results in a mixed population of sick and healthy people using FPG and 2hrpp criteria. Efficiency is the percentage of the sum of the true positives and the true negatives of the grand total population. Result The mean age of the 31 participants in the study was 53.97±6.27years. Twenty four (77.42%) were females. The mean±SD demography of the subjects and the differentiating demography of those who had positive and negative tests by HbA1c and FPG and 2hrpp is shown in [Table - 1] and [Table - 2]. Twenty five (80.64%) had a negative FPG test. Twenty (64.51%) had HbA1c <6.5%. Twenty three (74.2%) had negative 2hrpp. Among those who had the FPG test; the mean±SD FPG was 126.55±122.38mg/dl and range was 60- 583. The mean FPG among those with negative FPG was 86.27±17.41mg/dl (range 60-124), while among those with positive FPG was 294±216mg/dl (range 130-583) and had a significant difference (p =0.00). The mean 2-hrpp was 187.43±138.59mg/dl (88.24- 702). The mean 2-hrpp among those with negative test was 134.64±41.68mg/dl (range 88.24-246.60) while among those with a positive test it was 407.40±186.84 (range 165.60-702) which was significant (p=0.00). The mean HbA1c was 6.61±1.93% (range 4.60-14). The mean HbA1c among those with negative results was 5.65±0.4, while among those with positive tests was 8.36±2.38% with a significant difference (P=0.04). The prevalence of new diagnosed DM by HbA1c in both groups was 11/31 (35%) and by FPG was 6/31 (19%). Cross tabulation of 2x2 table revealed true positive were three, true negative were 17, false positive and false negatives were eight and three respectively. Evaluation of performance in terms of sensitivity, specificity, correlation of HbA1c and FPG, positive predictive value, negative predictive value and efficiency is shown in [Table - 3]. Among those who had 2hrpp, the mean 2hrpp was 187.43±138.59 (range 88.24-702). The mean 2hrpp among those with a negative test was 124±25.28 (range 88.24-176.40) while among those with a positive test it was 369.67±170.72 (205.20-702) which was statistically significant (P v=0.00). The mean FPG among those with a negative test was 85.86±19 (range 60-130), while among those with a positive test it was 243.56±204.84mg/dl (range 99-583) which was found to be significant (p =0.00). The mean HbA1c among those with a negative test was 6.15±1 (range 5-9.70) while among those with positive test it was 8±3.22 (range 4.60-14) which was also statistically significant (p =0.02). The prevalence of new DM by 2hrpp was 8/31(25.8%). Evaluation of performance of HbA1c and 2hrpp in a 2x2 table showed true positive result of five, false positive of six, true negative of 17 and false negative of three. Results of sensitivity, specificity, efficiency, correlation regression between HbA1c and 2-hrpp, positive predictive value and negative predictive value is shown in [Table - 3]. Discussion The interest in the use of HbA1c in the diagnosis of DM had recently crescendoed with the recommendation of IECRHbA1c/WHO report. This will serve as a possible replacement for FPG and / or OGTT in diagnosing DM. The proposed advantage of using HbA1c in the diagnosis of DM is the fact that it would obviate the need for the patient to undergo fasting and the associated inconvenience with OGTT. The result of our study showed that 2hrpp criteria had performed better than FPG criteria in terms of establishing new cases of DM and efficiency. This also applied to the correlation between HbA1c and the plasma glucose test; the correlation between HbA1c and 2hrpp criteria is better than between HbA1c and FPG criteria. The reported r2 in the 2hrpp group is more than twice r2 in FPG group. The result of 2hrpp criteria is also better than FPG criteria in sensitivity and positive predictive factor. the FPG criteria were marginally better than 2hrpp criteria in specificity and FPG is more than twice better than 2hrpp in negative predictive factor. A similar result of a better correlation between total glycated haemoglobin (GHb) with 2hrpp compared to correlation between GHb with FPG was reported by Agboola-Abu et al13. They reported a correlation between GHb with FPG of 0.59 while the correlation between GHb with 2hrpp was 0.73. The similarity of results may be related to race or geography, as GHb was measured and not HbA1c and the sampling method is also different compared to our study. Similar studies carried out in other parts of the world that correlated FPG, 2hrpp criteria with GHb were at aberrant to ours. Those other studies reported a better correlation between GHb with FPG compared to GHb with 2hrpp14,15. Gary et al14 reported a correlation between HbA1c with FPG of 0.640 and correlation between HbA1c with 2hrpp of 0.511 in a study of 2,877 Hong Kong Chinese subjects. The HbA1c was specifically measured in this study using automated ion-exchange chromatographic method and the sampling method is also similar to ours, since consecutive at risk subjects were recruited in this study. Despite similarity in the HbA1c measured and the sampling method, the result still differs giving credence to the earlier idea of race and geography giving rise to similarity in our result with that of Agboola-Abu et al 13. Likewise, Randie et al15 reported a correlation between HbA1c with FPG of 0.91 and correlation between HbA1c with 2-hrpp of 0.88 in a study of 381Pima Indians of U.S. The HbA1c was measured by highly precise high-performance liquid chromatography. The study design, HbA1c and sampling method was similar to ours but gave similar result to that of Gary et al14 supporting race and geography as a factor responsible for this. A dissimilar correlation between HbA1c with FPG of 0.852 and HbA1c with 2-hrpp of 0.806 was reported by Yoshihiko et al16 in a study of 2,621 Japanes subjects. HbA1c was specifically measured in this study using high-performance liquid chromatography and a similar sampling method was also used. It is important to note that HbA1c is significantly correlated with 2hrpp but not FPG in subjects without DM17. Postprandial glucose contributes more than FPG to HbA1c at the lowest levels of HbA1c, particularly among those without DM18. This statement goes in tandem with the result of our study; however, the subjects used in our study were a mixed population of DM and non-DM. The same thing applied to the randomized controlled study of Agboola-Abu et al 13. Unlike the well established fact that HbA1c is specific for diagnosing DM, but not sensitive to diagnose DM19, our result of comparison of HbA1c with 2hrpp showed a higher sensitivity result compare to specificity. However, comparison of HbA1c with FPG showed a lower sensitivity result. There is no available study that had compared FPG and 2hrpp as “gold standard” using the IECRHbA1c or any other form of GHb measurement in terms of sensitity, specificity, predictive values and efficiency. Thus, we find it difficult to compare our study with others in this regard. The limitation we encountered is the small sample size of this study. It would have been my desire to recruit more subjects for the study. Conclusion The HbA1c correlated better with 2-hrpp compared to FPG. The comparison of HbA1c with 2-hrpp is much better than comparison of HbA1c with FPG in all parameters of statistical measurement except in negative predictive value and specificity. References
Copyright © 2011 - African Health Science The following images related to this document are available:Photo images[hs11087t2.jpg] [hs11087t3.jpg] [hs11087t1.jpg] |
| |||||||||