 |
| About Bioline | All Journals | Testimonials | Membership | News |
|
||||||
|
||||||
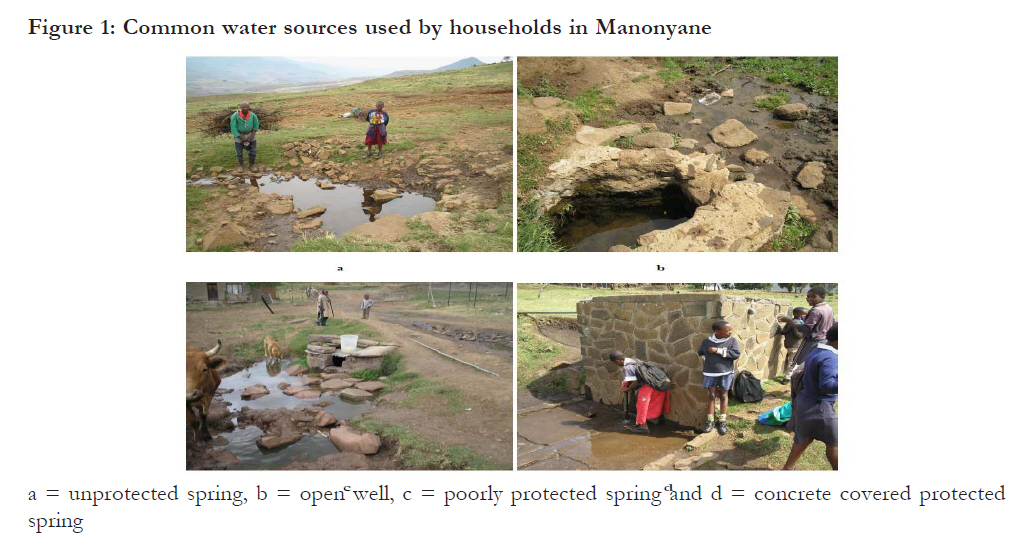
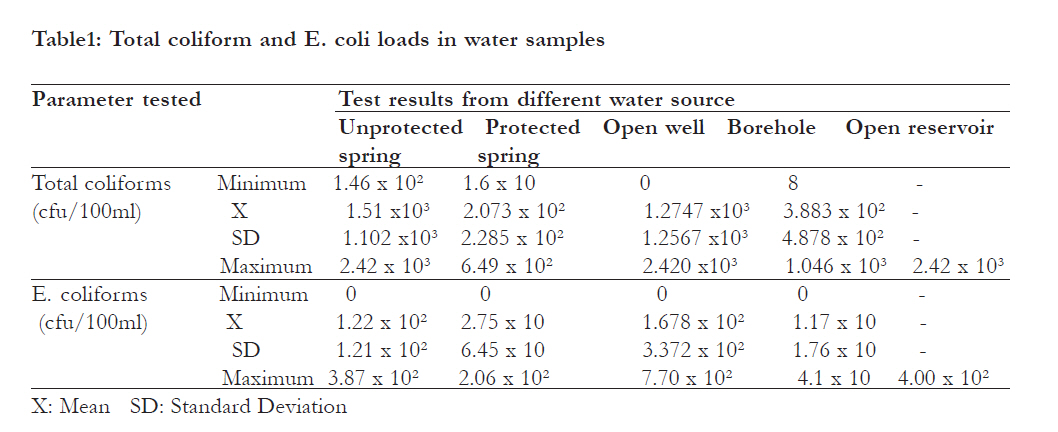
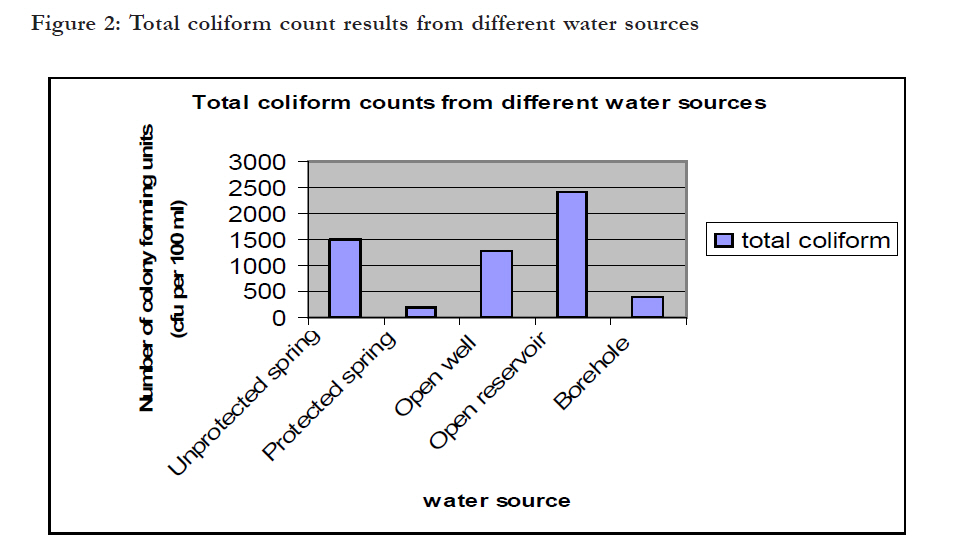
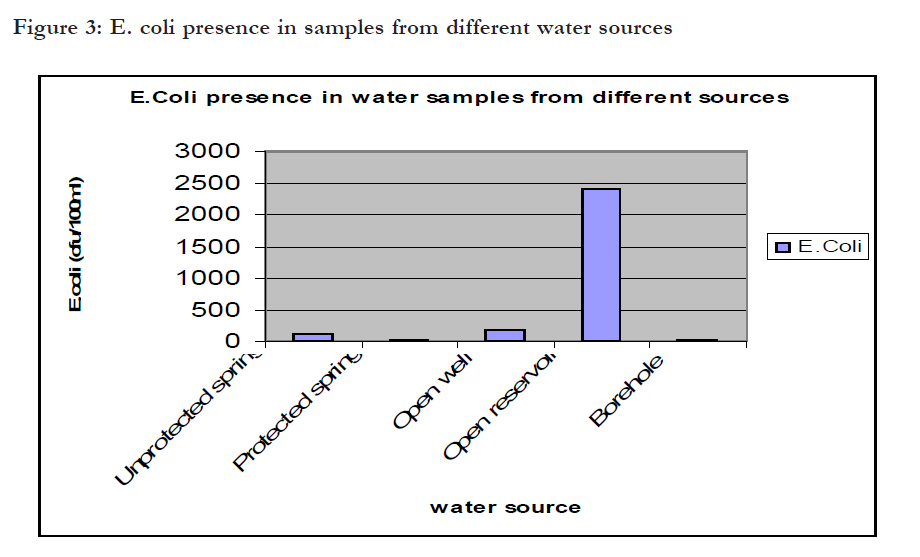
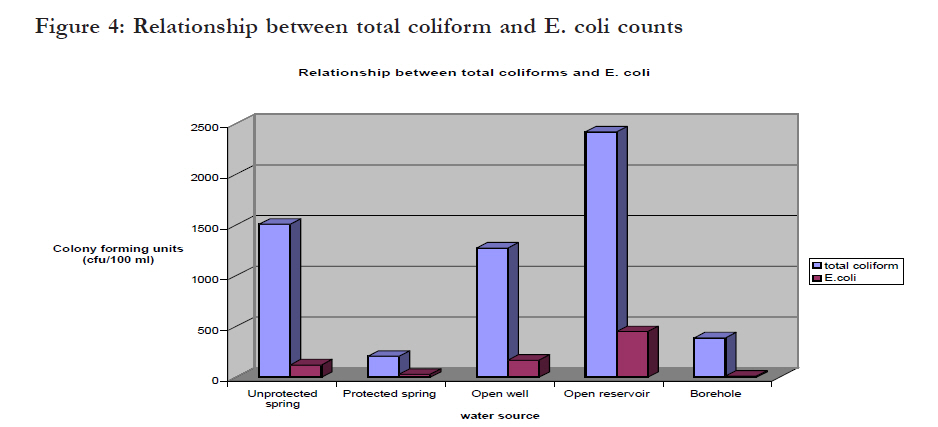
African Health Sciences, Vol. 11, No. 3, Sept, 2011, pp. 474 - 480 The microbial quality of drinking water in Manonyane community: Maseru District (Lesotho) *Gwimbi, P Department of Environmental Health, National University of Lesotho, Lesotho Code Number: hs11095 Abstract Background: Provision of good quality household drinking water is an important means of improving public health in rural communities especially in Africa; and is the rationale behind protecting drinking water sources and promoting healthy practices at and around such sources. Key words: Total coliform, E. coli, hygienic practices, households, source water protection. Introduction The rationale for promoting safe drinking water in rural communities in developing countries is the persistently high levels of water related morbidity and mortality24. Globally, unsafe drinking water coupled with poor sanitation kill at least 1.6 million children under the age of five every year, 84% of them living in rural areas26. If the current trend persists, nearly 1.7 billion rural dwellers will not have access to safe water and improved sanitation by 201526. In Lesotho, a predominantly rural country with nearly 85 percent of the population living in rural areas, traditional drinking water sources such as open reservoirs, springs and open wells are still being used by rural communities14, 15, 26. Water from such sources seldom complies with WHO permissible standard limits for drinking water 13, 21. While available literature9, 10, 21 point to a rural population having access to safe water supply at 62%. The remaining 38% dependent on these traditional water sources are highly vulnerable to water borne diseases14,15 . With insufficient information about the contaminants in drinking water sources, little can be done to mitigate the problem. There is therefore a need to check regularly for contaminants threatening water safety of such drinking water sources in order to provide measures capable of mitigating outbreak of water related diseases. Safe drinking water is defined by WHO25 as that water having acceptable quality in terms of its physical, chemical and bacteriological parameters. Bacteriological parameters, especially Escherichia coli (E.coli) and total coliform have been used to determine the general quality of drinking water worldwide 2, 9, 16. The E. coli in particular has been found to be the most specific indicator of faecal contamination in drinking-water 9, 18. Its presence indicates contamination of water with faecal waste that may contain other harmful or disease causing organisms, including bacteria, viruses, or parasites27. Quality water requires guidelines and standards setting permissible limits for each parameter9, 10. The World Health Organization guidelines are generally adopted as the international reference point for standards by those countries that do not have their own. The WHO23, data on faecal coliform bacteria group them into the following risk categories: 0 cfu/ 100ml (conformity); 1–10 cfu/100 ml (low risk); 10–100 cfu/100 ml (intermediate risk); 100–1000 cfu/ 100ml (high risk); and 41000 cfu/100 ml (very high risk). Drinking water contaminated with E. coli is known to cause stomach and intestinal illness including diarrhoea and nausea, and even lead to death6. Total coliform, while not being regarded as a health threat in itself; has been used as an indicator of other potentially harmful bacteria such as E. coli and other viruses and parasites10, 18, 27. In Lesotho the quality of water in rural communities has mostly been analysed at a macro level. There is less information at micro level about the quality of water from community water sources and the strategies communities use to address associated challenges. The objective of this study was to assess, at micro level the E.coli and total coliform counts in water samples from different drinking water sources in Manonyane community. A household analysis was conducted to assess the community’s perception towards the quality of its water and practices aimed at protecting its sources. The study was planned to provide information that could assist in working out a model for safe drinking water supply to the community. Methods Study area The study was conducted in the administrative area of Manonyane Community Council in Maseru District. The community council has a population of 22 4913 and is divided into nine administrative wards. Geologically the study area is dominated by exposed sedimentary rocks of the Triassic- Jurassic age of the karoo super group capped by basalts of the Drakensberg formation19. The terrain of the study area is mostly hills and valleys. In general accelerated erosion, mass wasting and sedimentation characterise the study area5. Most settlements and drinking water sources are located at the foothills. The study was cross-sectional and conducted from September to October 2009 before the onset of the rain season. Water samples were collected in 27 randomly selected household clusters of the nine administrative wards of Manonyane. Once in the sampled household cluster, water sources used by the community as the source of drinking water were identified with the assistance of members of the communities. The set of water samples taken were as follows: 13 samples from unprotected springs, 9 samples from protected springs, 6 samples from open wells, 6 samples from boreholes, 1 sample from open reservoir. The strategy was to capture all types of water sources used by the community. A protected spring was defined as a spring that was properly covered by stone masonry or completely covered by a concrete block [Figure - 1d]. Water samples were collected in 500 ml sterile bottles that were fitted with screw caps, labeled and kept in a cooler box before being transported to the laboratory for analysis. The samples were analyzed within six hours of collection. Water quality analysis was based on the most probable number of colony forming units (cfu) per 100 ml for the total coli form and E. coli. Descriptive statistics were used to summarize and compare the quality of water under various conditions, with results of the statistical analyses displayed graphically and in tabular form. The Pearson’s correlation coefficient between the mean total coliform and E. coli counts was calculated at p<0.05 indicating statistical significance. Relevant sanitary conditions and practices around each water source were assessed during samples collection. Eighty randomly selected households were interviewed in the selected villages to establish the water sources types’ usage. Results The usage of water sources by house holds was high with 71% (n = 80) indicating using at least two sources for their domestic water purposes in a year, 12% indicating three sources and 15% just one source. Among the households using one source, private owned sources, boreholes and permanent springs accounted for more than 60% of the water sources. The majority of households (71%) using two sources combined springs with open wells. Springs [Figure - 1] constituted water source for more than 85% of the respondents in summer. This however dropped to 68% in the dry season as some of the springs dried up. On-site water source inspections revealed that 57% of the water sources (N=35) lacked some form of protection [Figure - 1 a, b, c]. Livestock faeces as well as animals themselves were observed adjacent to some of the water sources [Figure - 1]. Evidence of washing clothes close water sources was recoded at five water sources. Other potential risks included pit latrines located near and mostly upstream of water sources and grave yards in the vicinity of sources of drinking water. About 34% of the springs were however protected with some having water tapes connected to them. Water containers used by households to draw water from the source point ranged from small aluminum metal containers to plastic buckets. More than 80% of the respondents rated their drinking water safe for consumption and indicated colorless, odourless; as well as absence of illness after drinking as indicators for judging the quality of the water. However, 60% of respondents reported having at least some concerns with safety of their water. More than 9% of the households reported at least one household member having suffered some water related illness in the past two years. Microbiological quality of drinking water from different sources The microbiological test results showed the presence of total coliform and E. coli in 97% and 71% of the water samples respectively. The variations in the number of colony forming units per 100 ml among the water sources were however wide depending on the nature of protection accorded to the water source. Generally, the average total coliform and E. coli density was relatively high in unprotected water sources compared to protected ones. Results of the means, ranges, and standard deviations of the analyzed parameters are given in [Table - 1]. Of the thirty five water samples tested, total coliforms were detected in 97% of the water samples. The number of cfu/100 ml from all the water sources except one open well exceeded the no risk WHO guidelines of zero cfu/100 ml in drinking water. The range counts (in cfu/100 ml) from unprotected spring, protected spring, open well, borehole and open reservoir water samples were 1.46 x 10² – 2.42 x 10³, 1.6 x 10 - 6.49 x 10², 0 - 2.420 x10³, 8 - 1.046 x 10³ and 2.42 x 10³ respectively [Table - 1]. The mean values were significantly high for unprotected water sources compared to those from protected sources. Wide variations of total coliform were observed within similar water sources but different levels of protection. In samples from unprotected water sources more than 50% of the water was of high risk by WHO standards. Generally, unprotected springs, open wells, and the open reservoir had more than 50% of their sources with more than 300cfu/ 100ml counts than those from protected sources [Figure - 2]. The E. coli was detected in 71% of the water samples. The number of cfu counts ranged from 0 - 3.87 x 10², 0 - 2.06 x 10², 0 - 7.70 x 10², 0- 4.1 x 10 for samples from unprotected springs, protected springs, open wells and boreholes, respectively. For the sample from open reservoirs the cfu was 4.00 x 10². There was a significant difference (p < 0.05) in E. coli counts between water samples from different sources, with the highest count (400cfu/ 100ml) having been recorded in an open reservoir water sample. [Figure - 3] shows the variations in E. coli counts for water samples from different water sources. Variations were significant (p< 0.05). More than 38% of the samples from unprotected springs (n= 13) had more than 200cfu/100ml compared to 11% (n=9) in protected springs. Open wells had about 16% of their samples (n=6) exceeding 200cfu/100ml. More than 40% of the protected springs had samples with 0cfu/100ml while 50% had 2 to 5 cfu/100ml. Boreholes equally had 60% of the samples (n=6) with no E. coli while the those samples with E. coli the counts were less than 25cfu/ 100ml. The open reservoir had its sample exceeding 220cfu/100ml [Figure - 3]. Relationship between total coliforms and E. coli counts The correlation between total coliform and E. coli counts was positive and significant (r = 0. 817, p< 0.05). Total coliform counts were significantly (p< 0.05) higher than those of E.coli. The general trend was that while densities of E. coli were lower than those of total coliform for all the water sources, the trend in the number of cfu of E. coli increasing as those of total coliforms increased was observed to be significant [Figure - 4]. The number of water samples from protected sources with total coliform of more than 100 cfu/100ml was significantly less (56% versus 95%, p < 0.05) and Escherichia coli (7% versus 40%, P < 0.05) compared with unprotected sources. Samples from borehole sources had the least microbial loads, being absent in 50% (n=6) of the samples. Discussion The presence of coliforms in drinking water is enough grounds for assuming that a potential health hazard existed because of the possible presence of pathogens1. The results of this study reveal that average bacterial density in drinking water was relatively high, especially from unprotected water sources, compared with that from protected sources. The presence of E. coli in water suggests enteric pathogens and faecal pollution8 and has been reported to be the causative agent of diarrhoea, urinary tract infection, haemorrhagic colitis, and haemolytic uraemia syndrome in similar studies elsewhere 1,6. These results provide insight into the potential health risks found in water in Manonyane community. The number of total coliform and E. coli counts found in unprotected water sources suggest though not conclusively that poor source water protection and poor sanitation conditions and practices are potential reasons for the high presence of microbiological contaminants. The big difference in the microbial counts from water samples of similar protection status might be indicative of widely varying hygiene behaviours in the households. This assertion is supported by the cleaning behaviours and habits of the household members at or near the water sources. Some washed their laundry close to water sources while others used dirty containers to collect water from the source. Contamination of water was also potentially tied to livestock and human faeces that created a diffuse source of faecal contamination to water sources, poor hygiene and sanitation practices that include laundry activities close to water sources by households; and water sources being very near or down slope of latrines. This implied the risk of contamination was very high. In a few cases there was a decrease in the numbers of total coliforms and E. coli. This was linked to the protection of the water sources and hygiene practices by the household members using the sources. Based on these findings, it is prudent to recognize the link between water quality, environmental quality, sanitation and public health. These observations suggest the need for focused interventions on source water protection and sanitation practices as this could lead to improvements in water quality at source. Challenges associated with access to safe and reliable sources of drinking water are not unique to Manonyane alone as they have been highlighted elsewhere in the literature. Inadequate drinking water supplies, poor sanitation and none protection of water sources are especially highlighted as acute for most rural communities in developing countries that rely on raw water for drinking. Water quality monitoring and surveillance studies of different water sources elsewhere show that surface drinking water sources faecally contaminated because of exposure to unhygienic conditions15. Comparing the results of this study with a similar study conducted in the villages of Lesotho Highlands by Kravitz13, sanitation was found to be a serious problem compromising the quality of domestic water as well as contributing to outbreak of water-borne diseases. These findings demonstrate the need to come up with source water protection strategies and policies for rural communities where water treatment is not available. Public awareness regarding the significance of protecting water resources as well as monitoring its quality and human health effects are also important and recommended. An integrated approach incorporating policies, plans and activities that prevent or minimize release of pollutants into the sources of drinking water could be the starting point for Manonyanyane. Conclusion The majority of the water sources in this study were grossly polluted. The effects were attributed to poor source water protection, poor sanitation and low level of hygiene practices, and lack of monitoring and healthcare awareness. The potential risk of infection of water consumers calls for prompt intervention to mitigate the potential health impact of water-borne diseases in the community. A proper sanitary survey and implementation of water and sanitation projects in the community is recommended. Acknowledgments The author acknowledges and wishes to thank the National University of Lesotho for providing the funds to carry out this study. References
African Health Sciences Vol 11 No 3 September2011 The following images related to this document are available:Photo images[hs11095f2.jpg] [hs11095t1.jpg] [hs11095f4.jpg] [hs11095f1.jpg] [hs11095f3.jpg] |
| |||||||||