 |
| About Bioline | All Journals | Testimonials | Membership | News |
|
||||||
|
||||||
Journal of Applied Sciences & Environmental Management, Vol. 5, No. 1, June, 2001, pp. 33-41 Meiofauna Occurrence and Distribution in Different Substrate Types of Bonny Brackish Wetland of the Niger Delta *Chindah, AC; Braide, S A Institute of Pollution Studies, Rivers State University of Science and Technology,
P.M.B. 5080, Port Harcourt, Nigeria Code Number: ja01006 ABSTRACT The meiobenthic community of different sediment types was studied for 12 months between January and December 1997 in the Bnny estuarine environment. Five replicates core samples were collected from three sediment types (Muddy, Sandy and Chikoko sediments). Meiofaunal densities in order of magnitude are muddy (356 to 899 cm3), sandy (278 to 866 cm3) and chikoko (133 to 252 cm3). Most of the taxa groups had higher densities in dry season than in wet season with significant seasonal variations observed for Sandy sediment and Muddy sediment while Chikoko sediment densities did not show significant seasonal variation (t – test < 0.5). The meiofaunal densities for the different sediment types showed marked significant variation (ANOVA, p < 0.05). @ JASEM The increased concern on the rapid ecological changes in the natural environment has provided major challenges to the scientific community (Chindah 1998). The emerging empirical facts had shown the susceptibility and sensitivity of ecological assemblages which have been ignored especially the sediment substrate dwelling communities in brackish and other waters of The Niger Delta. Nevertheless, some studies have been undertaken on macrofauna in Bonny and other Niger delta environment (RPI 1985, IPS 1989, 1990 and 1992). In these studies, RPI (1985) have extensively provided information on the physicochemistry and Plankton, Onwuteaka (1992), Ombu (1987), Ekweozor (1989) and Ekweozor et al. (1989) on benthos, and Hart and Chindah (1998) on intertidal macrofauna while Chindah and Osuamkpe (1994), on fisheries of Bonny estuary. These studies provided insight on the composition and distribution of macro-invertebrates and the relationship between the physical and chemical environment on macrofaunal species on different sediment types within the wetland. However, information on meiofaunal community is virtually non existent despite the important role played by this group of organisms in the energetic, trophic organisation and their use as indicators of pollution and change detection in the environment (Gerlach 1971 and Sibert et. al 1977). It is for this reason that this study was conducted to investigate the meiofauna community structure of the 3 major sediment types of Bonny estuary and the possible community regulating mechanisms among them are compared. STUDY ARE: The study was conducted in a brackish wetland of Bonny estuarine (between 7 and 15ppt) at Elechi creek adjoining Eagle Island. The creek lies Southwest of Port Harcourt between longitude 40 35" - 40 5"N and 70 00'" - 70 53"E. The creek is protected from the strong wave actions prevalent in the main Bonny River Channel and the current flow is minimal (about 3m/s). The tidal amplitude is about 1.2 metres high. The detailed hydrology of the system is contained in NEDECO (1961). The intertidal flat consists of moderately sorted sand to silty clay with patches of hard “Chikoko” sediment types (Hart and Chindah 1998). The vegetation is predominantly mangrove dominated by species such as Rhizophora racemosa, R. mangle, Avicennia africana, Laguncularia racemosa, , Achrostichum aurerum and Paspalum varginaturm (Wilcox 1980). MATERIALS AND METHOD Samples were obtained from different location with different sediment types from Eagle Island. At each sediment type location, core samples (2.0cm diameter) were collected from surface layer of sediment (depth of 5cm) and placing them in plastic buckets. The animals were separated, by shaking the aliquot of sediment and decanting the supernatant through a 32m - mesh size net of bolting silk material. In the laboratory, single species were separated under a binocular microscope. The organisms were preserved in 5% formalin before individuals counted and values expressed as number of individual per cm3. All samples were collected from Chikoko, muddy and sandy sediments within the low tide mark environment. Simultaneously, samples were collected from the same source for textural properties and physicochemical characteristics. The samples for particle sizes were analysed following the method of AFNOR (1983). The Physico chemistry parameter such as temperature and pH were determined in-situ using a Cole Palmer Digisense meter (Cole palmer USA) and mercury–in-bulb thermometer to the nearest 0.01°C. Conductivity was measured with Lovibond conductivity metre (instrument model type Cm-21). The nutrient parameters were analysed as stated in APHA (1980). RESULTS Physicochemical Variables The textural properties showed that the different sediment type differed in their relative compositional structure. Sand particles were least in muddy sediment and highest in the sandy sediment. Silt particles, were considerably higher in Chikoko and Muddy sediment than the clay particles. However, the proportion of silt particles was relatively higher in Chikoko than in muddy sediment. In the contrary, muddy sediment recorded higher clay content than the former. Similarly, the physicochemical variables indicated that pH and temperature values had wider variation in the sandy sediment followed by muddy and Chikoko sediment. Conductivity and sulphate values apparently followed the same trend, with sandy sediment recording the highest value followed by muddy and chikoko sediments. A similarly this order of concentration values was also observed for nitrate-ntrogen. In the contrary, ammonia-nitrogen had its highest value recorded in Chikoko sediment followed by muddy and sandy sediment in that decreasing concentration. Sulphate mean values also showed concentrations in the increasing order of Sandy > Muddy > Chikoko sediment (Table 1). Table 1: The textural and physicochemical properties of the different sediment types
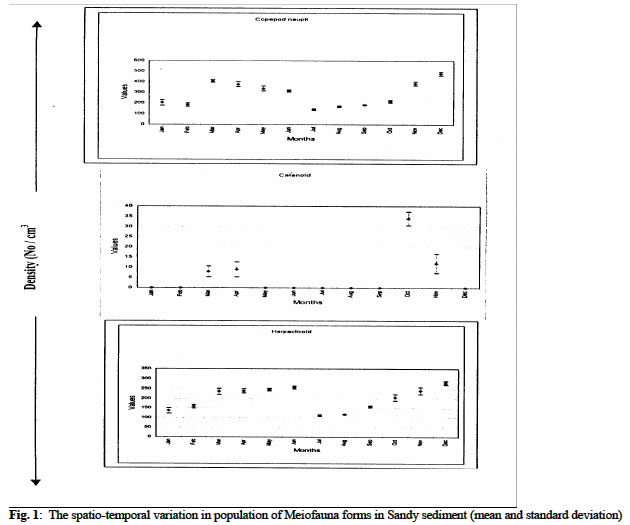
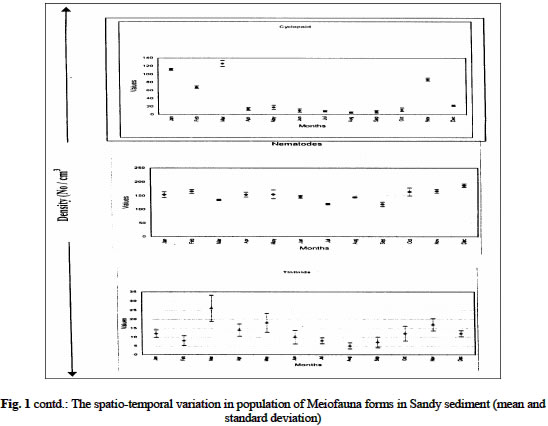
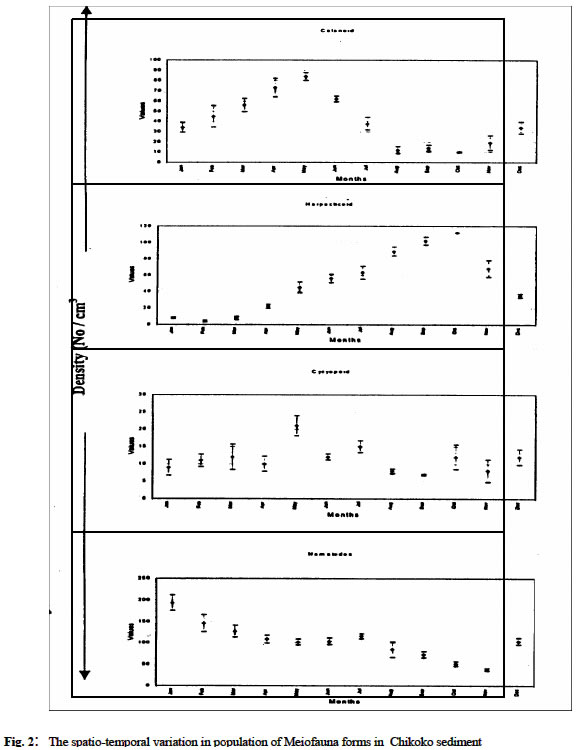
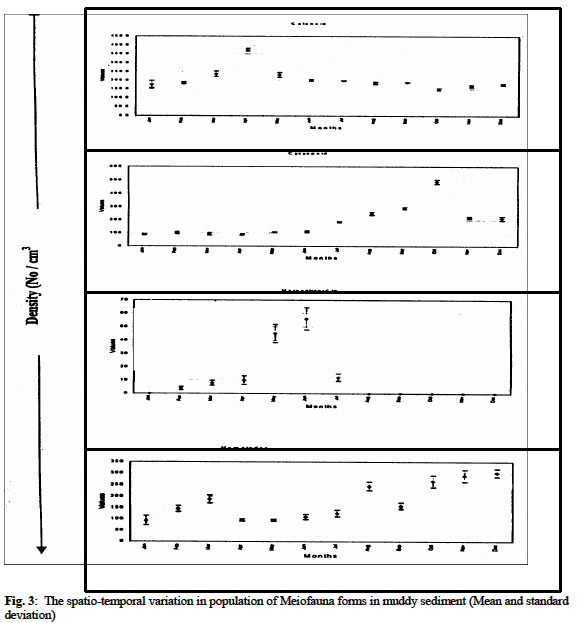
Biological Variables Sandy sediment: In the sandy sediment, cyclopoid copepods had low densities in the month of January (with 112 ± 2.1cm3) decreased by almost half in February (68 ± 2.8 cm3) before sudden increases to reach a maximum density of 126.0 ± 7.2 cm3 in March. The density then declined to a minimum value of 5.0 ± 1.8 cm3 in August. It increased again to another peak in November (87.0 ± 3.4 cm3) before a decline in December (22.1 ± 1.7 cm3) (figure 1 a, b). Harpacticoid copepods were several folds higher in density than that of Cyclopoid and other forms in the meiofauna assembage in the sandy sediment. The population steadily increased from January (137.0 ± 13.3 cm3) to June (256 ± 6.9cm3) then declined in July (112 ± 4.1cm3) before it increased to a maximum density again in December (279 ± 8.7 cm3). Calanoid copepod occurred occasionally in the sandy sediment. Generally, low densities were obtained when present in the community. Calanoid copepod emerged in the population in late dry season months of March (8 ± 2.7cm3) and April (9 ± 3.6 cm3). However, they disappeared suddenly and re-occurred in late rainy (October) with density of 34 ± 3.3 cm3; and in November (12 ± 4.7 cm3) Nematode population was consistently present at all periods maintaining a somewhat steady population throughout the period with maximum values in the dry season (December) period while minimum values (118 ± 8 cm3) occurred in wet season month (July). Tintinids had initial values of 13 ± 2.1cm3 in January, which decreased slightly a month after to a value of 8 ± 1.4 cm3, but increased to a maximum in March (27 ± 4.3 cm3). It then decreased somewhat consistently to lowest values in August (5 ± 3.2 cm3) before another gradual rise in December (17 ± 8 cm3). The nauplii forms recorded the maximum density in the meiofauna population with mean value of 203 ± 26.8 cm3 in January which showed slight decreases in February (182.4 ± 15.6 cm3) and increase in March (404 ± 12.3 cm3) before a steady declined to a minimum of 139.0 ± 7.3 cm3 in July. The values then increased consistently to 478.0 ± 16.9 cm3 in December. The mean abundance for sandy sediment varied from 278 ± 12.4 cm3 to 866 ± 44.6 cm3 with the densities showing two peak periods; in late dry season and late wet season. In addition, seasonal comparison using student t-test showed significant variation between seasons (Student t -test = 3.133, df =11, P < 0.05) Chikoko Sediment Cyclopoid copepods increased slightly from January (9.1 ± 2.3cm3) to a relatively high value in May (21± 2.3 cm3) before fluctuating without a definite pattern to December (12 ± 2.2 cm3) Fig. 2. Harpacticoid copepods showed almost uniform densities from January (8.1 ± 7.1cm3) through March (8.1 ± 6.2cm3) and then increased to a peak value of 112 ± 6.5 cm3 in October before decreases steadily to another minimum value of 35 ± 2.3 cm3 in December. Calanoid copepods, which had value of 34 ± 4.8 cm3 in January, increased steadily to a maximum value of 84 ± 4.8cm3 in May and declined to a low value of 10 ± 1.1cm3 in October. The values increases from November (19 ± 7.2 cm3) to December (34 ± 5.8 cm3). Nematod population in Chikoko sediment decreased through January (194 ± 18.3 cm3) to a minimum (102 ± 7.2 cm3) in value May. The population then maintained apparent uniform densities through July (116 ± 5.9 cm3) before a further decline to a minimum of 38 ± 3.2 cm3 in November. Thereafter, another cycle of increase was observed in December (104 ± 7.7 cm3) Fig. 2. The mean meiofauna for the entire period of study varied from 135 ± 35 cm3 to 258 ± 68 cm3. The seasonal comparison showed that there was no significant variation in densities between the seasons (Student t –test = 1.13, df = 11, P< 0.05). Mud Sediment Cyclopoid densities from January (86. ± 2.2 cm3) to April (88 ± 3.1 cm3) were apparently uniform before increasing in May (106 ± 2.8 cm3). It then reached a maximum in October (489 ± 5.1cm3) and then declined to 221 ± 4.9 cm3 in November and 212 ± 6.3 cm3 in December (Fig 3). Harpacticoid generally had low population all through the sampling period and were absent for over 58% of the sampling occasion. However, occurrence was first observed in February (4 ± 1.3 cm3). The density then increased minimally in March (8 ± 1.6 cm3) and continued subsequently through April (10 ± 3.1 cm3) to a maximum in June (56 ± 9.2 cm3) before a sharp decline in August (12 ± 2.8 cm3). Harpacticoid thereafter disappeared in the meiofauna population. Calanoid copepodite population was relatively stable with densities increasing steadily from 176 ± 18.7cm3in January to April (374 ±13.8 cm3). Thereafter, values declined steadily to a minimum in October (145 ± 7.4cm3) before slight increases were observed in November (162 ± 4.5cm3) through December (177± 3.2cm3) Fig 3. Nematod occurrence density seemed to increase gradually from January (94.0 ± 17.4cm3) through March (188 ± 10.3 cm3), and then declined slightly in April (95 ± 5.2cm3). The population density was maintained in May (95 ± 3.4cm3), before steady increases was observed in the population to reach maximum peak values in December (302 ± 18.9cm3). Tintinids were not observed in the mud environment as in the sandy sediment The mean abundance for the muddy ranged between 356 ± 98 cm3 and 899 ± 106 cm3 and seasonal comparison of means showed significant variation in the abundance distribution between the seasons (student t-test = 2.27, df = 11, t > 0.05). The analysis of variance conducted on the mean densities for each sediment types over the period with months as blocks to account for any seasonal variability and the sediment types as treatment showed significant differences in densities between the sediment types (ANOVA, p < 0.05). DISCUSSION The meiofauna for the different sediment types had density in the ordering pattern of muddy > sandy > chikoko sediment. The higher densities observed for sandy sediment are in part attributable to the high oxygen content associated with the particle sizes which are well-sorted (Coull 1988 and Boarden and Elhag 1984). Teal & Weiser (1966) suggested that marsh nematodes respond to increase 02 levels associated with roots. No strong evidence has been obtained from our study to suggest that copepod species differentially responds to this structural component. Our results however, followed the same trend observed by Palmer (1990), where higher densities were obtained for the sandy sediment than in other substrate types in Goose Creek at Virginia. Nevertheless, the values from our study were far less those that obtained in Goose Creek. This variation may be associated with the low productive nature and or decreased food availability which meiofauna depend chiefly on (Palmer 1980). Other factors known to affect meiofaunal abundance include pH, oxygen availability, and granulometry of the substrate (Gray, 1974 and Palmer, 1988.). The dynamics of the water body with respect to current velocity and re-suspension of meiofauna to the water column is argued to affect meiofauna population (Hicks 1992). For the different substrate types, total meiofunal abundance varied significantly throughout the study period with maximum occurring in dry season months. The distinct seasonal abundance pattern for the different sediment types is an indication of the community interactions that may be analogous with increased nutrient during the drier months (Chindah et al 1999). This seasonal pattern is in consonance with the works of RPI (1985), Chindah and Amadi (1993), Chindah (in press) for other physicochemical and biological parameters in the Niger Delta waters. Since temperature values over the seasons had variation less than 3oC,this implies that there are other factors other than temperature as reported in the tropical latitudes as one of the factors responsible for seasonal variation in meiofauna population (Bell 1979, Boucher 1980). Thus other factors such as water dilution, current velocity, and possible changes in nutrient quality may account for the seasonal variation of density with seasons. It is therefore reasonable to suggest that despite the nature of sediment, that the overlying water has measurable influence on the quality (status) of the sediment, which subsequently affects the fauna dwelling therein (RPI,1985). The strikingly dissimilar behavioural pattern of the same meiofauna group, in the different sediment type is an indication of the role of sediment on distribution and abundance of meiofauna. Also noteworthy, is the consistent higher population of some forms such as Cyclopoda, Harpactcoid, and Nematods in dry season than in wet season for the different sediment types (especially in sandy and muddy types), argue in favour of season as an important ecological factor regulating meiofauna population. This observation seemingly agrees with the findings of Bell (1979) where higher densities of meiofauna is reported occurred in summer than in winter at North Inlet estuary, Georgetown, South Carolina. In the contrary, Cyclopoid copepodites and Nematod in Chikoko sediment had higher densities in wet season period than in dry season. This variation in abundance suggests that the same taxa group may exhibit different quality traits depending on the sediment type. This variation in the abundance of the same taxa form as illustrated in Chikoko sediment against the pattern observed in other substrate types may probably be linked to imbued genetic factors. These factors, which may hinge primarily on physiological requirement of the medium, such as the ionic balance required for normal body functions. Consequently, immigration of these forms as a result of the high acidity, prevailing in Chikoko sediment during dry season may have been contributory to the low densities recorded during the season. This condition may have directly affected settlement and subsequent survival or escape from this niche by these forms. It is also possible that other density dependent factors such as intra and interspecific competition may reduce the number of individuals in Chikoko sediment in wet season. Hart and Chindah (1998) and Chindah et al.(1999) contended that epimacrofuna are more in the hard Chikoko sediment than in the other substrate types in Niger delta estuaries. In addition, behavioural response of the different forms especially with Copepod nauplii and Tintinids found only in the sandy sediment suggest that the muddy and Chikoko sediments are not conducive and perhaps stressful to the early developmental stages of the copepodites and the Tintinids. The reason for this may be sort in the high acidic nature of the muddy and Chikoko sediments with its characteristic high sulphite concentrations as reported in RPI (1985). Selective predation on copepods could also influence population structure and abundance in meiofauna community. Hydroids are reported to be predators to copepods (Miller 1961and Sibert et al 1977). Nevertheless, no hydroids were found within the sediment of Eagle Island where samples were collected. However, potential predators exist in Eagle Island estuarine environment as reported by Hart and Chindah (1998). Teal (1962) reported that Uca pugnax constantly reworks the marsh sediment surface, and that as it scrapes the sediment surface, nematodes are ingested. In addition, Bell and Coull (1978) have shown that P. pugio can influence meiofaunal densities in artificially contained marshes. Given the densities of grazers in Chikoko sediment in Eagle Island (Hart and Chindah 1998), predation pressure is potentially great. This may be another evidence that is responsible for the lower meiofauna density recorded in the Chikoko sediment numerical dominance. However, despite the taxonomic limitation of identifying the organisms to species level which would have shed more light in this study it is concluded that different sediment types in Bonny estuary vary considerably in their meiofauna community composition and season remarkably influences the meiofauna population in all the sediment types. Acknowledgement We wish to thank the Ag. Director of Institute of Pollution studies for his supported and the laboratory staff particularly Mr. Hanson Uyi and Nathan Nario for the assistance during the field and laboratory studies. REFERENCES
Copyright 2001 - Journal of Applied Sciences & Environmental Management The following images related to this document are available:Photo images[ja01006f3.jpg] [ja01006f2.jpg] [ja01006f1b.jpg] [ja01006f1a.jpg] | ||||||||||||||||||||||||||||||||||||||||||||||
| |||||||||
