 |
| About Bioline | All Journals | Testimonials | Membership | News |
|
||||||
|
||||||
Journal of Applied Sciences & Environmental Management, Vol. 5, No. 1, June, 2001, pp. 57-61 Effect of Drilling Fluid Additives on the Niger Delta Environment: -A Case Study of the Soku Oil Fields KINIGOMA, BS Department Of Petroleum Engineering, University Of Port Harcourt, P. M. B. 5323, Port Harcourt, Nigeria Code Number: ja01009 ABSTRACT The effect of drilling fluid additives on the Soku oil fields environment has been examined. Soil and reserve pits in various locations were assessed for some physico-chemical characteristics and heavy metal content using standard methods for water and wastewater analysis. Plant growth and other biomass were also assessed. The result showed that the levels of most physiochemical characteristics are generally within the limits of guidelines by regulatory authorities. However, trace metal levels are generally below toxic levels, except Fe, Ca and Mg, which were higher than recommended values. These high values of Fe, Ca and Mg (17.70-220.2; 11.03-296.80; and 12.62-75.71 ppm) respectively are characteristic of the Niger Delta Swamp soils. Also a poor plant growth was observed in the immediate vicinity of location of drilling operations, an indication of the toxic effect of drilling fluids on the environment. @ JASEM During the drilling operation of oil and gas, drilling fluid and cuttings and other waste materials generated in the process must be properly disposed. The drilling fluid, which consists of diverse chemical components, is used in the drilling operation in order to achieve specific purpose at a given site. It is pumped and recirculated through the borehole to serve several drilling operations purposes. The drill cuttings from the borehole are inert fragments of rocks and fine solids penetrated while drilling a hole and brought to the surface by drilling fluid. Considerable concern has been expressed in recent years about the effect of drilling fluids and its constituents on the environment (Neff 1987). Bentonite and barite are practically inert toxicologically, although in some cases, they may cause physical damage to organisms. Chromium, which is also found in many drilling fluids, is present mostly in tetravalent form and is significantly less toxic than the hexavalent form. Impurities in bentonite and barite can contain metals not readily mobilized in water, so they have limited bioavailability to marine organisms. The impacts of drilling fluid disposal on offshore waters are primarily physical. It has been established that a discharge of bentonite and barite dumped on the ground, will prevent plant growth (Murphy and Kehe (1984)) until other natural processes develop a new topsoil, but are not themselves toxic. In water, these materials may disperse or sink and may locally kill benthic organisms by burying them. In fresh water, bentonite clays form a viscous gel, which kills fish by preventing or inhibiting their action if they are not caught or trapped in discharge before dilution through dispersion (Moseley 1983). MATERIALS AND METHODS Used drilling fluid samples were collected from well DCOQ –2 (SOKU–34) whose completion activities ended in January 1998 and well DCOQ –1 (SOKU–39) whose completion activities ended in July 1998. The samples were collected to serve as a comparison of the two wells. Three soil samples were taken along measured grids 18 meters apart consecutively away from the reserve pit and subsequently another three such samples from the end grid (100 meters away from reserve pit) and also 18 meter grid spacing backward. The soil samples were scooped from a depth of 6cm with the soil temperature simultaneously recorded with a thermometer in the range of 10°C – 110°C. Air temperatures were also recorded on each grid before the sample was taken. In all six measured grids were involved. The following sample groups were investigated in this study: a) Soil and discharge pit salinity b) Soil and moisture content c) Soil and discharge pit pH d) Soil and discharge pit alkalinity e) Soil and discharge pit metal content. Soil moisture content: 5gm of the sample was weighed and put in 25ml beaker and heated in the oven for 8 hours between 105-110°C. The sample was then transferred into a desiccator and allowed to cool to room temperature, after which it is reweighed.
m1 = wt of moist soil Hydrogen ion concentration (pH): The pH meter was standardized by use of the electrodes against two reference buffer solutions. 20gm of samples were weighed and dissolved in 20ml of water. The electrodes were then dipped in the solution and the pH values read off. For the reserve pit samples, the electrodes were dipped into the samples directly and reading taken. Total alkalinity: A suitable amount of sample (10-100ml) solution was measured out into a conical flask and to it was added 3-4 drops of phenolphthalein indicator and triturated against 0.0lM HCl with string to end point. To these solution was added a few drops of methyl orange and triturated against 0.0lM HCl end point.
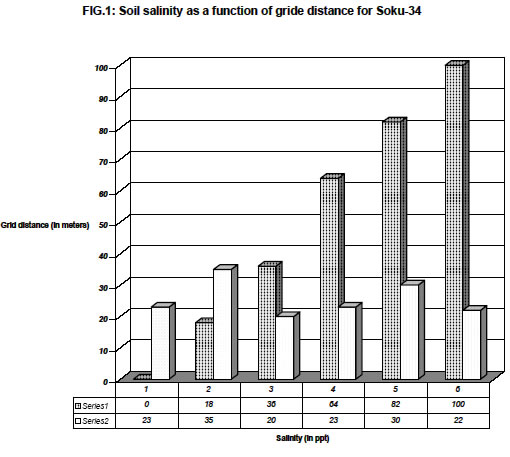
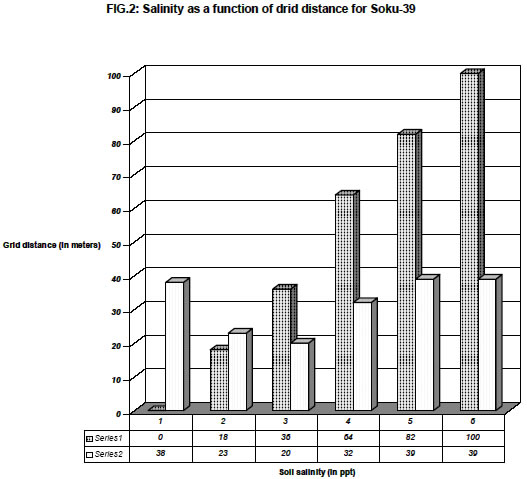
Where TV = total volume (ml) Salinity: The chloride ion concentration of the samples were determined by the AAS. Metal Analysis: 1gm of the soil sample at each grid was weighed and digested with 10ml of Conc. HNO3. The solution was allowed to digest by putting it into a heating mantle and left until it turned white. The solution was then filtered into a graduated beaker and made up to 100ml with distilled water. This solution and the reserve pit samples were then used to run the AAS test to determine the metal content and the chloride ion concentration in the samples. RESULTS AND DISCUSSIONFigures 1 and 2 show a plot of salinity in parts per thousand (ppt) against grid distance in meters from Soku – 34 and 39 respectively. From figure 1 it can be seen that the salinity is highest at about 18 meters away from the reserve pit and lowest at about 36 meters away. Fig 2 shows a general high salinity value around the discharge pit. This value drops and rises until it normalizes at about 100 meters away from the reserve pit. This trend can be traced to the discharge spills common around the drilling sites. SUMMARY OUTPUT
Results of the soil moisture content analysis for DCOQ-1 (SOKU-39) and DCOQ-2 (SOKU-34) are given in Tables 1 and 2 respectively. It would be expected that areas with low temperature should have high moisture content. This is observed for SOKU-34. However, this is not true for SOKU-39 where it is observed that the soil moisture content gets higher away from the discharge pit. Tables 3 and 4 give the soil pH values for DCOQ-2 and DCOQ-1 respectively at different grid distances from reserve pit. Table 5 then shows the pH analysis for the two reserve pits. Table 4 shows an appreciable pH variation ranging from an acidic 5.9 value around the discharge pit to a basic value of 7.6, 100 meters away. This variation becomes very significant when considering the existence of microorganisms. The high alkalinity level inhibits the activity of microorganisms. A similar trend is also observed for SOKU-39 (Table 4). Table 6 shows a comparison between soil metal content and reserve pit reduction in metal content. In can be seen that virtually all the samples showed a reduction in metal content as the distance increase from the reserve pit. The high value of alkali metal such as (Na) and the alkali earth metals (Mg and Ca) conforms to the high salinity and alkalinity values obtained. TABLE 1: Soil moisture content analysis for dcoq-(soku-39)
TABLE 2: Soil moisture contents analysis for dcoq-2 (soku-34)
TABLE 3: Soil pH values for dco 0-2 (soku-34)
TABLE 4: Soil pH values for dcoq-1 (soku-39)
TABLE 5.pH Values for the 2 reserve pits analysis
TABLE 6: Comparison of discharge pit metal constituents with soil constituents (ppm).
The high metal content of the soil samples may have resulted due to seepage from the discharge pits into the soil causing a reduction in the values of the discharge pits metal content. Table 6 also shows that the level of metal from the AAS test are relatively low and within FEFA safety limits. Concentration of Fe is the only exception in showing very high values. There are considerable amount of heavy metals in the soil around the reserve pits. The source is traceable to the reserve pits which confirms the work of Moseley (1983) which has shown the migrating capacity of heavy metals from reserve pits either by seepage or during over floods. The soil shows considerable pH and alkalinity variation over small distance apart. The pH values fall short in meeting the recommended values of between 6 and 9 set by FEPA for land location. Some Chemical components present in additives of drilling fluid are noted to have negative effects on the environment. The various parameters investigated are to a great extent responsible to the poor nature of plant and soil microbial life around the vicinity of drilling sites. Field observations reveal that the soil around drilling sites after drilling operations do not adequately support plant life in such areas (Miller et al 1974). It has also been established that a discharge of bentonite and barite on land will prevent plant growth until other natural processes develop new topsoil, which are not themselves toxic. In water these materials disperse or sink and may become locally bottom-living creatures by burying them. In fresh water, bentonite clays form a viscous gel, which kills fish by inhibiting their gill action. Acknowledgement: The author is grateful to the Management of NNPC, Port Harcourt for allowing the use of their laboratory. REFERENCES
Copyright 2001 - Journal of Applied Sciences & Environmental Management The following images related to this document are available:Photo images[ja01009f2.jpg] [ja01009f1.jpg] | |||||||||||||||||||||||||||||||||||||||||||||||||||||||||||||||||||||||||||||||||||||||||||||||||||||||||||||||||||||||||||||||||||||||||||||||||||||||||||||||||||||||||||||||||||||||||||||||||||||||||||||||||||||||||||||||||||||||||||||||||||||||||||||||||||||||||||||||||||||||||||||||||||||||||||||||||||||||||||||||||||||||||||||||||||||||||||||||||||||||||||||||||||||||||||||
| |||||||||
