 |
| About Bioline | All Journals | Testimonials | Membership | News |
|
||||||
|
||||||
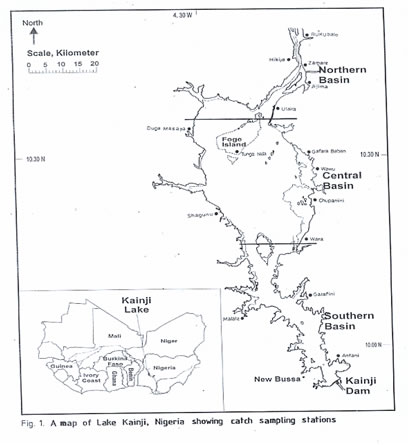
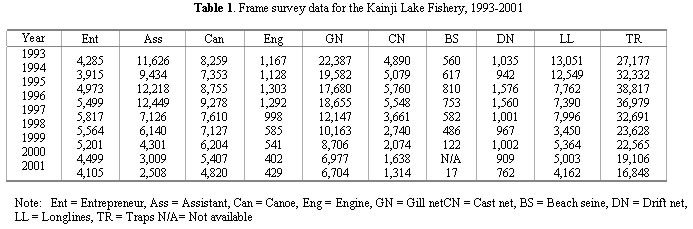
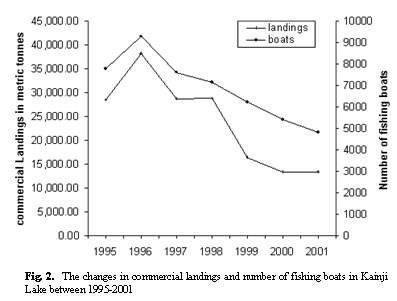
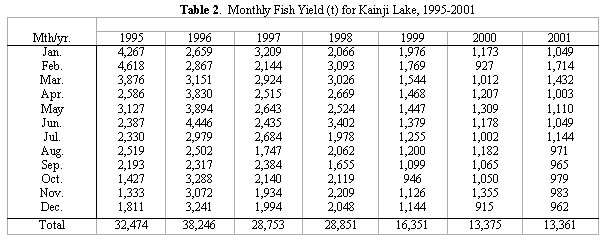
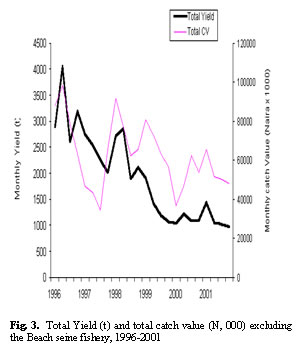
Journal of Applied Sciences & Environmental Management, Vol. 7, No. 2, Dec, 2003, pp. 9-13 Evaluation of Fisheries Catch Trend on Lake Kainji, in Nigeria, 1995-2001 ABIODUN, J A National Institute for Freshwater Fisheries Research (NIFFR),P. M. B 6006, New Bussa, Niger State, Nigeria Code Number: ja03013 ABSTRACT The highlights of the analysis of fisheries data collected between 1995 and 2001 for the purpose of monitoring and evaluating the Kainji Lake fishery in Nigeria was presented. There was a downward trend in the total number of Fishermen, gear recorded for all fishing methods and annual fish yield between 1995 and 2001. The annual fish yield reached 32,474 metric tones in 1995 and declined to 13,361 metric tones in 2001. For an optimum catch, only 1,905 Fishermen ought to have been engaged in full time fishing activities if, Kainji Lake fisheries is to be managed on a sustainable basis. However, the results further revealed that a surplus of over 2,200 Fishermen were still recorded actively fishing in 2001 despite the interjected management measures of licensing and banning the use of beach seine on the Lake. This has led to a decline in daily catches of Fishermen, which invariably caused a reduction in the total annual fish yield by 58% during the seven years sampling period. @JASEM Reports of declining fishermen's catches prompted the start of a 9-year technical cooperation project "The Nigerian-German (GTZ) Kainji Lake Fisheries Promotion Project" in 1993. The project overall goal was that the standard of living of fishing communities around Lake Kainji is improved through the sustainable management of the fisheries and other aquatic resources of Lake Kainji. This was to be achieved through the implementation of a community based fisheries management plan. But, fisheries data from the lake only existed from 1969 to 1978. After this period, regular data collection ceased. There was therefore, a lack of current information, which any one could draw upon to formulate an appropriate management plan for the lake fishery. This problem was addressed by initiating fisheries surveys designed both for the development of the fisheries management plan and for long term evaluation and monitoring of the fisheries. Between 1995 and 2001 these activities had generated a large volume of data. The objective of this paper is to present the highlights of the results of data obtained from 1995 to 2001 frame and catches assessment surveys in order to determine the fisheries catch trend of the Lake. MATERIALS AND METHODS Study Area: The study area is Lake Kainji (Fig 1) showing the 15 landing sites where monthly catch and effort samplings took place. Lake Kainji is situated between latitudes 9o 50' - 10o 57' North and longitudes 4o 25' - 4o 45' East. The lake was impounded on 2nd August 1968 and it is 136.8 km in length and 24.1 km maximum width. Its surface area has been variously quoted as approximately 1,300 km2 (Vanden Bossche, J.P. & Bermacsek, G.M, 1969). At full volume, the water is at the altitude 142 m and at low volume the water is at the 133 m level. The distance from Lagos is about 1014.3 km by river from the sea along River Niger and about 563.5 km by road. Niger and Kebbi States comprising 5 Local Government Areas border the lake. Fishing Localities: Two types of fishing locality were identified around Lake Kainji area. These include permanent fishing villages and temporary fishing camps. The number of permanent fishing villages rose from 228 in 1995 to 276 in 2001, an increase of 21% while the temporary fishing camps also increased by 46% from 26 in 1995 to 38 in 2001. In general, the number of fishing localities increased steadily from 273 in 1995 to 309 in 1999. However, in 2001, the number stabilized with a total of 314 fishing localities recorded. The highest number of fishing localities occurred at the eastern side of the lake, especially in the southern and northern basins where conditions are more congenial for settlement and farming and the area is the most productive of the lake for fishing (du Feu and Abiodun 1998). Fisherfolk: A total of 4,973 fishermen with 12,218 fishing assistants were counted in 1995 during the frame survey. The number rose in 1995 and 1996 until it reached 5,817 fishermen and reduced to 7,126 fishing assistants in 1997. There existed a progressive decline from 5,564 fishermen and 6,140 fishing assistants in 1998 to 4,499 and 3,009 fishermen and fishing assistants respectively in 2000. There was a decrease by 17% in the number of fishermen and 79% fishing assistants over the seven-year sampling period, while the number in 2001 showed a further reduction since the peak in 1997. A total of 4,105 fishermen and 2,508 fishing assistants were recorded during the 2001 frame survey (Table 1). The decline is partly due to the exodus of fishermen from the fishery due to falling ownership of gears because of high cost of gear materials and the ban on fishing with beach seines (in 2000 about 6.4% of fishermen stopped fishing, whilst 7% migrated with other gears), as well as the introduction of a systematic licensing program. This made some fishermen not to disclose themselves during the frame to evade paying for the license. There has been a large reduction in the number of assistants due to the lower ownership of fishing gears (effectively making them redundant), the decline in the seine fishery that engaged in large number of assistants and more especially the effect of including them in licensing. Although, for an optimum catch, 2 fishermen/km2 was recommended for Lake Kainji (Henderson and Welcome, 1974) and therefore only about 1,905 fishermen ought to have been engaged in full-time fishing activities if Kainji Lake is properly managed. A surplus of over 2,200 fishermen were therefore still recorded in 2001 in spite of the implementation of management measures of licensing and banning of beach seine. It is expected that as the management measures get better implemented, this surplus will reduce if not phased out to the level recommended by Henderson and Welcome. fig 2 shows the changes in commercial landings and number of fishing boats in Kainji Lake between 1995-2001. There was a sharp increase between 1995 and 1996. The peak landing was in 1996 and the decline has continued from then till 2001. Fishing Canoes and Engines: The total number of fishing canoes decreased from 8,755 in 1995 to 4,820 in 2001. This showed a decrease of 44%. Like the localities and fishermen, the highest concentration occurred at the eastern side of the central lake basin. The average number of canoes per fisherman has consistently decreased from 1.9 to 1.2 during the past seven years and, like the fishing assistants, is as a result of the declining numbers of gears owned by fishermen. There was a decrease in the number of transport canoes. The number of outboard engines has also declined drastically to less than half the level recoded in 1995. This is evident from Table 1, which shows that only 7% of the canoes used for fishing were motorized. The decline in transport canoes and outboard engines was due to high cost of these materials and low income resulted from declined daily catch. Fishing Gears: During the 1995 frame survey, a total of 17,680-gill nets, 1,576 drift nets, 5,760 cast nets, 7,762 longlines and 38,817 fishing traps were recorded. But during the 2001 frame survey, a total of 6, 704 gill nets, 762 drift nets, 1,314 cast nets, 4,167 longlines and 16,848 traps were recorded (Table 1). The percentage reductions in that order were: 62%, 51%, 77%, 46% and 56%. The consequences of the downward trend in the total number of gears recorded for all fishing methods from 1995 till 2001 are among others, the following: One of such consequences is that each fisherman owns fewer gears than before. The reduction is critical when calculating yield estimates from the catch assessment survey, since lower gear ownership will result in lower yield estimates. For sustainable exploitation, however, the reduction in the number of fishing gears and ultimately fishing effort is welcome given the present level of growth over fishing of some commercially important species. The lower number in all the fishing gear types is due to decline in daily catch and the high price of fishing gears causing the fisherfolk to purchase less of the fishing materials in spite of gain accruing from the higher fish price. Gears such as gill nets and longlines are increasingly being stolen as claimed by fisherfolk, when set on the lake and fishermen are discouraged from investing in them. The beach seine fishery is the most controversial of all the fishing methods on Lake Kainji and has an associated high by-catch of juvenile and undersized fish that comprised of 25% of the total seine yield. Despite the ban placed on the gear in 1999, the rate at which the gear came up in 2001 on the lake was alarming. This probably meant not enough enforcement; policing and strict penalty was placed on the ban. Perhaps buyers of undersized fish caught by the gear should also be prosecuted. By so doing, the fisherfolk would stop fishing undersized fish once they know there would be no market for it. Fishing Net Characteristics: The mean mesh sizes recorded every month during the catch assessment sampling remained stable. The average mesh size of 50 mm for drift nets was lower than the 63 mm minimum allowable size, whilst it was above for gill nets and cast nets. According to Niger and Kebbi State Fisheries Edict 1997, minimum allowable mesh sizes are; gill net: 75 mm, drift net: 63 mm, cast net: 50 mm. All mesh sizes measured as stretched mesh size in mm. According to Niger and Kebbi State Fisheries Edict 1997, minimum allowable mesh sizes are; gill net: 75 mm, drift net: 63 mm, cast net: 50 mm. All mesh sizes measured as stretched mesh size in mm. A recent development was that fishermen changed from multi-ply 52 and 63 mm gill nets to nylon monofilament because it is highly effective in catching juveniles especially for Citharinus citharus and Tilapia species. This may constitute another management problem soon. However, evidence abound that some fisherfolk were using increased mesh sizes greater than 125 mm. This is an encouraging development on the efforts taken towards sustainable management of fisheries of the Lake. Annual Fish Yield: The estimated total yield for the lake fishery was 13,361 mt. during 2001. This has not shown any significant reduction from 13,375 mt. (P < 0.05) recorded in 2000 but showed a reduction of 65% since the peak in 1996 (Table 2). The total yield was more likely higher since the yields from the seine nets were not taken into consideration in 2001 because of the ban on it. The reason for this high decline from 1996 can be attributed mainly to the absence of the yield from beach seine fishery, which targets the small pelagic clupeids and contributed 53% to the 1996 yield (du Feu and Abiodun, 1998). figure 3 shows the trend in the monthly total yield and catch value excluding the yield from beach seine fishery from 1996 to 2001. There was a sharp decrease between 1996 and 1997. The peak was in 1996 and the decline has continued from then till 2001. Annual Yield By Species: The annual yield of 13 of the sampled species groups declined by more than 40% from 1998-2001. Small sized species such as Schilbeids, Auchenoglanis, Chrysichthys and small Synodontis showed the largest reduction. These were all species commonly caught by the trap fishery and their decline was probably due to the lower effort. The top three commercial species Citharinidae (notably Citharinus citharus), tilapiines (mainly Sarotherdon galilaeus) and Synodontis membranaceus have all declined by about one third since 1998. The only species that increased were Lates niloticus with others from families like Mormyridae, Gymnarchidae, Tetradontidae, Polypteridae , Malapteruridae. This increased to about 38, 246 metric tones in 1996. The fish landings declined to 28, 753 metric tones in 1997 and 13,361 metric tones in 2001. The decline followed a steady downward trend. The decline was initially due to the effect of the high yielding, but destructive, beach seine fishery and over-fishing of fish stocks by effort levels that were 40% higher than that required for the maximum sustainable yield. But, the implementation of the ban on beach seines using co-management strategies in early 1999 resulted in a much-reduced fishing pressure from the beach seine fishery. This has led to an increase in mean size of those fish species previously caught as by-catch by the beach seines. In order to transform the increased fish abundance into higher catches, however, it is vital that the ban placed on beach seines be sustained. The upsurge of beach seines fishing would affect the over all catch of the majority of fisherfolk using other fishing methods. It is also important to ban the use of small mesh size nets to crop juveniles as this would continue to have adverse effects on fish population, recruitment and yield. Finally, the continuous reduction in the number of fisherfolk and consequent reduction in total effort is an appropriate management measure if fish production and total biomass is to be sustained. CONCLUSION: Previous reports (Bazigos, 1972) revealed that soon after the impoundment of the lake, annual commercial landing of fish reached about 28,639 metric tones between 1969 and 1970. By 1978, the commercial landing dropped drastically to about 4,500 metric tones (Ekwemalor, 1978). Between 1978 and 1995 a gap in knowledge was created with respect to the total annual fish landings from the Lake. In Table 2, the annual fish landing was established at 32, 474 metric tones in 1995. ACKNOWLEDGEMENT: This work was carried out within the framework of Nigerian-German Kainji Lake Fisheries Promotion Project. I am deeply indebted to the Project for allowing the data to be published. I also wish to acknowledge the dedication and efforts of Yahaya Nda-Isa, Mustapha Dole, Bala Birnikebbi, Francis Apeloko and all the fisheries extension workers in Niger and Kebbi States for the collection and processing of the data. REFERENCES
The following images related to this document are available:Photo images[ja03013t1.jpg] [ja03013t2.jpg] [ja03013f3.jpg] [ja03013f1.jpg] [ja03013f2.jpg] |
| |||||||||
