 |
| About Bioline | All Journals | Testimonials | Membership | News |
|
||||||
|
||||||
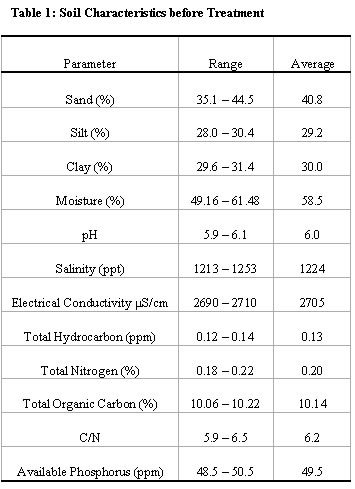
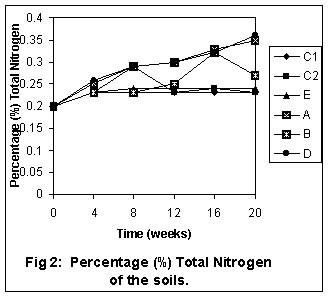
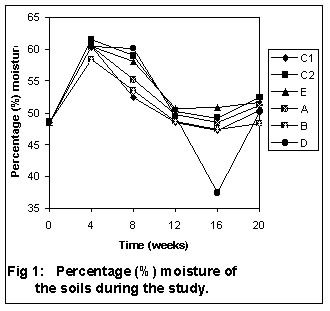
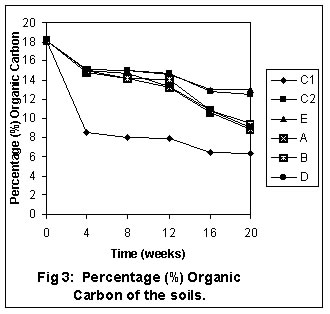
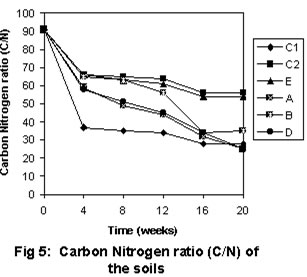
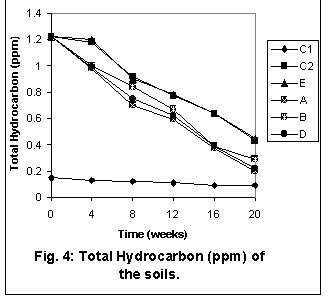
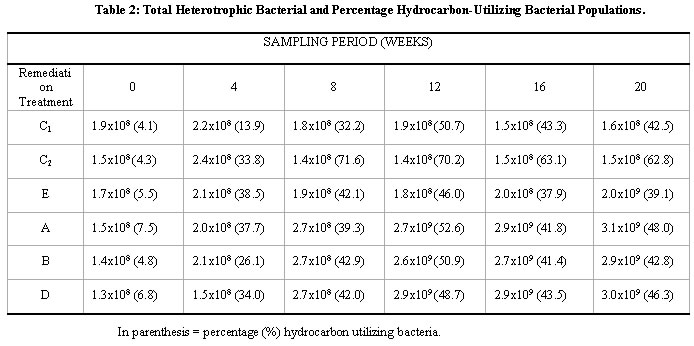
Journal of Applied Sciences & Environmental Management, Vol. 7, No. 2, Dec, 2003, pp. 23-29 Bioremediation of a Crude Oil Polluted Tropical Mangrove Environment * ODOKUMA, L O; DICKSON, A A Department of Microbiology, University of Port Harcourt , PMB 5323, Port Harcourt , Nigeria * Corresponding author Code Number: ja03015 ABSTRACT: A combination of bioaugumentation with hydrocarbon utilizing indigenous bacteria, biostimulation with agricultural fertilizer (NPK 15:15:15) and tilling were employed as remedial options for 20 weeks in a crude oil polluted tidal plain dominated by mangrove ( Rhizophora, Laguncularia and Avicenia) vegetation. Soil moisture rose from 48.5% prior to remediation to 60.48% four weeks after treatment and dropped to 48.22% after remediation. Other physicochemical parameters of soil such as total hydrocarbon (1.22 to 0.20ppm), organic carbon (18.14 to 8.85%) and carbon/nitrogen ratio (91 to 25) dropped during the remediation period. Total Nitrogen (0.20 to 0.36%) increased during the remediation period. The total heterotrophic bacteria (THB) count increased in treatment options A (biostimulation, bioaugumentation and tilling), B (bioaugumentation and tilling) and D (biostimulation and tilling). The THB count of option C1 (double control), C2 (control) and E (tilling alone) were fairly constant throughout the remediation period. There was however an increase in the hydrocarbon utilizing bacterial counts for all treatment options throughout the remediation period. This increase was greater in option A, B and D. Option A (84%) and option D (82%) recorded higher levels of hydrocarbon loss (P> 0.01) than the other four options B (76%), C1 (36%), C2 (65%) and E (63%). Option B also recorded a significantly higher level of hydrocarbon loss (P>0.01) than C1 , C2 and E while that of C1 was significantly lower than C2 and E. The addition of limiting nutrients (biostimulation) with tilling (option D) is a preferred remedial option for a crude oil polluted soil in a tropical mangrove environment @ JASEM In the Niger Delta, increasing petroleum exploration has led to wide spread contamination of most of its creeks, swamps, soils and groundwater (Okpokwasili and Odokuma, 1990, Odokuma and Ibor, 2002). These contaminants present several environmental problems (Vandermeulen and Lee, 1986). They may affect physiological processes, population and behavioral profile of organisms (Teh and Lee, 1974). Studies have shown that the environmental transformations of the organic chemicals in terrestrial and aquatic systems are induced by physical, chemical and microbial factors within the system (Plimmer, 1978). Environmental factors such as increased salinity and water logging, slow down considerably the recovery rates of oil contaminated salt water ecosystems. Biodegradation rates have been observed to decrease with an increase in salinity (Okpokwasili and Odokuma, 1990). Mangroves possess air pores also called lenticels situated in aerial roots, which at low tide permit diffusion of oxygen. Crude oil from a spill could blanket the pores directly or float freely in water during high tide until it encounters a root and sticks to it. Microbial degradation (biodegradation) is a complete process facilitated by appropriate ambient and seasonal conditions, the presence of the optimum concentration of the right type of nutrients and the composition of the indigenous microbial community (Leahy and Colwell, 1990). Bioremediation involves the use of microorganisms to remove pollutants (Lee et. al. , 1993). Bioremediation of crude oil polluted soil is becoming an increasingly important remedial option. Bioremediation has a great potential for destroying environmental pollutants (Song et. al ., 1990). The use of inexpensive equipment, environmentally friendly nature and simplicity of the process are some of its advantages over other remedial alternatives such as physical and chemical treatments. Biostimulation and bioaugumentation either in-situ or ex-situ are various modifications of bioremediation (Lee et al ., 1993). Bioaugumentation involves the addition of external (indigenous or exogenous) microbial populations to the waste. Biostimulation involves the addition of appropriate microbial nutrients to a waste stream (Lee et. al., 1993). The objective is to stimulate the indigenous microbial flora of the waste to bring about its degradation. The biostimulation (nutrient enhancement of microbial organic waste break down) option, is in it's infancy in Nigeria . The objective of this study was to evaluate a combination of options bioaugumentation with indigenous hydrocarbon utilizing bacteria, biostimulation, with an agricultural fertilizer (NPK 15:15:15 ) and tilling for the remediation of a crude oil polluted mangrove swamp. MATERIALS AND METHODS Study Area: The area is located along the New Calabar River in Rivers State in the Niger Delta of Nigeria. The area is a tidal plain, dominated by mangrove swamp and drained by a number of creeklets and major watercourses. The rivers and creeks are under tidal influence and the main ecological species are brackish water forms. The area is composed of organic soils at various stages of decomposition being inundated regularly by tidal floodwater. The soil is moist and saline. The soil is characterized by underlying clay of about 15cm to 20cm thick, which serves as a natural barrier to pollutant seepage into the subsurface. The predominant vegetal cover within the area is mangrove. Several genera have been recorded Rhizophora, Avicenia and Laguncularia. The mangrove, are of several varieties, but one common feature is that most of the species have developed a variety of prop and aerial root systems. Table 1 shows the soil characteristics before contamination with crude oil. Study Plots And Treatments: Six treatment options – C 1 , C 2 , E, A, B and D were applied and were duplicated. Detail description of the treatment options are given below. The treatment options duplicated were pooled together during statistical analyses. Each treatment cell was 2m x 2m. The treatment options were as follows: C 1 -u ncontaminated soil from a different location (Double control) without remediation treatment, C 2 - contaminated soil from the same location without remediation treatment (control), E- contaminated soil that was tilled only, A -a ddition of indigenous hydrocarbon utilizing bacteria, fertilizer and tilling of soil from the same location, B- addition of indigenous hydrocarbon-utilizing bacteria and tilling of soil from the same location and D-f ertilizer application and tilling of soil from the same location. Soil Contamination: Twenty litres of Bonny light crude oil was poured on each treatment cell (including controls). The objective was to simulate condition of a major spill. Soil sampling started one week after soil contamination. This period was taken as week 0 (one week after soil contamination). Soil Sampling: Composite soil samples to a depth of 0-30cm (treatment options such as tilling and fertilizer application were limited to this depth) were collected during each sampling for microbiological and physicochemical analyses. In each treatment cell at least ten random spots were augured, bulked together and put in well labeled polyethylene bags and immediately transferred to the laboratory for analysis. Source Of Materials: All nutrients formulations (fertilizers) were obtained from the National Fertilizer Company of Nigeria (NAFCON) Limited, Port Harcourt , Nigeria . Ply wood were obtained from Timber market Port Harcourt , Nigeria . Bonny Light crude oil was obtained from the Nigerian National Petroleum Corporation (N.N.P.C) Port Harcourt , Nigeria . Treatment Options Tilling : Cells (treatment options) were tilled daily with spades to provide maximum aeration and adequate mixing of nutrients and microbes Fertilizer Application : The agricultural fertilizer NPK 15:15:15 was broadcast (spread evenly over the soil surface) to the relevant cells (Komolafe et al., 1983). These fertilizers were then worked into 30cm depth at each cell. About 200kg/ha of the fertilizer was applied once in every 2 weeks for 16 weeks. During this period a total of 6 tons of fertilizer per hectare was applied to the cells giving about 240 kg each of nitrogen, phosphorus and potassium per hectare to each treatment cell. Isolation and Enumeration of Total Heterotrophic and Indigenous Hydrocarbon Utilizing Bacteria : The total heterotrophic bacteria count of soil samples was performed by inoculating 0.1ml of appropriate dilution (dilution that produce colony counts of between 30-300 colonies) of soil suspension in deionized water (formed from 1g of soil in 1L of deionized water) on nutrient agar plates using the spread plate technique (Odokuma and Okpokwasili, 1993; Odokuma and Ibor, 2002). Bacteria colonies were enumerated after 48h of incubation. The total hydrocarbon utilizing bacterial counts of soil samples was performed in triplicate on modified mineral salts agar of Mills et al . (1978) using the spread plate technique. The medium contained (in g L -1 ): NaCl, 10.0g; MgSO4 .7H2 O, 0.42g; KCL, 0.29g; KH2PO4 , 0.83g; NaHPO4 , 1.25g; NaNO3 , 0.42g, agar 15.0g deionized water 1L ; pH, 7.2. The vapour phase transfer method (Amanchukwu et al ., 1989) was used both for estimating the population of hydrocarbon utilizing microbes and obtaining isolates of these organisms by inoculating 0.1ml of corresponding dilution of soil suspension as in total heterotrophic count estimation. Enumeration was done after incubation of plates at room temperature (28 ± 2oC) for 7 days (Odokuma and Okpokwasili 1993, Odokuma and Ibor 2002) for each day of sampling (0, 4, 8, 12, 16 and 20 weeks). Pure stock cultures of hydrocarbon-utilizing bacterial isolates were obtained identified and characterized using the criteria in Krieg and Holt (1994). Nutrient agar slants of all the isolates obtained were prepared. The hydrocarbon–utilizing population consisted mainly of Bacillus sp, Pseudomonas sp, Aeromonas sp, Micrococcus sp, Proteus sp and Arthrobacter sp . Scaling Up of Hydrocarbon-Utilizing Microorganism for inoculation into Treatment Cells : The right species and numbers of microorganism must be present before any bioremediation programme could be effective. Hydrocarbon–utilizing bacteria population of study area was generally very low before experimentation. So it became necessary to increase their population. The process of scaling up was used. Nine milliliters of sterile normal saline (0.85% NaCI) was transferred into a 20ml –sterile test-tube. A sterile inoculating wire loop was used to scrape organism from these slants into the normal saline. The suspension was then transferred into a conical flask containing 190ml of sterile mineral salt medium (minimal medium C) of Mill s et al (1978) containing 1ml of Bonny light crude oil. This mixture was agitated and incubated at room temperature 28 ± 2oC for 7 days. One hundred and ninety milliliters of this culture was then transferred aseptically into a 3 litre Erlenmeyer flask containing 1, 800ml of mineral salt medium and 10ml of Bonny light crude oil. The flask was placed on a rotary shaker. The contents of this flask were then transferred into 20 litre plastic Jerry can that had been sterilized with butanol. The Jerry can contained 17, 900ml of mineral salt medium and 100ml of Bonny light crude oil. The culture was incubated for seven days. The jerry can was shaken thrice daily to ensure aeration. The pHs of the cultures at all stages were monitored daily and maintained at 7.2 adjusting with standard phosphate buffer (APHA, 1985). Aliquots of the final culture were centrifuged. The deposits were collected and weighed. The process (centrifugation) was repeated until the weight (wet) desired was achieved. This deposit served as inoculum for treatment cells. The bacterial deposits obtained during scaling-up process were transferred into a sterile 4 litre Jerry-can containing 4000ml of normal saline. This was shaken vigorously to ensure proper mixing of the contents. The contents were then poured onto the soil of appropriate treatment cell. The culture was poured all round the cell to ensure even spread within the cells. The microbial load applied per cell was 100kg/ha.Determination of Physicochemical Parameters of Soil: Soil physical properties such as soil moisture and percentage sand clay and silt were determined using procedures in British Standards Institute (1990). Total organic carbon and Total Nitrogen of soil were determined using Walkley-Black and Macro-Kjeldahl methods respectively (Black, 1965, APHA, 1985). Soil pH was determined using PYE UNICAM, England PW 9418 pH meter fitted with a combined glass pH and reference electrode (APHA, 1985). Electrical conductivity was determined using Electrolyte conductivity meter Model MC-1 Mark V Electrical instrument Ltd. England (APHA, 1985). Soil moisture content was determined by evaporation on Whatman filter paper NO 1 (BDH Chemicals England) at 103° to 105°C in an electrical oven. Salinity was determined using the Argentometric method (APHA, 1985). Available phosphorus was determined using Bray NO 1 Method (Black, 1965, APHA, 1985). Total Hydrocarbon was determined by extraction of hydrocarbons into toluene (Odu and Isinguzo, 1979) and measuring absorbance at 400nm using Model 6100 visible range spectrophotometer PYE UNICAM instruments England and reading off the concentration from the standards curve, obtained from toluene (BDH Chemicals, England) extracts of Bonny Light Crude Oil at different concentrations. Analyses of Variance (ANOVA), Least Significance Difference (LSD), and Correlation Coefficient methods (Finney, 1978) were employed to analyze data. RESULTS AND DISCUSSION In Figures 1, 2, 3, 4 and 5 the physicochemical characteristics of the area before and during remediation are presented. The total heterotrophic bacterial count and percentage hydrocarbon utilizing bacterial population during the study are presented in Tables: 2 Due to the heavy rainfall and the organic nature of the soils in the area, water was not a limiting factor. Thus the various treatment options had no significant difference intheir effects on moisture content throughout the 20 week study period (Figure 1). There was a significantly negative correlation (r = -0.69) between hydrocarbon reduction and soil moisture content demonstrating the fact that moisture was not a limiting factor and biodegradation did not improve the moisture level. There was no significant difference between the various remediation treatments for pH, electrical conductivity and available phosphorus. The organic carbon dropped from 18.14% in option A treated with indigenous HUB plus fertilizer and tilling (Figure 3). These results revealed that organic C degradation took place during the study period in spite of the swampy nature of the environment and nutrient additions enhanced degradation to a greater extent. This was supported by the significantly lower organic C values (P < 0.01) recorded for treatment options A and D than those recorded for C2 E and B from the 12th week to the 20th week after remediation treatment (Figure 3). During the 20–weeks of remediation trial, treatment options A and D received a total of 1.6 tons per hectare of 15:15:15 NPK fertilizer. An attempt was made to assess the relationship between organic C and period of study and found this relationship was found to be significantly negative (r = -0.520). This showed that organic C levels reduced with time implying that THC loss may have increased with time. Also the linear regression obtained in comparing organic C data and THC loss for the trial period was negative (r= -0.320) though not significant. The applied nitrogenous nutrient provided a favourable environment for the loss of hydrocarbon. The total N levels in the fertilized treatment options (A and D) were significantly higher at 99% probability level than the unfertilized treatments. The purpose of applying N was to increase its level in the soil for microbial build-up. Nitrogen has been reported as one of the limiting nutrients in oil polluted soils (Morgan 1991, 1993). There was a significantly positive relationship (r = 0.674) between total N and hydrocarbon loss. Significant reduction in C/N ratios at 99% probability level were recorded for the treatment options supplied with HUB and nitrogenous nutrient sources (A, B and D) during the 20- week period of remediation trial. At the 20 th week (Figure 5), a lower C/N ratio (25) was recorded for A and D both of which received about 240 kg N/ha of inorganic fertilizer while the highest C/N ratio (56) was recorded for the control (C2 ). The fact that lower C/N ratios were recorded for the treatment options supplied with inorganic fertilizers indicates that some nutrient elements were lacking. Furthermore, it established that nutrients induced in–situ bioremediation is also possible in the mangrove environment. However, tremendous reductions in C/N ratios were also recorded in the no fertilizer treatment options like C2, E and B. For option B supplied with indigenous HUB alone and tilling, C/N ratios reduced from 91 to as low as 35. This shows that artificial build-up of indigenous HUB populations is helpful in reducing hydrocarbon levels in this environment. For the rest treatment options (C 2 and E), flushing possibly removed a lot of the hydrocarbons, which then provided a favourable environment for the indigenous HUB population to act. An attempt was made to correlate C/N ratio with hydrocarbon loss and found the relationship to be significantly negative (r = -0.523). This meant that hydrocarbon degradation and loss increased with smaller C/N ratios justifying the use of nitrogenous nutrient sources to aid biodegradation. Also the correlation analysis between C/N ratio and time was negative (r =-0.552) indicating that longer times are required to obtain smaller C/N ratios. After 20 weeks of remediation trial, hydrocarbon levels reduced from 1.22% before remedial treatment to a range of 0.2% in option A (applied with indigenous HUB fertilizer and tilling. The recorded percentage hydrocarbon reduction for the various treatment options (Fig. 4) were 36, 63, 65,76,82 and 84 for C1 E C2 , B, D and A, respectively. Statistically, A and D all of which received about 16 tons per hectare NPK 15: 15: 15 fertilizer during the period, recorded higher (P < 0.01) level of hydrocarbon loss than the rest of the treatment options. The development was attributed to the N requirements of the hydrocarbon-utilizing bacterial population (Morgan, 1991). This suggested that nutrient enhanced in-situ bioremediation is also possible and effective in this area. The fact that up to 60% hydrocarbon reduction was recorded for the no fertilizer treatment options (C2, E and B) implied that natural recovery in this area is quite fast. The results of the total heterotrophic bacteria count of the plots ranged from 1.3x 10⁸ Cfu/g to 3.1x10⁹ Cu/g (Table 2). The results showed an apparent variation in bacterial counts from the very first day (Week 0) to the week 8 for all treatment options. However, after the week, 8 two treatment options, A and D showed increases for the remaining period of the remediation program. Other treatment options C2 , C1 , and E showed apparent variation in bacterial counts. The increase in THB population in option B may have resulted from the addition of indigenous HUB. Similarly, that recorded for D may have resulted from the addition of nitrogen and phosphorus containing fertilizers which stimulated microbial growth. It has been reported that the addition of nitrogen and phosphorus enhances biodegradation of polluted soils presumably by removing the N and P limitations resulting from low natural levels in these habitats (Lee et. al., 1993). But in the present study, initial P level was very high (Table 1) while N level was medium to low. Therefore N may have been the limiting nutrient element. The increase in THB in option A may have been due to the combined effects of addition of HUB and limiting nutrient. The apparent absence of THB increases in the other treatment options. C1, C2 and E indicated the inability of the treatment options to stimulate significant heterotrophic bacterial growth without the addition of nutrients or external microbial sources.There was a rise in the percentage HUB counts from the first day (0 week) to the 20th week in all treatment options (Table 2). This rise was however very slight (magnitude of 10) in treatment options C1, C2 , and E. The rise was of greater magnitude (10 3 ), in B and D. Studies have revealed that in the event of an oil spill, the microbial consortia, a mixed population of oil degrading bacteria responds to the elevated supply of carbon by undergoing exponential growth and as the more susceptible components are degraded, the microbial population selectively adapt themselves to changing composition of the remaining oil (Atlas et al., 1991). In the present circumstances, the rise was greatest in options A, B and D which reflected the role played by external addition of limiting nutrient in A and D. The results obtained in option D showed that large increases in HUB populations can be achieved ordinarily by adding nutrients. Since the addition of limiting nutrients in the form of fertilizers is much cheaper than the large scale cultivation of indigenous HUB populations with subsequent inoculation into polluted habitats (Lee et al ., 1993), option D which is addition of fertilizer alone and tilling may be preferred. CONCLUSION: The higher hydrocarbon loss recorded in options A, D and B reflected the role of the external addition of indigenous HUB in A and B, and the addition of limiting nutrient in form of fertilizers in A and D. The results in this study showed that reduction in hydrocarbon levels can be achieved either by addition of limiting nutrients alone, or a combination of addition of limiting nutrients and HUB populations alone. The result obtained in D revealed that increases in HUB populations can be achieved by just adding limiting nutrients in the soil. Since experience showed that addition of limiting nutrients in the form of fertilizers is much cheaper than the large scale cultivation of indigenous HUB populations before inoculation into polluted habitats (Lee et al ., 1993), there might be no need to cultivate HUB. Moreover, there is no statistical difference in hydrocarbon loss between addition of fertilizer alone (D) and combination of HUB populations and fertilizer (A), therefore the addition of limiting nutrients alone, (D) in the present study, is preferred. REFERENCE
Copyright 2003 - Journal of Applied Sciences & Environmental Management The following images related to this document are available:Photo images[ja03015f5.jpg] [ja03015t2.jpg] [ja03015f3.jpg] [ja03015f4.jpg] [ja03015f1.jpg] [ja03015f2.jpg] [ja03015t1.jpg] |
| |||||||||
