 |
| About Bioline | All Journals | Testimonials | Membership | News |
|
||||||
|
||||||
Journal of Applied Sciences & Environmental Management, Vol. 8, No. 1, June, 2004, pp. 13-15 Laser induced breakdown spectroscopy in water *BOUDJEMAI, S; GASMI, T; BOUSHAKI, R; KASBADJI, R; MEDJAHED, F Equipe Analyse par Laser, Division des
milieux ionisés, Centre de Développement des Technologies Avancées : CDTA,
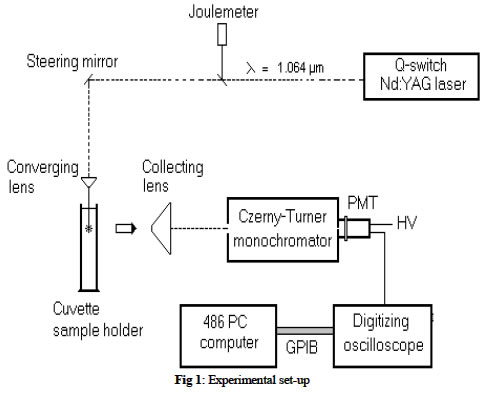
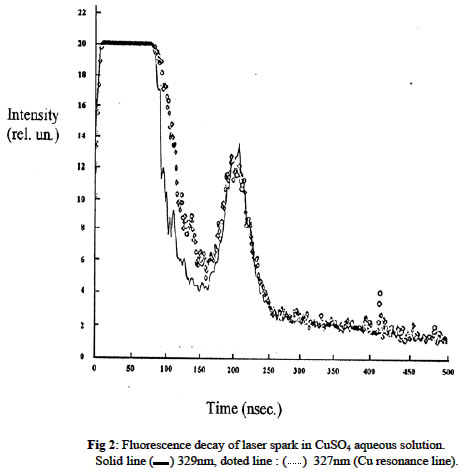
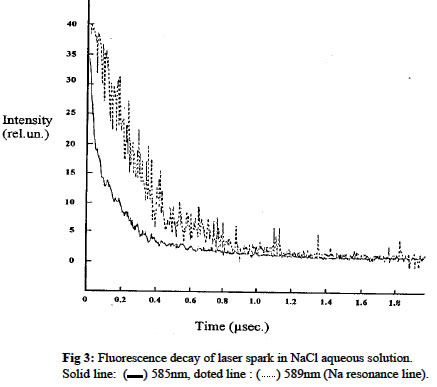
Cité du 20 Août 1956, B.P17, Baba Hassen, Alger, Algerie Code Number: ja04003 ABSTRACT: Preliminary experimental results are reported on the temporal characteristics of laser spark emission spectra. Sparks were generated in water by the focused beam of a Q-switched Nd:YAG laser Na and Cu aqueous solutions exhibited fluorescence signal on the decaying edge of plasma emission at their respective characteristic resonance lines. Potential of the laser plasma spectroscopy for in-situ pollution monitoring in natural and wastewater is briefly discussed. @JASEM This work was motivated by the worldwide increasing interest for new analytical methods applicable for in-situ monitoring of environmental pollution. Compared to conventional analytical methods, the laser induced breakdown spectroscopy (LIBS) can be superior for fast, automated measurements because no sample preparation is needed. It is a special advantage that, using optical fibres, the plasma production and the observation as well, could be carried out in any depth of the water, providing outstanding possibilities to trace the streams of contaminated liquid layers under the surface. In order to decide on the potential facilities of this method, we studied the basic phemenology of the laser plasma generated in a liquid medium. Laser beam analytical methods are widely used in all the material sciences and have extended literature (Corney et al., 1977; Demtroder, 1982; Svanberg,1990). There is a large variety of these methods, however, most of them are based on selective excitation of the atoms, ions or molecules of interest, utilizing spectrally tunable laser sources. These equipments are relatively complicated and less reliable, consequently not well suited for off-laboratory measurements. In contrast, laser spark in gases, liquids or on solid targets can be generated simply by focusing the beam of a medium laser power. Relatively inexpensive, reliable Q-switched Nd:YAG lasers are well suited for this purpose. The power density needed to produce laser spark is in the range of 10-100 MW/cm2 . Physical processes responsible for the laser spark formation are reviewed (Bakos, 1989). The laser spark is absorbed mainly via multiphoton ionization and inverse Bremsstrahlung . The liberated initial electrons of high initial kinetic energy are multiplicated by avalanche mechanism as they collide with the surrounding atoms and positive ions. Consequently and within few nanoseconds, a very dense plasma ball is formed with a diameter of few micrometers and a temperature of 103-203 K. While this “laser spark” is expanding very rapidly, its temperature is decreasing and consequently the initial radiation of continuous spectra radiation is followed by the emission of ionic and after 50-100 ns of atomic spectral line. As in the first stage of the plasma formation, complete atomisation (and ionization) occurs, the spectrum emitted in the decaying interval is characteristic for the elemental composition of the targeted material. Application of the laser spark for chemical analysis of gases and solids is reviewed extensively in literature (Cremers et al., 1989). Spectroanalytical aspects of laser sparks in liquid have been much less studied. Vlasov et al. investigated the radiation of laser plasma generated on the surface of water solutions of NaCl and FeBr2 (Vlasov et al., 1991). The aim of this work is the study of fluorescence decay of laser spark in CuSO4 and NaCl aqueous solutions. MATERIAL AND METHODS The experimental set-up is shown in figure 1. The source used for the plasma production was a Q-swithed Nd:YAG laser (10Hz repetition rate Home made with maximum output energy of 100 mJ for 18 ns pulse length). A plano-convex lens (75 cm of focal length) focused the laser beam at 15 mm depth under the water surface. The emitted light of the spark was observed through one of the glass walls of the cuvette. The image of this plasma was projected onto the entrance slit of a Czerny-Turner grating type monochromator (1200 grooves/mm, f = 250mm, resolution 0.2nm). A Hamamatsu R456photomultiplier tube was applied to the exit slit of this monochromator. The photodetected signal was then viewed by a HP 50454-250 MHz digitizing oscilloscope and finally recorded by a 486 PC data acquisition system. Different liquid samples were studied in a preliminary experimental series, in order to learn the proper conditions and the limitations of the laser plasma productions. Plasma was hence generated in distilled, tap waters, natural seawaters, CuSO4 and NaCl aqueous solutions. The breakdown threshold observed in air was 90 mJ, in distilled water 45 mJ whereas in natural water samples and salt aqueous solutions it was typically in 9-12 mJ range. Spectral measurements were carried out CuSO4 and NaCl aqueous solutions with concentrations of 1-20 g/L. The temporal dependence of the plasma emission was recorded not only on the wavelengths corresponding to the resonance radiation of Cu and Na atoms but, and for the sake of further comparisons, at few nanometres off these wavelengths as well. The actual resonance lines investigated were the 327nm for Cu and 589nm for Na. RESULTS AND DISCUSSION Results of these measurements are shown in figures 2 and 3. In these graphs the negative output of the PMT is plotted as a function of time. Each curve was obtained by successive averaging over 8 laser shoots. The results of measurements taken in CuSO4 water solution are shown in figure 2. The detailed temporal structure of the laser plasma radiation is clearly illustrated. The intense white light originating from the laser plasma and lasting 80 ns, saturates the PMT. This saturation both persisted with the copper at its 327 resonance line (doted line) and also when the monochromator was tuned off its resonance line by 2nm (329nm continuous line). After 0.1 µs of the plasma breakdown, a significant difference is noticeable between the two plots, the off-resonance emission decays very rapidly while the measured intensity on the characteristic resonance line is still high. Additionally, this difference increases with time because the decay of the resonance radiation is slower. A longer time scale is used in figure 3 and this is the reason for not showing the first part of the signal. The dashed line was measured with the monochromator tuned to the 589nm Na spectral line, while the continuous line represents the off-line measurements taken at 585 nm for a NaCl concentration of 10g/L. In this case the second laser peak was absent and the fluorescence decay is better observed. The difference between the two curves is evident for a signal length of about 1.2µs. The most intense early radiation does not provide any information; it only appears as a background. Time resolved or gated measurement is needed to overcome this difficulty. However, the laser plasma itself is poor reproducibility and for quantitative measurements the average of several laser shoots has to be measured. These preliminary experimental results demonstrate that analysis of bulk liquids using laser breakdown spectroscopy is possible and is particularly applicable to situations requiring real time and non invasive analysis method. It appears that the sensitivity of this method is not as high as that of some of the traditional ones, like the atomic absorption spectroscopy. However, this situation could be significantly improved by the introduction of successive spark pairs, increasing the number of averaged laser shots, decreasing the spectral bandwidth of the detection, using gated integration over the decaying part of the signal and evaluating the difference between spectrally on- and-off- resonant radiation. REFERENCES
Copyright 2004 - Journal of Applied Sciences & Environmental Management The following images related to this document are available:Photo images[ja04003f2.jpg] [ja04003f3.jpg] [ja04003f1.jpg] |
| |||||||||
