 |
| About Bioline | All Journals | Testimonials | Membership | News |
|
||||||
|
||||||
Journal of Applied Sciences & Environmental Management, Vol. 9, No. 1, 2005, pp. 31-37 Estimate of Groundwater in Parts of Niger Delta Area of Nigeria Using Geoelectric Method 1OKOLIE, E.C, 2OSEMEIKHIAN J.E.A, 2ASOKHIA M.B 1 Department
of PhysicsDeltaStateUniversity Abraka Code Number: ja05006 ABSTRACT: The River Niger,
which flows beside Asaba, is grossly inadequate for domestic use due to
activities in its early stages. At Ibusa, the existing streams are not good for
domestic use due to contaminations. Unfortunately, these have been the main
sources of water to residence of Asaba and Ibusa. The situation is worse in Ogwashi-Uku
where there is no nearby stream. This inadequacy of potable water is of great
concern to the residence of these communities. The groundwater potential of Asaba
and neighboring towns in parts of Delta State of Nigeria was therefore, evaluated using geoelectric method to
alleviate this problem (Mbipom and Archibong 1989). The data obtained showed
that while the formation at Asaba is AK type, the neighboring towns have
typically A- type curves. The resistivity of the top soil ranges from 73m
-130m, while the second and third layers are 120m-230m and 320m-560m
respectively. Viable aquifer is within 35m to 40m at Asaba but above 100m at Ibusa
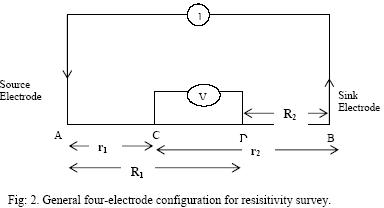
and Ogwashi-Uku which are just a few kilometers away. @JASEM Delta State is blessed with constantly flowing North-South River Niger, which forms a natural boundary between the State and other Eastern States. Unfortunately, it is highly contaminated and unfit for any domestic use. With the geometric increase in population within and around the State Capital territory, the demand for potable water has increased marginally. It is now a major problem. No wonder then the State Government sets aside a reasonable part of its budget for the provisions of portable water to inhabitants within the area. To achieve the best, a geophysical investigation is necessary to estimate the groundwater profile within and around the state capital (Okwueze, et al 1998). This was carried out using Vertical Electrical Survey method to obtain aquifer depths at Asaba through to Ubulu-Uku. At Ibusa, aquifer is within 100m to 130m while at Ogwashi-Uku it is 140m to 180m and at Ubulu-Uku it is above 180m. The resistivity plot shows that sites in Ibusa, Ogwashi-Uku and Ubulu-Uku have A-type formation while Asaba has AK-type curve. The area of study is within Latitude 6.20o and 6.45o, and Longitude 6.00o and6.30o. The study was carried out in five major towns (Fig 1). The top soil at Asaba is sandy to clayey sand while Ibusa and Ubulu-Uku have thick dry lateritic soil to far depth. Ogwashi-Uku is remarkably on a hill with thick sandy soil. The Benin formation appears to be fading away gradually in the study area which is characterized by undulating topography. EXPERIMENTALS (Fig. 2). Nineteen VES soundings were utilized. The interpretations and results of the data were correlated with existing borehole data and some available well log data from Delta State Utilities board. The theory and Data Evaluation: The theory is based on the fact that resistivities of rocks and soils are influenced by groundwater which acts as electrolyte in soil (Milsom, 1992). Electrical resistivity technique utilizes the contrast in resistivity of ore bodies and their host rocks in determining presence of good conducting minerals. In addition, the good electrical conductivity of groundwater makes the resistivity of a sedimentary rock much less (lower) when it is water logged than in dry condition (Lowrie, 1997). Generally, the arrangement consists of a pair of current electrodes and a pair of potential electrodes, which are driven into the ground, in a particular site of interest, to make a good contact in straight line. One of the current electrodes acts as the source while the other is the sink (Reinhard, 1974). Current is passed into the earth through the terrameter to produce electric field within the subsurface with electric potentials. The potential at electrode C due to the source electrode A, in (fig 2) is
while the potential at C due to potential electrode D due to the sink electrode B is
The resultant potential at electrode C due to the two current electrodes is therefore,
Similarly, the resultant potential at electrode D due to the two current electrodes is
where r1, r2, R1 and R2 are distances defined in fig.2
Thus, the potential difference (Vc – VD) between the two inner electrodes measured by the voltmeter connected between C and D is
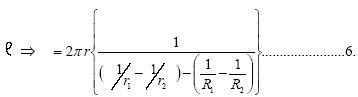
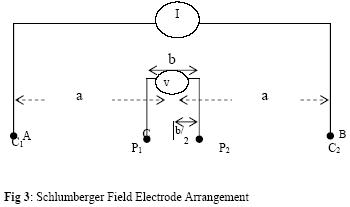
In the study of the earth interior or subsurface, resistivity measured is not the exert resistivity because the measurements are not made directly on the body especially where there is inhomogeneity (Mbipom and Archibong,1989). Hence, it is called apparent resistivity (Okwueze and Ezeanyim, 1988). In a homogeneous layer the resistivity is constant it is independent of both electrode spacing and surface location (Egbai and Asokhia, 1998). However, some terrains show inhomogeneous subsurface and anomalies in apparent resistivity values (Kearey and Brooks 1991). In such studies the wider the electrode spacing, the deeper the penetration. Okwueze et al, (1994) showed that current penetration to a depth say Z is achieved with a total current spread L, given by L = 3Z so that Z = L/3 ………………….7. For very large current electrode separation, the potential electrode separation is increased to maintain measurable potential difference. In this array, the current and potential pairs of electrodes have a common midpoint but the distance between adjacent electrodes differs (Mamah and Ekine 1989). Where “a” is the distance between the current electrode, station midpoint, “b” is the distance between potential electrodes and “2a” is the current electrode separation. Applying the theory above, the potential at electrode P1 from C1 in Fig 3 will be
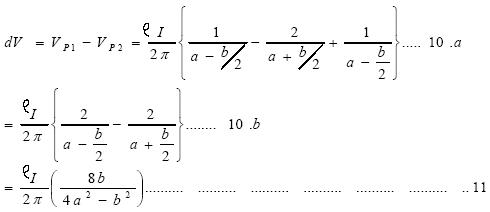
The potential difference “dV” between the two potential electrodes is therefore, given by
where a>>b as in Schlumberger array
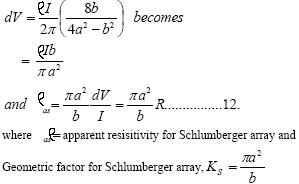
Thus,
with a = 1 and b = 0.2, Ks = 7.54.To maintain the relation (C1C2
> 5P1P2), the values of AB/2
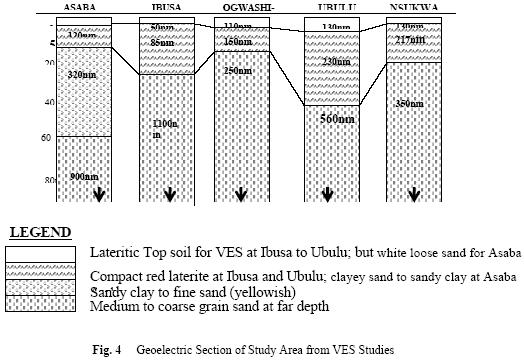
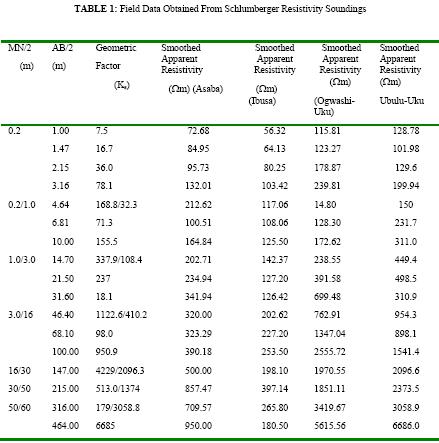
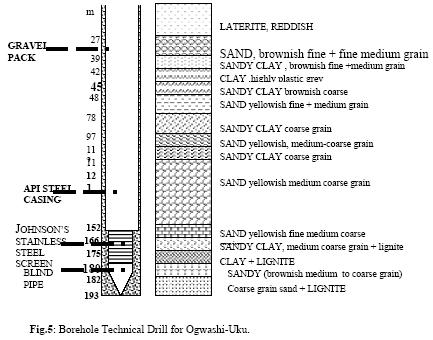
are increased to INTERPRETATION AND RESULTS The field data were used to compute the apparent resistivity values and the smoothed values were plotted against half the current electrode separation on bi-log graphs. Qualitative and quantitative analyses of the curves were made by partial curve marching of field curves with relevant Schlumberger developed master and auxiliary curves. The resistivity values and corresponding thicknesses were fed into computer soft ware to obtain iterated curves. (i) Qualitative Interpretation: The sites in the study area are predominantly characterized by A-type curves as in Ibusa, Ogwashi-uku, and Ubulu-uku. However, Asaba shows evidence of AK curve type (Zhody et al, 1974). (ii) Quantitative interpretation: Quantitative treatment and analyses of the data delineate three to five distinct layers in the study area. Using the results obtained from computer modeling and iteration within the limit of equivalence (Okwueze et al 1988), the geo-electric sections for the area were developed (Fig. 4). DISCUSSION The geo-electric sections for the sites show that the there are three to five distinct layers to depth of penetration. The resistivities of top soil formations are generally between 110Ωm and 130Ωm at Ogwashi-uku, Nsukwa and Ubulu-uku while it is as low as 73Ωm and 50Ωm at Asaba and Ibusa respectively with an average layer thickness of 1m. The topsoil is thickest at Ubulu-uku where it is up to 2 metres. This top layer is red loose Laterite and is underlain by a thick red lateritic burden whose thickness ranges from 6metres at Ogwashi-uku to 25 metres at Ubulu-uku. At Asaba however, the top layer is mainly clayey Sand of about 2.5 metres thick. This may be attributed to nearness to the bank of the River Niger. The resistivity of the second layer varies from 85Ωm at Ibusa to 230Ωm at Ubulu-uku. At Asaba, the third layer is essentially sand clay and fine to medium sand as one goes deeper with resistivity values within 320Ωm (Table 1). Ubulu-uku has third layer resistivity of 500Ωm while at Ibusa a layer, which consists of weathered rock and shale of 1100Ωm is encountered before getting into medium grain sand. Springs and streams are also common occurrence because of the undulating topography and rock faults on the Lee side of Ibusa. The geo-electric section shows that the layer with a resistivity of 320Ωm at Asaba is water bearing. Thus, the aquifer at Asaba is within 35m from the surface (Fig. 5). At Ibusa, the third layer with resistivity value of 250Ωm consists of fine to medium grain sand. Water bearing medium may be encountered at 60m to 70m but the first aquifer may be struck at about 100 to130m. At Ogwashi-uku and Ubulu-Uku, viable aquifer is struck at depths above 140m to 180m. These are in agreement with available borehole records (Fig 5). Conclusion: While groundwater at Asaba is estimated to be 35m, Ibusa, Ogwashi-Uku and Ubulu-uku have their peculiarities. The study shows that they have deep aquifers. At Ubulu-uku aquifer depths are found to be at about 180m.Ubulu-Uku. The town is remarkable for its thick red lateritic formation to very far depth. The aquifer in Ibusa is within 100m to 110m after piercing through hard-stone screen. Perched aquifer exists at 60m – 75m. Water may also be intercepted at 40m to 50m in some points where false aquifers exist. Between Ibusa and Okpanam is a very wide expanse of undulating formations that have given rise to many rock and aquifer outcrops like the Okpuzu spring and many long - time flowing streams (Oboshi and Atakpo streams) which empty into the river Niger. These have been the traditional source of water for the residence in these communities. Deep aquifer may be struck at 130m down but it is not advisable as there is possibility of getting into thin layer of lignite within Ibusa. At Ogwashi-Uku, viable aquifers may be sited at far depth on the south end of the town. Generally, aquifers in the territory are unconfined as there is no layer of thick clay. REFERENCES
The following images related to this document are available:Photo images[ja05006f4.jpg] [ja05006f1.jpg] [ja05006f3.jpg] [ja05006t1.jpg] [ja05006f2.jpg] [ja05006f5.jpg] |
| |||||||||

/embed/ja05006e1.jpg)
