 |
| About Bioline | All Journals | Testimonials | Membership | News |
|
||||||
|
||||||
Journal of Applied Sciences & Environmental Management, Vol. 9, No. 1, 2005, pp. 39-43 Effect of pH and Nutrient Starvation on Biodegradation of Azo Dyes by Pseudomonas sp *ORANUSI, N A; OGUGBUE, C J Department of Microbiology, Faculty of Science, University of Port Harcourt, Port Harcourt, Nigeria E- mail – ceejay55us@yahoo.com Code Number: ja05007 ABSTRACT: The effect of pH and some nutrients starvation on biodegradation of azo dyes (Orange II and Direct Blue 71) by Pseudomonas sp. was investigated. Highest percentage decolourization values of 56.50% and 45.20% were obtained at pH 7.0 and 6.5 for Orange II and Direct Blue 71 respectively. Rate of decolourization decreased with increasing concentration of nitrate (sodium nitrate) or sulphate (magnesium sulphate heptahydrate). Highest percentage decolourization (79.29% for Orange II and 72.38% for Direct Blue 71) was obtained in positive controls (no nitrate added). Corresponding values for sulphate-limited conditions were 76.50% for Orange II and 78.24% for Direct Blue 71 in positive controls (no sulphate added). The nitrogen of the generated aromatic amines provided the sole source of nitrogen in positive controls. Desulphonation of the aromatic moiety provided the sole source of sulphur in the positive control medium. The study shows that detoxification of ecosystems contaminated with azo dyes are enhanced under nitrate and sulphate-limited conditions. @JASEM
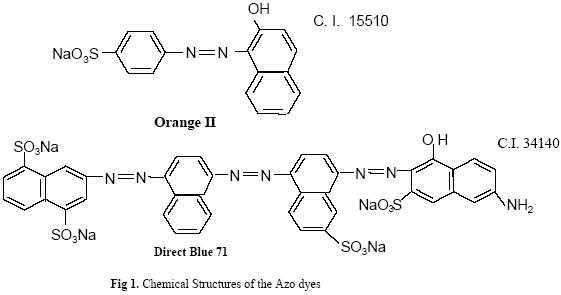
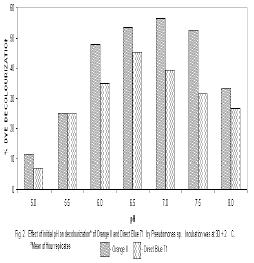
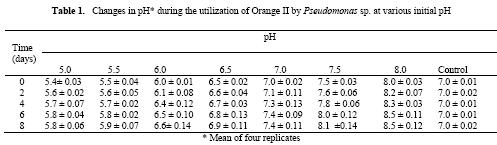
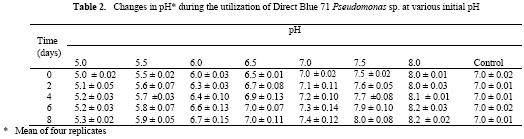
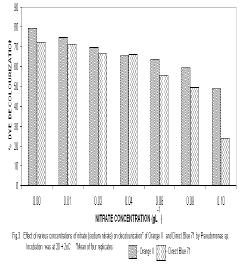
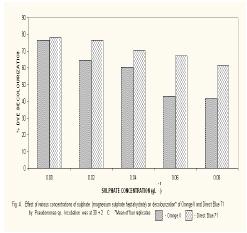
Microbial degradation of azo dyes has been reported: Proteus mirabilis (Chen et al., 1999); Pseudomonas sp. (Oranusi & Ogugbue, 2001) Actinobacillus succinogens (Park et al.,1999); Pseudomonas luteola (Hu,1998) and Mycobacterium avium (Jones et al., 2003). Under anaerobic or microaerophilic conditions, azo dyes are degraded to aromatic amines by the enzyme azoreductase secreted by microorganisms (Plumb et al.,2001; Yoo et al., 2001). These aromatic amines are toxic, mutagenic and carcinogenic (Bell et al., 2000) and are a potential source of concern in the environment. Under aerobic conditions, the aromatic amines are metabolised further, therefore, completing the detoxification of aromatic amines. Biodegradation of pollutants in natural ecosystems is influenced by various environmental factors including pH, temperature, salinity, cations, anions, biochemical oxygen demand, chemical oxygen demand and oxygen (Ganesh et al., 1994). Biodegradation of dyes has been monitored using various indices: decolourisation (Chen et al., 1999; Oranusi and Ogugbue, 2001); total viable count (Oranusi and Ogugbue, 2001) and mineralisation (Blumel et al., 1998). In this study, we investigated the effect of pH and nutrient (nitrate and sulphate) starvation on biodegradation (decolourisation) of azo dyes (Orange II and Direct Blue 71) by Pseudomonas sp. under aerobic conditions. MATERIALS AND METHODS Dyes: Orange II and Direct Blue 71 (Aldrich Chemical Co., U.S.A.) were used at their commercially available dye content of 90% and 50% respectively. Stock solution of each dye was prepared by dissolving 2.0 g of each dye in 100 ml-deionised water (20 mg ml-1) and sterilized by membrane filtration (0.20μm pore size Acrodisc). Fig. 1 shows the structure of the dyes. Organism: Pseudomonas sp. was isolated as previously described (Oranusi and Ogugbue, 2001) by selective enrichment in batch culture to growth in Orange II and Direct Blue 71 as sole sources of carbon and energy. Standard inoculums (ca. 106 CFUml-1) was prepared by subculturing from the stock culture into 10ml nutrient broth and incubated at 30±2°C for 24h. Media: Three types of media were used: Medium 1 contained (gL-1); NaCl 4.0, MgSO4. 7H2O O.42, KCl 0.29, K2HPO4 1.27, KH2PO4 0.85, NaNO3 0.42, EDTA 0.5ml and deionised water 1,000ml. Medium 2 was same as medium 1 but contained various concentrations of nitrate (sodium nitrate). Medium 3 was same as Medium 1 but contained various concentrations of MgSO4. 7H2O and without sodium nitrate. All media were sterilized by autoclaving at 121°C for 15 min. and 15psi. After sterilization and cooling, five milliliters of Orange II or one milliliter of Direct Blue 71 were added to each of M1, M2 or M3 medium. Media, which contained Orange II, were designated M1O, M2O or M3O while, media, which contained Direct Blue 71, were designated M1D, M2D or M3D. Effect of pH: The pH of each of media M1O and M1D were adjusted to various pH values: 5.0, 5.5, 6.0, 6.5, 7.0, 7.5 and 8.0. In order to ensure that decolourisation was not a function of pH change, the effect of pH on the visible absorption was assayed between pH 4.5 to 8.5 at λmax for each dye. The visible absorption spectra of the dyes were not affected at pH values from 5.0 to 8.0 . Slight increase was observed at pH 8.5 and decrease at pH 4.5. These pH values were, therefore, not included in this study. Each of M1O or M1D medium was dispensed in 90ml amounts into duplicate set of 250ml Erlenmeyer flask and inoculated with 10ml of standard inoculum. Each pH value had duplicate set of uninoculated control flasks. Cultures and control flasks were incubated at 30±2°C with shaking at 100rev. min.-1. Samples were withdrawn on zero day and every 2- days for determination of pH and optical density of culture supernatant (decolourisation). The optimum pH for decolourisation of Orange II was pH 7.0 and pH 6.5 for Direct Blue 71. The pH of media for subsequent experiment was adjusted to these optimal. Effect of various concentrations of nitrate: The pH of M2O and M2D media were adjusted to optimal value for decolourisation (pH 7.0 for Orange II and 6.5 for Direct Blue 71). Into each of duplicate set of 250ml Erlenmeyer flasks containing 90ml of M2O or M2D medium was added various concentrations (g ) of sodium nitrate (0.01, 0.03, 0.04, 0.06,0.08, 0.10). Positive controls consisted of duplicate set of flasks without sodium nitrate. These flasks were each inoculated with 10ml of standard inoculum. Negative controls consisted of duplicate flasks for each concentration but were uninoculated. Incubation was at 30±2°C with shaking at 100 rev. min.-1 . Samples were withdrawn on zero day and at two-day intervals for determination of pH and optical density of culture supernatant (decolourisation). The highest dye decolourisation was obtained in M2O and M2D media without nitrate (i.e. positive controls). Subsequent studies were carried out without nitrate addition. Effect of various concentrations of sulphate: Into each of duplicate set of 250ml Erlenmeyer flasks which contained 90ml of either M3O or M3D medium (pH = 7.0 for Orange II or pH 6.5 for Direct Blue 71 and without nitrate) was added various concentrations ( g ) of magnesium sulphate heptahydrate (0.02, 0.04, 0.06, 0.08). Positive control consisted of duplicate set of flasks in which was added 0.04g of magnesium chloride heptahydrate to provide the Mg2+ requirement. The flasks were each inoculated with 10m1 of standard inoculum. Uninoculated duplicate set of flasks for each concentration were set up as negative controls. Incubation was at 30±2°C with shaking at 100 rev. min.–1. Samples were withdrawn on zero day and at 2-day intervals for determination of pH and optical density of culture supernatant (decolourisation). Determination of Optical Density (OD): Two millilitres were aseptically withdrawn from each flask and pooled (4m1). Centrifugation was at 6,000rpm for 30min. in a bench centrifuge (Baird and Tatlock, England). The supernatant was carefully withdrawn. Supernatant from Orange II grown cultures were designated S1 while, S2 was for Direct Blue 71 cultures. The cell pellets for each sample was suspended in physiological saline, mixed thoroughly and centrifuged as above. The resulting supernatant was designated S3. The optical density of various supernatants was determined spectrophotometrically with spectrophotometer 6110 (Jenway, United Kingdom) at λmax for each dye (380nm for Orange II and 330nm for Direct Blue 71). Percentage dye decolourisation (DD) was calculated: pH determination: The pH of S1 and S2 was determined with pH meter (Mettler Delta 340). RESULTS AND DISCUSSION Effect of pH: Maximum percentage decolourisation (56.50% Orange II and 45.20% Direct Blue 71) was obtained at optimal pH of 7.00 and 6.50 for Orange II and Direct Blue 71 respectively (Fig. 2). On either side of pH optimal, percentage decolourisation decreased as the pH increased to acidic or alkaline range. Reductive cleavage of azo bond (-N=N-) in azo dyes generates colourless aromatic amines (Ganesh et al., 1994). The increase in pH towards the alkaline range with time (Tables 1 and 2) may be attributed to the accumulation of these basic aromatic amines and/or other metabolites. Effect of various concentrations of nitrate: Figs. 3 shows the percentage decolourisation in nitrogen – sufficient and nitrogen – limited cultures which contained Orange II and Direct Blue 71 respectively. In both cases, percentage dye decolourisation decreased with increasing concentration of nitrate. Maximum percentage decolourisation (79.29% for Orange II and 72.38% for Direct Blue 71) was obtained in media without added nitrate (positive control). Maximum percentage decolourisation for each nitrate concentration was higher in Orange II containing M2O medium than in Direct Blue 71-containing M2D medium. For example, at 0.01g, decolourisation was 74.84% for Orange II and 71.54% for Direct Blue and, 48.88% and 23.75% for Orange II and Direct Blue 71 respectively for medium which contained 1.0g nitrate. The results may be attributed to the number of azo bonds. Orange II is a monoazo dye while, Direct Blue 71 is a triazo dye (Fig.1). The cleavage of the single azo bond in Orange II will be faster than in Direct Blue 71 with triple azo bond. In positive control culture (no nitrate), the aromatic amines resulting from cleavage of azo bond were metabolised further to provide the nitrogen requirement of the organism. This will result in detoxification of these toxic, mutagenic and carcinogenic amines. With alternative nitrogen source as in cultures with added nitrate, the organism preferentially metabolised the inorganic nitrogen source (nitrate), until the medium became nitrogen–limited. This may partially explain the decreasing percentage decolourisation rate with increasing nitrate concentration. Decolourisation and mineralisation of azo dyes have been reported to be enhanced in nitrogen-limited than in nitrogen-sufficient cultures (Hu, 1998) Effect of various concentrations of sulphate: Decolourisation was faster in positive control cultures (no sulphate added) than in cultures that contained magnesium sulphate heptahydrate as shown in Figs.4 for Orange II and Direct Blue 71. Highest percentage decolourization (76.50% for Orange II and 78.24% for Direct Blue 71) was obtained in cultures without sulphate. In the cultures with added sulphate, decolourisation rate decreased with increasing sulphate concentration. For example, percentage decolourisation was 64.44% (0.02g), 60.50% (0.04g), 42.85%(0.06g) and 41.45% (0.08g) for Orange II grown cultures. For Direct Blue 71 grown cultures, the values were 76.25% (0.02g); 70.29% (0.04g); 66.94% (0.06g) and 61.25%% (0.08g). Desulphonation of the sulphonate group of the dyes provided the sulphur requirement in cultures without sulphate. Sulphate is used in some dying processes to enhance exhaustion of dyes. Ganesh et al. (1994) reported that decolourisation of Navy 106 and Reactive Black 5 dyes was inhibited in sulphate- sufficient conditions. The results (Fig.4) show that decolourisation of these dyes was enhanced in sulphate-deficiency conditions. In all the negative controls (pH, nitrate and sulphate experiments), no decolourisation was observed. These results confirm that decolourisation was as a result of metabolic activities of the organism and not due to abiotic factors. Desulphonation of the aromatic moiety of the dye molecule coupled with reductive cleavage of the azo bond will prohibit aromatic amine formation, thereby, detoxifying the aromatic amines. Adsorption of dye molecules has been implicated in decolourisation of dyes in microbial cultures (Yuxin and Jian, 1998). The optical density of S3 supernatant was below detectable level (<0.001). This confirms that decolourisation in this study was not due to adsorption on cell surface. Ecosystems are dynamic environments with fluctuations in various environmental factors. This study has demonstrated the potential of the bacterium (Pseudomonas sp.) in bioremediation of dye-contaminated ecosystems subjected to fluctuations in pH, nitrate and sulphate concentrations. Currently, we are continuing our study on the effect of other environmental factors on the biodegradation process. Acknowledgement: This research was funded by the Senate Research Grant, University of Port Harcourt, Port Harcourt. We are grateful to Elder G.O. Ogugbue for assistance to C.J. Ogugbue and Zitadel Laboratory Ltd., Port Harcourt for technical assistance REFERENCES
Copyright 2005 - Journal of Applied Sciences & Environmental Management The following images related to this document are available:Photo images[ja05007f1.jpg] [ja05007f4.jpg] [ja05007f3.jpg] [ja05007t2.jpg] [ja05007f2.jpg] [ja05007t1.jpg] |
| |||||||||
