 |
| About Bioline | All Journals | Testimonials | Membership | News |
|
||||||
|
||||||
Journal of Applied Sciences & Environmental Management, Vol. 9, No. 1, 2005, pp. 150-155 Proximate Composition And Levels Of Some Toxicants In Four Commonly Consumed Spices *NWINUKA, N M; IBEH, G O; EKEKE, G. I Department of Biochemistry, Faculty of Science, University of Port Harcourt, Port Harcourt, Nigeria. Email: banimos@yahoo.com Tel:+2348036779400 Code Number: ja05028 ABSTRACT: Proximate composition and levels of some toxicants (anti-nutrients) in four commonly consumed spices were investigated. The spices were garlic (Allium sativum), ginger (Zingiber officinale), onion (Allium cepa var. cepa), and Piper guineense seeds (Ashanti pepper). Proximate analyses showed the spices to contain (on dry weight basis) moisture ranging from 3.41% in onion to 6.67% in ginger; crude fat ranging from 0.68% (garlic) to 12.50% in Ashanti pepper, while crude protein contents ranged from 8.56% in ginger to 17.35% in garlic. Ash content ranged from 4.06% (garlic) to 8.48% (onion) and total carbohydrate content ranged from 67.59% in Ashanti pepper to 76.71% in onion. All samples were good sources of carbohydrates only. The phytochemical screening of the spices showed the presence of tannins, saponins, oxalates and cynogenic glycosides. All four samples had very low concentrations of tannin (0.01g/100g). The saponin levels ranged between 3.99g/100g in ginger and 48.35g/100g in onion. The oxalate concentrations were in the range 0.03g/100g (onion) to 0.23g/100g (ginger), while the cyanogenic glycoside levels ranged between 30.5mg/100g in ginger and 56.39mg/100g in onion. @JASEM
The aim of this study was to evaluate the nutrient composition including some anti-nutritional factors in four commonly used spices in Nigeria. MATERIALS AND METHOD Collection and Preparation of Test Samples: Allium sativum (garlic), Zingiber officinale (ginger), and Allum cepa var. cepa (onion) were purchased from the Port Harcourt Fruit Garden Market in Nigeria. Piper guineense (Ashanti pepper) fruits were purchased from Choba Market. All materials were procured in their unprocessed state. Onion, garlic and ginger were obtained in their fresh state, while Ashanti pepper fruits were procured in the dry state. The purchased ginger was thoroughly washed with tap water. The light outer skin of the washed ginger rhizomes was scrapped off using a blunt knife and later cut into tiny pieces. The light scaly leaves on the onion bulbs and garlic cloves were removed and the naked bulbs and cloves washed in water before being chopped into tiny pieces. The Ashanti pepper fruits were washed with water. All samples so prepared were then dried in an air-circulating oven in the laboratory and ground manually into a fine power, using a manual grinder. The powder of each sample was sieved through mesh 300μm and stored in an air – tight cellophane bag as stock sample in a refrigerator until required for analyses. Chemical Analyses: The proximate composition of the samples was determined using the methods of the AOAC (1990). Thermal drying method was used in the determination of moisture content of the samples. 1.0g of dried sample was weighed in triplicate and placed in washed, dried and weighed crucible. This was placed in an oven and dried at 105°C for three hours. The sample was allowed to cool in a desiccator and then reweighed. The percentage moisture content was calculated by computing or expressing the loss in weight on drying as a fraction of the initial weight of sample used and multiplied by 100.
where Wo = loss in weight (g) on drying and Wi = initial weight of sample (g) The ash content was determined using the ignition method. The crucibles used were thoroughly washed and pre-heated a muffle furnace to about 500°C. 1.0g of the oven-dried sample used in moisture determination were weighed in triplicate and placed in the pre-heated, cooled and weighed crucible and then reweighed. The crucible was covered with its lid, the number noted and then placed in a cold muffle furnace. The temperature was allowed to rise to 500°C and the ashing carried on for three hours at this temperature. The crucible was removed from the furnace, allowed to cool in a desiccator, and reweighed. The percentage ash content was calculated using the formula: where Ma = Mass of ash (g) and Ms = Mass of sample used (g) Determination of crude protein was done by first all determining the total organic nitrogen using the macro-Kjeldhal method. This involved digestion, distillation and titration. One gram (1.0g) of the sample was weighed in triplicate and placed in digestion flasks. Few granules of anti-bumps and about 3.0g of copper catalyst mixture (96% anhydrous sodium sulphate, 3.5% copper sulphate and 0.5% selenium dioxide) were added to each of the flasks. Digestion was then commenced by adding (to each flask) 20cm3 concentrated sulphuric acid and heating on a heating mantle. Digestion was continued until a clear solution was obtained and then the flask was allowed to cool. The digest was then filtered and made up to 100cm3 with distilled water. 20cm3 of the diluted digest was pipetted into round-bottomed flasks and used in the distillation step. For distillation, the round-bottomed flask was set on a heating mantle and connected, using a Liebig condenser, to a beaker (receiver flask) containing 20cm3 of 2% boric acid with screened methyl red indicator. The condenser was submerged in the boric acid by the use of a Buchner funnel. 30cm3 of 40% sodium hydroxide was then injected into the flask and distillation of the ammonia formed commenced by heating the flask. The distillation was continued until the boric acid solution completely changed from purple to greenish – yellow. The boric acid mixture (containing the ammonium borate complex formed) was then titrated with 0.1N HCl to colourless end point and the titre noted. The total organic nitrogen was then calculated using the formula:
where TV = Titre value, NE = mg nitrogen equivalent to molarity of acid, TVd = total volume to which digest was diluted, Ms = mass of sample (g) and Vd = volume of digest distilled. % crude protein = % TON x 6.25 (6.25 is a general factor suitable for products in which the proportions of specific proteins are not well defined). Determination of crude lipid content of the samples was done using Soxhlet type of the direct solvent extraction method. The solvent used was petroleum ether (boiling range 40°C - 60°C). 3.0g of the dried sample was weighed in triplicate and secured in soxhlet extraction thimble. The thimble was then put into 20cm3 capacity soxhlet extractor. A washed, oven-dried 100cm3 round-bottomed flask was weighed and approximately 60cm3 of the 40-60°C boiling range petroleum ether added to it. The flask was then mounted on the heating mantle and connected to the extractor (with condenser). The condenser and heating mantle were then activated and extraction carried on for four hours. At the end of extraction, the solvent was evaporated and the flask dried in the oven (at 60°C). The flask was then cooled and reweighed. The percentage crude lipid was calculated using the formula:
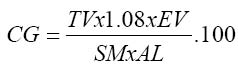
Where Mex = mass of extract (g) and Ms = Mass of sample used (g) Total carbohydrate content of each sample was estimated by ‘difference’. In this, the sum of the percentages of all the other proximate components was subtracted from 100 i.e total carbohydrate (%) = 100 – (% moisture + % crude protein + % crude lipid + % ash). Determination of cyanogenic glycoside content of the samples was done by the alkaline titration method of the AOAC (1990). In this method 200cm3 of distilled water was added to 1.0g of each sample powder in triplicate in an 800cm3 capacity distillation flask. The flask was fitted for distillation and allowed to stand for 2 hours, for autolysis to take place. An antifoaming agent (silicon oil) was then added. Steam distillation was carried on and 150 cm3 of the distillate collected into 250 cm3 capacity conical flask containing 20cm3 of 2.5% sodium hydroxide then diluted to mark with distilled water. To 100 cm3 of diluted distillate containing the cyanogenic glycoside, 8.0cm3 of 6N NH4OH solution and 2.0cm3 of 5% potassium iodide were added. This was titrated against 0.02N silver nitrate (AgN03) solution using a 10cm3 microburette. The end-point was noted as a permanent turbidity against a black background. Titre values were obtained and used to calculate cyanide contents, using the formula: (mg) (CG)cyanogenic glycoside/100g
TV= Titre value (cm3); EV= extract vol(cm3) SM= sample mass (g) AL= alioquot (cm3) used N/B 1cm3 of 0.02N AgN03 = 1.8 mg HCN. The method described by Munro and Bassir (1969) was used for the determination of oxalate in the samples. In this method, 1.0g of each sample powder was extracted thrice by warming (40°C – 50°C) and stiring with a magnetic stirrer for 1 hour with 20cm3 of 0.3N HCl. The combined extracts were diluted to 100cm3 with water and used for the total oxalate estimation. For oxalate estimation, 5.0 cm3 of each extract was made alkaline with 1.0 cm3 of 5.0N NH40H. This was then made acid to phenolphthalein (2 or 3 drops of this indicator added, excess decolourizes solution) by drop wise addition of glacial acetic acid. 1.0 cm3 of 5% calcium chloride was then added and the mixture allowed to stand for 3 hours after which it was centrifuged at 3000 revolutions per minute (rpm) for 15 minutes. The supernatant was discarded and precipitates washed thrice with hot water with thorough mixing and centrifuging each time. Then to each tube 2.0 cm3 of 3N H2S04 was added and the precipitate dissolved by warming in a water bath (70°C – 80°C). The content of each tube was then titrated with freshly prepared 0.01N potassium permanganate solution. Titration was carried on at room temperature (29°C) until the first pink colour appeared throughout the solution and allowed to stand until the solution was colourless. The solution was then warmed to 70°C – 80°C and titration continued until a prink colour persisted for at least 30 seconds.
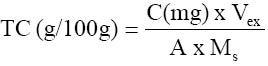
Where Mex = mass of extract (g) and Ms = Mass of sample used (g) Tannin was estimated by the method of Burns (1971). 0.5g of the sample powder was weighed into a conical flask and 100cm3 of distilled water added. This was gently boiled for one hour and then filtered using Whatman No 44 filter paper into a 100 cm3 capacity volumetric flask. The filter paper was washed with distilled water and the filtrate diluted to the 100 cm3 mark and then cooled. For the greenish-blue colour development, 50cm3 aliquot was put into each flask. This was followed by 5cm3 Folin – Dennis reagent, 10cm3 of saturated sodium carbonate solution and then diluted to the 100cm3 mark with distilled water. After thorough mixing, the flasks were allowed to stand in a water bath at 25°C for 20 minutes and the optical density measured at 700nm. Distilled water was used as blank regarding the calibration curve. Standard tannic acid solution were prepared from which a standard curve was made (absorbance versus concentration in mg/ cm3). From this curve, the concentrations for each sample was obtained and used for the tannin content calculation.
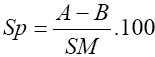
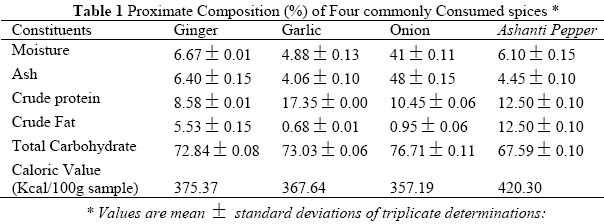
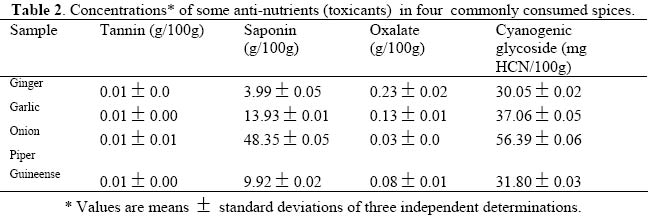
where C (mg) = concentration from standard curve; Vex = extract volume (cm3), A = aliquot (cm3) and Ms = mass of sample (mg) Saponin determination was done using the method of AOAC (1990). Saponin extraction was done using two different solvents. The first solvent, acetone, was used to extract crude lipid from the samples while the second solvent (methanol) was used for the extraction of the saponin proper. 2.0g of the sample was folded into a thimble and put in a Soxhlet extractor and a reflux condenser fitted on top. Extraction was done with acetone in a 250cm3 capacity round bottomed flask for 3 hours, after which the apparatus was dismantled and another 150cm3 capacity round bottomed flask containing 100cm3 of methanol was fitted to the extractor and extraction was carried on for another 3 hours. The weight of the flask was taken before and after the second extraction in order to make the change in weight. At the end of the second extraction, the methanol was recovered by distillation and the flask was oven-dried to remove any remaining solvent in the flask. The flask was then allowed to cool and the weight of the flask taken. Then, where A = mass of flask and extract ; B = mass of empty flask. SM =sample mass The calorific values (Kcal/100g sample) of the samples were calculated using the Atwater factors of 4,9,4 for protein, fat and carbohydrate, respectively, as reported by Onyeike et al (1995). Statistical Analysis:Means and standard deviations were calculated for three independent determinations for each variable except for total carbohydrate, which was simply obtained by difference. RESULT AND DISCUSSION The proximate compositions (on dry weight basis) and the calorific values of the samples studied are given in Table 1. The moisture content of the samples ranged from 3.41% in onion to 6.67% in ginger. The highest value of all the parameters determined was the total carbohydrate composition. This ranged from 67.59% in Ashanti pepper to 76.71% in onion. The lowest concentration of crude fat was recorded in garlic (0.68%) while Ashanti pepper had the highest concentration of 12.50%. This does not, however, portray Ashanti pepper as an oil seed. All the samples had and protein concentrations below 20%. These ranged from 8.65% in ginger to 17.35% in garlic. Onion had Onion had the highest concentration of ash (8.48%) as compared to garlic which had the lowest ash concentration of 4.06%. The samples were found to be good sources of carbohydrates only, but poor sources of ash, protein and fat. The highest calorific value of 420.30kcal/100g was recorded in Ashanti pepper, followed by 375.3 kcal/100g in ginger. Onion had the lowest calorific value of 357.9 kcal/100g. The calorific values seem to be controlled by the fat concentrations in the sample. Table 2 shows the concentration of some anti-nutrients (toxicants) in the spices studied. All four samples had tannins, saponins, oxalates and cyanogenic glycosides. Tannin concentration was the lowest of the anti-nutrients determined. Tannin levels in all four samples was about 0.01g/100g. Onion had the highest concentration of saponin (48.35g/100g) while the least concentration of 3.99g/100g occurred in ginger. The samples had oxalate contents ranging between 0.03g/100g in onion and 0.23g/100g in ginger. The levels of cyanogenic glycosides ranged from 30.05mg HCN/100g in ginger to 56.39mg HCN/100g in onion. The proximate composition of the spices garlic, ginger, onion and Ashanti pepper revealed them to the poor sources of proteins, fat and ash, but good source of carbohydrate. The crude fat content of Ashanti pepper was not high enough to be called an oil seed. This may be why these samples are used as mere spices and not as sources of nutrients. These explanations and findings agree with the definition of spices as mere food adjuncts, used to give piquancy to tasteless food dished up in the home cafés and restaurants (Dziezak, 1989). Thus they serve mainly to add flavour, aroma and taste to food and dishes. The moisture, crude protein, crude fat, total carbohydrate and ash concentrations obtained in this work for ginger are comparable to the values reported in the Encyclopedia of Chemical Technology (1980) (6.9%, 8.6%, 6.4%, 72.40% and 5.7%, respectively) for dry ginger powder. The values for crude lipid/fat and crude protein obtained in this work are also in agreement with those reported by Meadow (1988) (15.21% and 8.39%, respectively). The variation in the values for carbohydrate in this work and that reported by Meadow (1988), (67.21%) for ginger may be due to the fact that in this work total carbohydrate was determined while Meadow (1988) determined available carbohydrate. The values obtained for the proximate composition of garlic powder in this work are in agreement with the values obtained in the analysis of garlic powder done at Research 900 Laboratory as reported in the Encyclopedia of Chemical Technology (1980) (moisture, 5.4%; protein, 17.5%; lipid, 0.6% and total carbohydrate 73.3%). The crude fat/lipid and crude protein concentrations obtained for onion in this work are also in agreement with the values reported in the Encyclopedia of Chemical Technology (1980) (10.6% and 0.8%, respectively). Ashanti pepper has not attracted international attention and interest, hence there is dearth of information on its chemistry, except the crude fat concentration and essential oil content. However, the value of the crude fat content obtained in this work agreed favourably with that reported by Dosunmu and Ochu (1995) (12.01%). All four samples had relatively low calorific values. This may be why they are used mainly as food adjuncts and not as nutrients sources. Phytochemical screening revealed that all four spices had tannin, saponin, and oxalate, and cyanogenic glycosides. The low tannin content of the spices could be responsible for the absence of any bitter taste in the samples. The oxalate content (0.03g/100g – 0.23g/100g) of the spices were very much lower than those reported by Dommang et al (1987) for eight vegetables (6.90g/100g – 13.90g/100g dry matter) and are unlikely to pose toxicity problems to man, since they are much below the toxic levels, of 2-5g stated by Munro and Bassir (1969). The cyanogenic glycoside levels in the spices, ginger and Ashanti pepper are lower than the 36mg/kg body weight dose considered lethal to man. The levels in garlic and onion are above the 36mg/kg body weight dose considered lethal to man but safety resides in the fact that processing and cooking markedly reduces this principle rendering them safe for human use (Ebana et al,1995). Saponins have been shown to possess, both beneficial (cholesterol – lowering) and deleterious (cytotoxic; permeabilization of the intestine) properties (Price, et al, 1987; Oakenful and Sidhu, 1989). The levels of saponin in the samples studied in this work are quite low to cause any deleterious effects. Although saponin was found to be high in onion, processing may reduce it to a non-toxic level. More research is required on the isolation, structural determination, quantitative and biological effects of saponins in a wide range of Nigerian food spices and medicinal plants, especially the species fed to domestic animals (Onwuka, 1992). Although some saponins have been shown to be highly toxic under experimental conditions, acute saponin poisoning in relatively rare both in animals and man (Osagie, 1998). The present study has provided some biochemical information on the proximate, antinutrient and calorific contents of the spices, ginger, garlic, onion and Ashanti pepper. Their proximate compositions portray them as poor sources of nutrients, hence they are used mainly as food adjuncts. They are also revealed to possess very low levels of the anti-nutrients, tannin, saponin, oxalate and cyanogenic glycosides, which may be reduced to a non-toxic level by processing, thus rendering safe for human use. REFERENCES
The following images related to this document are available:Photo images[ja05028t1.jpg] [ja05028t2.jpg] |
| |||||||||
