 |
| About Bioline | All Journals | Testimonials | Membership | News |
|
||||||
|
||||||
Journal of Applied Sciences & Environmental Management, Vol. 9, No. 1, 2005, pp. 177-185 Multivariate analyses of heavy metals in soils and Colophospermum mopane leaves around the Selebi Phikwe nickel-copper mine and smelter/concentrator plant area, Botswana GEORGES-IVO E. EKOSSE*1, J. CATHERINE NGILA2, NTONGHANWAH FORCHEH3 1X-Ray Diffraction Unit, 2Chemistry
Department, 3 Statistics Department, University of Botswana, P/Bag
0022, Gaborone, Botswana Code Number: ja05034 ABSTRACT: This study was conducted in order to
ascertain levels of concentrations and areal distribution of heavy metals in
the surface soils and vegetation around the Selebi Phikwe Ni-Cu mine and
smelter/concentrator plant, Botswana. One hundred and forty samples each of soil and colophospermum
mopane leaves obtained from ten sites, were analyzed by atomic absorption
spectrometry (AAS) technique for their concentration levels of Cu, Ni, Fe, Cr,
Co, Cd, Zn and Se. Data analysis was done mainly using the statistical package
for social science (SPSS). Multivariate analysis was used to determine the
distribution of metals within the study area. Concentration values obtained for
analysed soil samples were as follows: Cd ranged from 0.01 to 0.05 ppm; Co
from 1.0 to 28 ppm, Cr from 0.03 to 14 ppm; Cu from 11 to 116 ppm; Fe from 31 to
430 ppm; Ni from 19 to 120 ppm; Se from 0.01 to 0.03 ppm, and Zn from 17 to 68
ppm. The concentration values obtained for analysed mopane leaves were as follows:
Cd was between 0.01 and 0.05 ppm, Co ranged from 1.0 to 28 ppm; Cr from 0.03 to
11 ppm; Cu from 4 to 116 ppm; Fe from 31 to 430 ppm; Ni from 19 to 120 ppm; Se
was between 0.01 and 0.03 ppm, and Zn was between 17 and 79 ppm. In general
heavy metals concentrations in both soils and vegetation depended on the site
and proximity of the sampling locations to the mine. The findings of the study
depicted that concentrations of heavy metals in soils and leaves of colophospermum
mopane decreased with increase in distance from the mine and
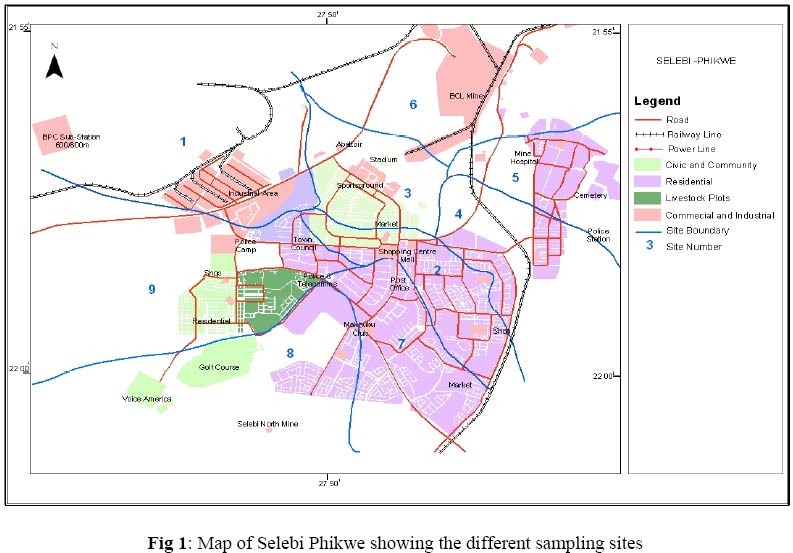
smelter/concentration plant. @JASEM Selebi Phikwe is located geographically between longitudes 27o 47’ East and 27o 53’ East, and latitude 22o 55’ South 22o 00’ South. Its soils are classified as Eutric Regosols and Haplic Luvisols according to the Soil Mapping and Advisory Service Project (1990) for Botswana. The soil mineralogy of the study area has been established in a separate study by Ekosse et. al. (2003). Its vegetation is savanna type, covered with mopane, Colophospermum mopane and a variety of acacia species namely the Acacia Karoo, Acacia galpinti, and Acacia tortilis (Timberlake et al., 1993). Earlier studies at Selebi Phikwe were directed at understanding the geology (Brown, 1987; Gallon, 1986), and mineralogy (Nkoma and Ekosse, 1998; 1999; 2000) of the orebodies. Recently, studies, which are of environmental concern at the study area, included the environmental mineralogy of the soils (Ekosse et. al., 2003), environmental chemistry and mineralogy of the particulate air matter (PAM) (Ekosse et. al., 2004), and the mineralogy of the tailings dump (Ekosse et. al., 2004a). However work has not been reported on effects of mining on vegetation in the area. In this study, multivariate analytical techniques were used to understand the distribution of heavy metals due to mining and processing of Ni-Cu ore bodies on the soils and Colophospermum mopane within the study area. Materials and methods Sampling and samples: Ten sites, which included a chosen control site located 56 km from Selebi Phikwe were identified for sampling. The soil lithology and vegetation of the control site were similar to those of Selebi Phikwe. The sampling sites (except the control site) are presented in Figure 1. Sampling was done twice monthly from January 2000 to July 2000. Samples of soil and mopane leaves were obtained as close to one another as possible. Samples were collected from soils and mopane leaves on each of the fourteen field visits. A total of 140 samples each of soils and vegetation were obtained. Random (Jewell et al., 1993) and judgmental (Crépin and Johnson, 1993) techniques were used in obtaining soil samples from sampling sites at each of the fourteen field visits. Grab soil sampling method (Tan , 1996; 1998) was used to obtain the samples with the aid of a trowel. Soil samples were taken at a depth of between 0 cm and 20 cm. Each sample was placed in a 20 cm x 30 cm polythene bag and transported to Gaborone where it was put in an oven at 60 °C overnight for surface soil moisture to escape. Mature dark green leaves with leaf diameter between 4 cm to 8 cm of Colophospermum mopane were harvested at the sampling sites for laboratory analyses. Between 10 and 12 leaves depending on the leaf diameter, which constituted a sample set, were sampled per sampling area. The samples were transported to Gaborone for processing and analyses. Samples were aerated for one week or more, until there was an escape of leaf moisture. Laboratory analyses: The methods for analysis of the different chemical parameters for soil have been mentioned in Van Reeuwijk (1993). Elements associated with Ni-Cu mining and smelting included Cd, Cr, Co, Cu, Fe, Ni, Se and Zn, which were likely to be found in Ni-Cu orebodies and possibly released into the physical environment were analysed. Ionic concentrations of Cd, Cr, Co, Ni and Se present in extracts of the samples were determined using a Varian Spectra AA 400 plus Atomic Absorption spectrometer with a Zeeman Graphite Tube Atomizer (GTA) 96. Ionic concentrations of Cu, Fe and Zn were measured with a Varian Spectra AA 10 Flame Atomic Absorption Spectrometer (FAAS). The procedure for the determination of the concentrations of heavy metals used in this study was adapted from both Beach (1989) for the Zeeman GFAAS and NIOSH (1995) manual of analytical methods for FAAS depending on the analyte being analyzed. Statistical analyses: Statistical analysis sought to establish the most prevalent metals in soils and in leaves as well as their uptake by plants. The relationship between metal concentration at a site and the distance of the site from the contamination source was also determined in order to establish the rate of decay of contamination away from contamination site. Pearson product moment and Spearman rank correlation coefficients (Miller and Miller, 2000) were used to examine the nature and strength of association between metal concentration in soils and leaves and distance from contamination sites. It was hypothesised that significant negative correlations would be indicative of contamination effect of the mine while non-significant or positive correlations would indicate that the mine was not an important source of the metal in the soil or leaves. For determination of rank correlations, sites were first ranked according to their distances from the mine. Hence site 10 (the control and farthest site was ranked 1) while site 6, the nearest site was ranked 10. These ranks were denoted as y = (Y1, Y2, … Y10)’ where Yi is the rank of the ith site from the mine. For ith heavy metal ( I = 1,…8), the sites (j = 1, …10) were again ranked according to the mean concentration of that heavy metal at the site. The vector of ranks for the ith heavy metal was xi = (Xi1, X i2, …, Xi10)’, where Xij = k if the rank of the concentration of the ith metal at site j is k. The rank correlation coefficient for the ith metal was the spearman rank correlation between the elements of vector y and those of xi. Similar correlation analyses were also used to evaluate the degree and nature of the association between concentrations in leaves and soils at the same site. An alternative measure of agreement was computed based on the percentage agreement of metal contamination to distance from the mine multiplied by the ranking of the concentration of a given metal at a given site which corresponded to the ranking of the distance of the site from the contamination source. Multivariate analysis was done to establish the relative closeness of the ten study sites based on the metal concentrations, and to relate this to the actual distances between them. Multidimensional scaling and cluster analysis techniques (Krzanowski, 1988, Mardia et al., 1979) were used for this purpose. For both techniques, Euclidean distances based on descriptive summaries (mean, minimum, maximum and standard deviation) of the concentration of each metal in samples analysed at each site. RESULTS
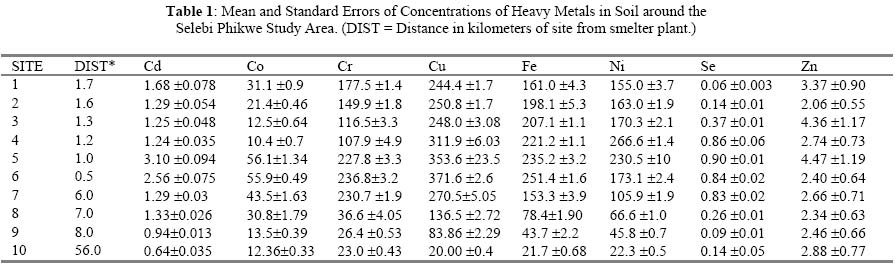
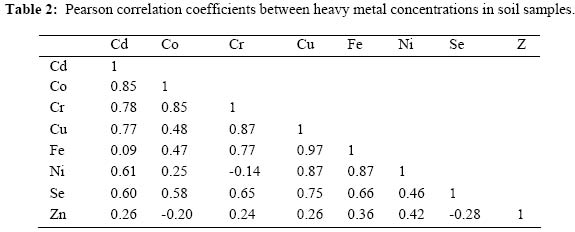
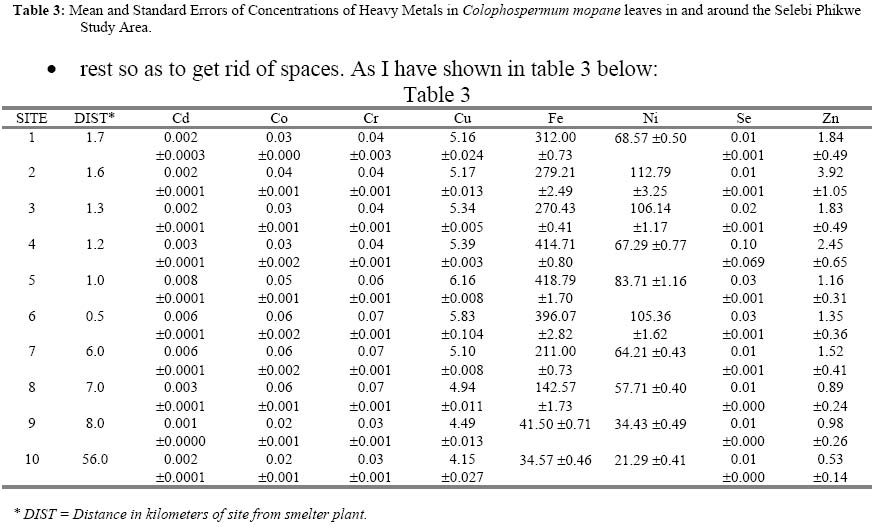
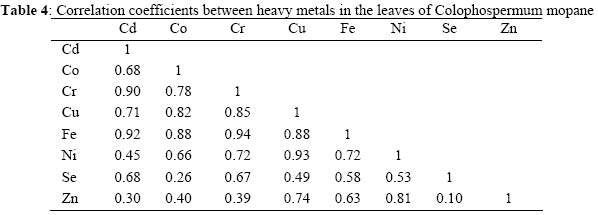
Soils: Concentration values obtained for analysed soil samples were as follows: Cd ranged from 0.01 to 0.05 ppm; Co from 1.0 to 28 ppm, Cr from 0.03 to 14 ppm; Cu from 11 to 116 ppm; Fe from 31 to 430 ppm; Ni from 19 to 120 ppm; Se from 0.01 to 0.03 ppm, and Zn from 17 to 68 ppm. The mean concentration values and their standard errors are shown in Table 1. The lowest concentration values occurred at Site 10, the control site. For example the lowest mean concentration for Cd is 0.640 (site 10) with a standard error of 0.0347. The next lowest concentrations were found at site 9, which was the furthest experimental site from the smelter/concentrator plant. The mean concentration of Cd at site 9 (mean = 0.940; standard error (SE) = 0.0134). The highest mean concentrations were either at site 5 or at site 6, which were the nearest sites to the smelter/concentrator plant. Therefore, soil sites 4, 5 and 6 which were close to the plant were the most contaminated, while site 10, 9 and 8 which were furthest away from the plant were the least contaminated. The product moment correlation coefficients between concentrations of different metals in soil samples are shown in Table 2. These correlation coefficients depicted very good associations for more than 50 % of the relationships. For example, very strong correlations included Co/Cd, Cr/Cd, Cr/Co, Fe/Cr, Fe/Cu, Ni/Cu, and Se/Cu. The lowest correlation coefficient was -0.14 between Ni and Cr, followed by -0.2 for Zn/Co. These low negative correlation coefficients were not significantly different from 0. Mopane leaves: Concentration values obtained for analysed mopane leaves were as follows: Cd was between 0.01 and 0.05 ppm, Co ranged from 1 to 28 ppm; Cr from 0.03 to 11 ppm; Cu from 4 to 116 ppm; Fe from 1 to 430 ppm; Ni from 19 to 120 ppm; Se was between 0.01 and 0.03 ppm, and Zn was between 17 and 79 ppm. The mean and standard errors of concentration values of heavy metals in leaves are shown in Table 3. The lowest concentration values occurred at the control site and at sites furthest away from the plant, as was the case with soil samples. The variability in Cd and Se concentrations are very low, with standard errors falling lower that 0.001 at many sites. The leaves close to the smelter/concentrator plant (sites four, five and six) were the most contaminated. The product moment correlation coefficients between concentrations of different metals in leaves are shown in Table 4. The
correlation coefficients between heavy metals in plants reflected very good
associations for more than 75 % of the relationships. Very strong correlations
included Cr/Cd, Cr/Co, Cu/Cd, Cu/Co, Cu/Cr, Fe/Cd, Fe/Co, Fe/Cr, Fe/Cu, Ni/Cu,
Ni/Fe, Zn/Cu and Zn/Ni. The lowest correlation coefficient was at 0.1 with
Zn/Se. The correlation coefficient values for Se/Co, Zn/Cd and Zn/Cr were
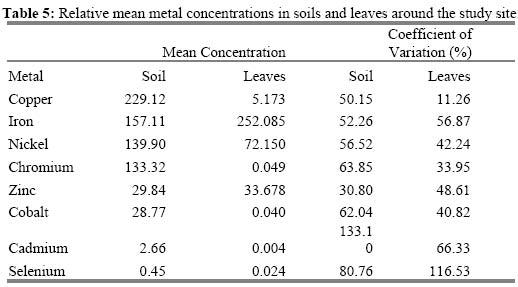
same. Statistical results: Further analysis of metal concentrations
in
samples of soils and leaves at various sites revealed that Cu had the highest
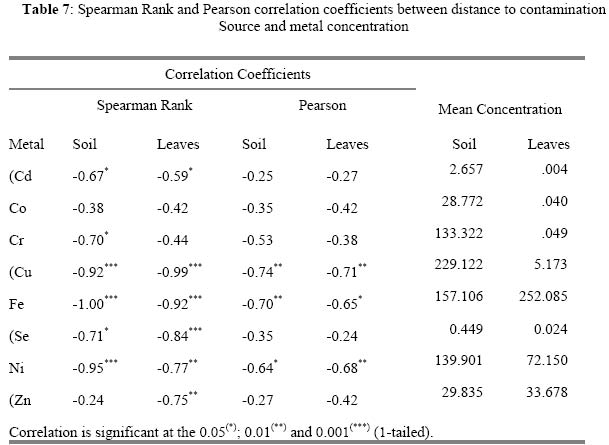
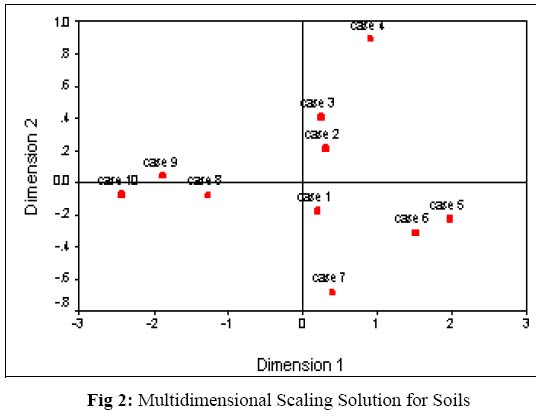
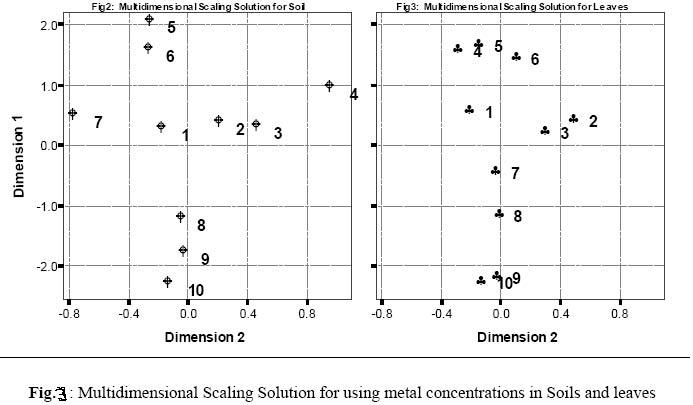
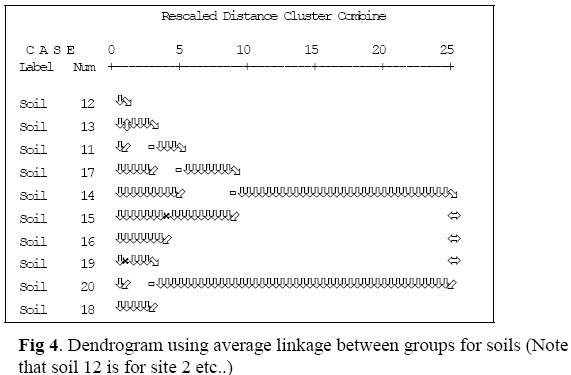
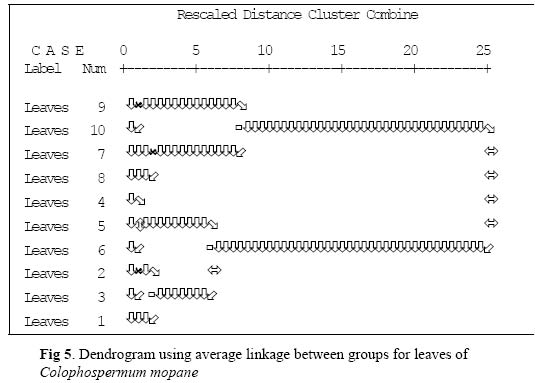
concentration in the soil ( Copper concentration in leaves is low ( Table 6 depicts the correlation coefficients between the concentrations of each metal in soil and in leave samples. The correlation coefficients are not significantly different from 0 for Cd and Zn, suggesting that their presence in soils and leaves may be entirely natural and not due to mining. However, as shown in Table 7, the concentrations of Cd (in soils and leaves) and Zn (in leaves) are related to distance from contamination source, although the relationships are not linear. Very strong associations are observed between concentrations of Cu and Fe in soils and leaves, and moderate associations are observed for Ni, Co and to some extent, Se and Cr. Table 7 shows the rank correlations and product moment correlation coefficients between concentrations of different metals and distance to smelter plant. The associations between metal concentration and distance to smelter plant are shown in Table 7. The concentrations of heavy metals are inversely related to distance from contamination site for all the eight metals, with stronger associations generally between concentrations in the soil than in the leaves. The strongest associations are found for Fe, Ni and Cu. Higher correlations are found using the spearman rank correlation than using the Pearson correlations. In particular, Pearson correlations are insignificant for Cd, Co, Cr, Se and Zn (Table 7). This suggests that the relationship between metal concentration at a site and distance of the site from the smelter plant is strongly monotonic (metal concentration decreases as distance increases) but not linear (rate of decrease is not linear). The results further suggest that the amount of contamination with Cd, Co, Cr, Se and Zn in soil and leaves increases with nearness to the source of contamination, but the increase is not enough to upset the natural amounts of these metals in the soils or leaves. Multivariate Analysis: The multidimensional scaling (MDS) solution in soils (Fig 2) based on analysis of summary statistics obtained at each site shows that the similarity between the sites based on overall metal concentrations are quite similar to the actual situation on the ground (see Fig 1). In particular, the separation of sites along the first MDS dimension is quite similar to the separation in terms of closeness to the contamination site. Sites 10, 9 and 8 are the furthest while sites 6, 5 and 4 are the closest to the contamination site. These sites are furthest apart along the first MDS dimension. Sites 1, 2, 7, and 3 which are close to the contamination site all cluster around the centre of the first dimension, and the relative differences between them are again captured through the second MDS dimension, with the sites 3, 2, 1 and 7 in exactly the same order as their relative distances from the contamination site. Hence not only has the MDS based on summary statistics of samples obtained at the different site proved very adequate in reproducing the relative closeness of sites to the contamination site, it also confirms that the presence of these metals in soils is directly linked to the contamination site. The MDS solution on leaf samples appears to be very effective in revealing relative similarities of sites based on metal concentrations in leaves as well (Figure 3). Once again, sites 10, 9 and 8 are at one extreme relative to site 6, 5 and 4. However, the ordering of site is not as marked as with soil samples, indicating that though contamination plays a major role in overall metal concentrations in leaves, it is not the only dominant source of metal presence in leaves. This is particularly the case with Fe and Zn as shown in Table 5. Fig 4 depicts the analysis of soil samples using average link hierarchical clustering method and Euclidean distance as measure of similarity. A strong separation exits between sites 1 to 7 and sites 8, 9 and 10. The cluster analysis solution for soil samples is remarkably similar to the MDS solution, with sites 1, 2 3 (here labelled 11, 12, 13) grouping closely together, followed by sites 9, 10 and 8 (19, 20 and 18), with sites 7, 4, 5 and 6 forming more lose groupings with sites 1, 2 and 3. Evidently, the separation sites for leaves are not as clear-cut as that of soil samples (Fig 5). DISCUSSION
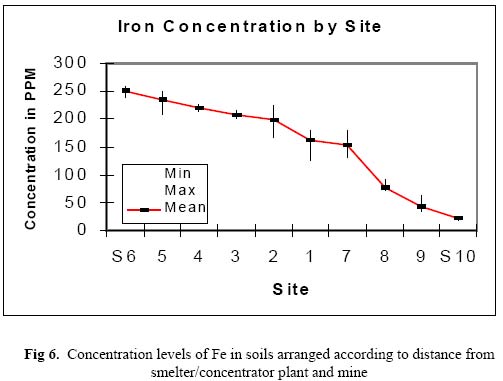
The soils close to the smelter/concentrator plant were enriched from wash-offs, and other wastes due to mining activities. Soils around the mining sites, and the smelter/concentrator plant at Selebi Phikwe presented a larger and higher range of heavy metal contents with decreasing proportionality as distance increased from the sources. This chemical phenomenon was documented by Bowles et al. (1998), for similar mining environments, namely at Sandbury, Canada. The nature of some of the polluting elements depended on ore processing, concentration of the noxious elements and residual materials being disposed off. The results of statistical analyses show that Cu in soils and in leaves both agree with distance from source of contamination, i.e the closer the site the higher the concentration. Iron shows 100% agreement in soils, but leaves show only 50% agreement. This suggests that other factors may be involved. A similar trend is observed for Ni, Cr and Cd. However, results for Zn show that there is no agreement between metal concentration and distance from source of contamination. This may suggest that levels of this heavy metal in either the soil or the leaves are not correlated with contamination. A possible explanation may be offered by the mechanism by which transformation of Zn occurs. Thus Zn may be transported from these sites or transformed into undeterminable forms. Interestingly, whereas there was 50% correlation between levels of Co in the leaves with distance from source of contamination, there was no correlation for its levels in soil. This may imply that there is a different mechanism of uptake of Co by the leaves. Both Cu and Se show the levels in the leaves to correlate better with distance from contamination source than the levels in the soil. Accumulation of heavy ions is more rapid in clear terrains than where vegetation cover is available (Berthelsen and Steinnes, 1995). The precipitates accumulated from constant leaching of ions of heavy metals emanating from tailings dump thereby causing the soils to be over saturated with heavy metals. In this regard, as vegetation was depleted due to the formation of dead zones, heavy metals concentrations in soils increased correspondingly. On the other hand, transportation and migration mechanisms of heavy ions favoured sandy soils compared to silty and clayey soils. The soils at Selebi Phikwe being predominantly silty with an average migration rate, heavy metals contamination could be detected as far as the control site (site 10) though at lower concentration levels. Conclusions: This study focussed on multivariate analyses of heavy metals concentrations in soils and leaves of colophospermum mopane occurring around the Selebi Phikwe Ni-Cu mine and smelter/concentrator plant in Botswana. The findings of the study depicted that generally levels of concentrations of heavy metals in soils and leaves of colophospermum mopane decreased with increase in distance from the mine and smelter/concentration plant as depicted in Figure 6 which shows the trend for Fe as an example. Soils were considered to be contaminated by heavy metals emanating from mining activities, and possibly from other sources. Mopane leaves were enriched with heavy metals from wash-offs, PAM, plant uptake from soils, and other wastes due to mining and smelting activities. REFERENCES
The following images related to this document are available:Photo images[ja05034t7.jpg] [ja05034f3.jpg] [ja05034f2.jpg] [ja05034t6.jpg] [ja05034f5.jpg] [ja05034t1.jpg] [ja05034f6.jpg] [ja05034f4.jpg] [ja05034f1.jpg] [ja05034t5.jpg] [ja05034t2.jpg] [ja05034t4.jpg] [ja05034t3.jpg] |
| |||||||||
