 |
| About Bioline | All Journals | Testimonials | Membership | News |
|
||||||
|
||||||
Journal of Applied Sciences & Environmental Management, Vol. 9, No. 2, 2005, pp. 15-21 Effect of Strong Electrolytes on Edible Oils Part 1: Viscosity of Sunflower Oil In 1,4-Dioxane at Different Temperatures 1A.RASHEED KHAN (R); 2SHAMA, REHANA SAEED; 2FAHIM UDDIN* 1Pakistani
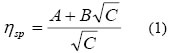
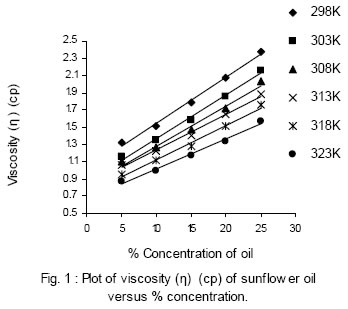
Council for Scientific and Industrial Research PCSIR Laboratories Karachi Code Number: ja05039 ABSTRACT The viscosity of sunflower oil in 1,4-dioxane used as a diluent in the presence and absence of strong electrolytes (HCl, NaOH, NaCl) at different temperatures (298K to 323K) was accomplished. The viscosity of sunflower oil was found to increase with the increasing concentration and decreased with the increase in temperature. It was further observed that viscosity of sunflower solution in 1,4-dioxane increases under the influence of electrolytes. The values of Jones-Dole coefficient A and B were evaluated. The positive values of B-coefficient increased with the rise of temperature. This led to conclusion that ion-solvent interactions increase and electrolytes such as HCl, NaOH and NaCl behave as structure breaker in sunflower-1,4-dioxane system. The change in the values of fluidity parameters such as (a, k, α1, α2, β, β*) with concentration of oil and temperature suggests that fluidity parameters are structural. The energy of activation (ΔEv), latent heat of vapourization (ΔLv) and molar volume of oil (Vm) were also calculated. Effect of electrolytes show that, the concentration of electrolytes increases the value of (ΔEv) and (ΔLv) whereas the value of molar volume (Vm) decrease with the concentration of oil and electrolytes. In brief, unsaturations of fatty acids of oil are responsible for the changes in the values of different parameters determined. The results for (ΔEv) and (ΔLv) are influenced by the concentration of sunflower oil. @JASEM The importance of oils and fats in human nutrition is well recognized (Salunkhe et al 1992). These form of vital components of many cell constituents are an important source of energy and act as a carrier of fat-soluble vitamins. Besides they contribute significantly as function of ingredients in improving the sensory characteristics of several process food products. The ingredients of oils are the glyceric compounds of glycols and fatty acids. They are usually triglycerides in which one molecule of glycerols has combined with three molecules of fatty acids with the elimination of three molecules of water. The three molecules of fatty acids are rarely of but one kind so that the glycerides are mainly mixed triglycerides. Monoglycerides may be present in fatty acids to varying percentage, diglycerides are more rarely present. Free fatty acids and unsaponificable matter e.g., sterols, fatty alcohols hydrocarbons coloring matter etc are also the part of fatty acids. The edible oils, which are in daily human use, include canola, soyabean, peanut, cottonseed, sunflower, mustard, palm oils etc. These edible oils are major energy source of the human and animal organism. The energy values of fatty acids depend on their chain length. It decreased with the reduction of carbon (C) atoms. C6-C8 fatty acids contain only 34 kJg-1 whilst 38 kJg-1 is obtained from the fatty acids containing C16-C18 atoms (Shama 2004). The main aim to revise the importance of edible oils for the use of human diet is to find out the effect of electrolytes likeHCl, NaOH and NaCl, which are some how the others are related to digestion of human food. What happens when these electrolytes come in contact with edible oils? The effectof these electrolytes is studied on the viscosities of oil solution as a function of electrolytes concentration and temperature. The viscosities are measured in 1, 4-dioxane. The oil selected, for this study is extracted from the seeds of sunflower. EXPERIMENTAL Material: 1,4-dioxane (BDH), HCl, NaOH, NaCl, oxalic acid of E. Merk were used without further purification. Oil of sunflower was extracted from dried and dehulled seeds. Sunflower seeds were bought from the local market in Karachi, Pakistan. Oil was extracted from washed, dried, dehulled and crushed sunflower seeds. Extracted oil was filtered and used without further purification. The density of oil at 298K was determined as 0.978 g.cm-3. Procedure: Experiments are accomplished to measure the viscosities and densities of oil solutions in 1,4-dioxane in the presence of electrolytes. Viscosities of oil solutions in 1,4-dioxane are measured at different temperatures ranging from 298K to 323K with the help of Ostwald viscometer. Temperature was kept constant through out the course of experiment with the help of a thermostatic water bath type (circulator model YCM-01, volt 230Ac, Hz 50, Amp 5). A known fixed volume of oil solution was taken in viscometer, temperature of the solution was maintained by placing the viscometer in the thermostatic water bath having a constant circulation of water. Densities of solvent and solutions were measured with the help of relative density bottle having a capacity of 10 ml by volume at different temperatures. Viscosities and densities were measured as a function of oil concentration, electrolytes concentrations and temperatures. Each measurement was recorded at least three times to ensure the reproducibility in the observations. RESULTS AND DISCUSSION Oil extracted from the seeds of sunflower is ensured from any impurity present in it. Density of this oil is measured at different temperatures by using relative density bottle. The density of oil changes slightly in the 3rd decimal place with temperature difference 5K shown in Table 1. It shows that oil is thick and volume of oil up to temperature 323K spreads slowly and changes in unsaturation occur. Viscosity of oil solutions (5-25%) is measured in 1,4-dioxane at different temperatures ranging from 298K to 323K with the help of Ostwald type viscometer. The results are summarized in Table 2 and shown graphically in Fig. 1. These results reveal that viscosity of oil increases with increase in concentration of oil and gets decreased as the mercury level rises in Fig. 2. Table 1. Densities of sunflower oil at different temperatures (K)
Table 2: Viscosities of sunflower oil in 1,4 –dioxane at different temperatures (K).
Table 3 includes the results obtained due to the effect of addition of HCl on the viscosity of oil solution in 1,4-dioxane. These results indicate that as the concentration of HCl increases, the viscosity of oil gets increased. But on comparison of these results with the viscosity obtained in the absence of electrolytes shows that the addition of HCl reduces the viscosity. Furthermore viscosities remained decrease with the rise in temperature. Similarly Table 4 illustrates the results obtained for the addition of NaOH in different concentration. These results show that the addition of NaOH in oil solution reduces the viscosity at all temperatures and electrolytes concentration. Table 3: Effect of HCl on viscosities (cp) of 5% sunflower oil solution in 1,4-dioxane at different temperatures (K)
The addition of NaCl Table 5 in the oil of solution (5%) decreases the viscosity at all concentration of NaCl and temperature ranges 298K to 323K. Hydrochloric acid (HCl) is more efficient in reducing the viscosity values of oil than obtained for NaOH and NaCl. According to the analysis [Williams 1966] based on hundreds of experiments, oil of sunflower consist mostly glycerides of oleic acid (25-42%), linoleic acid (52-66%) and saturated acid (5-13%). The change of viscosity at variable temperature in the presence and absence of electrolytes may be probably due to the unsaturation of ingredients present in the oil. Thermal effect activates radically the oleic and linoleic acids and as results of, the electrolytes attach to the glycerides of these fatty acids, which increases the movement of oil solution. Besides, the results are also analyzed by the variation in pH values. The value of pH of 1,4-dioxane is obtained as 5.15 and for the oil concentration of 5% (v/v) oil solutions in 1,4-dioxane, the pH reduced to 2.8. The change in pH reveals that the hydrogen ion concentration was increased by dissolving the oils in 1,4-dioxane [Shama 2004, Williams 1966, Adesun and Ipinmoroti 1999]. The same results were also obtained by titrating the oil solutions versus standard sodium hydroxide. As more volume of sodium hydroxide consumed to titrate the oil solution as compared to 1,4-dioxane, the electrolytes reduce the viscosities and when a strong electrolyte of acidic nature as hydrochloric acid (HCl) is added to the solutions it further decreases the viscosities. It may be due to the increase in uncoiling and increase in concentration of monomers and decrease in intermolecular interaction. Furthermore when NaOH is added to the oil solution, it is observed that with the increase in pH the viscosities are reduced as compared to the acidic medium as in alkaline medium oil molecules form the sodium salt of stearic acid. As a result the long chain association was decreasing, due to the decrease in intermolecular interactions (Falkenhagen and Dole 1929, Jones and Dole 1929, Blokhra and Kumar 1983, Das and Das 1983, Robson 1988, Saeed et al 2002). Table 4: Effect of NaOH on viscosities (cp) of 5% sunflower oil solution in 1,4-dioxane at different temperatures (K)
Table 5: Effect of NaCl on viscosities (cp) of 5% sunflower oil solution in 1,4-dioxane at different temperatures (K).
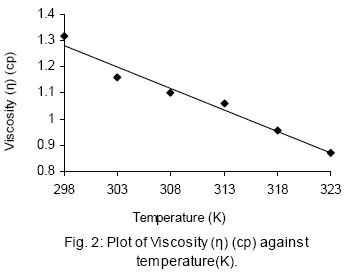
When a solute is dissolved in a solvent, two types of interactions take place ion-ion and ion-solvent interactions. According to Falkenhagen Theory (Falkenhagen and Dole 1929) in unperturbed solutions of electrolytic interactions to the viscosity of medium, each ion is associated with a spherically symmetric ionic cloud of oppositely charged shearing forces. These charged shearing forces generated under an applied linear velocity gradient cause the ionic cloud to deform from a spherical to an ellipsoidal from and Falkenhagen,s theory is neglected due to the incomplete dissociation and ion association. One can regard Jones-Dole equation (Jones and Dole 1929).
where ηsp is the specific viscosity, C is molar concentration and ‘A’ and ‘B’ are, respectively the intercept and slope of linear plots ηsp/√C versus √C. They are Jones-Dole coefficients representing ion-ion and ion-solvent interaction characterizing the behavior of electrolytes. Table 6: Ion- ion and Ion- solvent interactions of sunflower oil with 1,4-dioxane in presence of electrolytes at different temperatures (K).
Table 7: Fluidity parameters a, k, α1, β, α2, and β* of 5%(v/v) sunflower oil solution in 1,4-dioxane at various temperatures.
Table 8: Energy of activation (ΔEv) Latent heat of vapourization (ΔLv) and Molar volume (Vm) of sunflower oil in 1,4-dioxane.
The values of A and B-coefficient of Jones-Dole equation (Saeed et al 2002) are determined graphically from the intercept and slope of linear plots of ηsp/√C versus √C respectively Fig. 3. The values of A and B obtained graphically are shown in Table 6. The negative values of A-coefficient are obtained. We find variation in the values of A-coefficient, which show incomplete dissociation and ion association of electrolytes with sunflower oil in 1,4-dioxane system (Blokhra and Kumar 1983). For oil solution in 1,4-dioxane the negative values of A-coefficient generally decrease with the rise in mercury level. Some irregular variation in A-coefficient is observed for oil in the presence of sodium chloride (NaCl). The decrement in the values of A-coefficient with rise in temperature is due to the fact that A-coefficient depends on the stiffering effect of the space lattice. The effect is greater at low temperature because the space lattice is less distributed by heat variation. The increasing order of negative values may also be due to the greater thermal agitation at higher temperature and also due to the decrement of attractive forces (Das and Das 1983). This shows that Jones-Dole equation competes over Falkenhagen theory (Robson 1988), as in presence of electrolytes the solutions of oil in 1,4-dioxane have low values of A-coefficient (Jones and Dole,1929). The B-coefficient of Jones-Dole
equation represents the ion-solvent interaction. Temperature and composition
of solvent may affect the values of B-coefficient. Results show that the values
of
solute-solvent interaction in terms of B-coefficient are positive and increase
with the rise in temperature for oil solution in 1,4-dioxane system in the
presence of electrolytes. The increment in positive values with the rise of
temperature reveals that electrolytes behave as structure breaker in
1,4-dioxane. It should be noted that when B-coefficient increases with the
temperature, this indicates that viscosity decreases due to the solvent
structure. Distortion of solvent structure is small which results the positive
values of B-coefficient. It should also be noted that positive values of
B-coefficient if decreases with the rise in mercury level show structure making
in nature. Similar results are obtained for the sodium citrate solutions in
acidic aqueous methanol (Uddin et al 1989), lithium chloride and sodium
chloride in aqueous-butanol system [Khan et al 2003], Sodium chloride in
aqueous-methanol system [Khan et al 2002]. All these system show that both
ion-ion interaction and ion-solvent vary with this composition of solvents. The
positive values of B-coefficient decreased with rise in temperature led to the
conclusion that these electrolytes (NaCl, LiCl) in aqueous butanol mixtures
behave as structure maker where as in aqueous medium NaCl and LiCl showing
negative values of B-coefficient behave as a structure breaker.
Table 9: Effect of electrolytes on Energy of activation (ΔEv), Latent heat of vapourization (ΔLv) and Molar volume (Vm) of sunflower oil (5% v/v) in 1,4-dioxane.
Fluidity is important parameters, which concern with the structure in the viscous flow. Different relations of viscosities and volume are used to evaluate the fluidity parameters i.e, a, k, α1, β α2, and β*. These parameters are evaluated from the following relations (Adesun and Ipinmoroti 1999): log η = log k + a log Vo (2) η/Vo = α1 + β η (3) 1/Vo = α2/ η + β* (4) a, k, α1 , β, α2 and β* are empirical constant and they are structural parameters. The intercept and slope of logη versus logVo gives the values of ‘k’ and ‘a’. Similarly the value of fluidity parameters α1, β and α2, β* are evaluated from the slopes and intercepts of respective plots of η/Vo versus viscosity and 1/Vo versus 1/η. All the results are summarized in Table 7. The results show that the values of ‘k’ and ‘a’ gradually decrease with the rise of temperature suggesting that ‘a’ and ‘k’ are structural parameter. The values of parameter ‘α1’ decrease with increment of temperature revealing it dependent to be on viscosity whereas ‘β’ values negatively increase with the rise of temperature. Both ‘α1’ and ‘β’ are empirical constant. The values of α2 decrease with rise of temperature and β* values show negatively increase suggesting that α2 might be structural parameter. The values of energy of activation (ΔΕv), Latent heat of vapourization (ΔLv) and molar volume of oils (Vm) are calculated. The values of energy of activation (ΔΕv) and molar volume of oils (Vm) are calculated from the slope and intercept of the linear plot of logη versus 1/T respectively. The value of slope is used in determining the energy of activation (ΔΕv) by the following expression [Berry et al 1980, Atkins 1990]: ΔΕv = Slope × R x 2.303 (5) Whereas the Latent heat of vapourization (Lv) is evaluated from the relation: ΔΕv = 0.4 Lv (6) Similarly the molar volume of oil (Vm) is determined from the following expression: logVm = [ log h NA – C ] (7) here h, NA and C represents Planck’s constant, Avogadros number and intercept of plot of logη versus 1/T respectively. The results for the energy of activation (ΔΕv), latent heat of vapourization (ΔLv) and molar volume of oil (Vm) are illustrated in Table 8. The results show that the energy of activation (ΔΕv) and latent heat of vapourization (ΔLv) are influenced by concentration of oil. These parameters increase with the increment in concentration, the numbers of molecules of oil are greater and cause hindrance in the mobility of molecules. Furthermore the molar volume of oils (Vm) decreases with increase in concentration of oil. Effect of electrolytes Table 9 on these parameters show that the concentration of electrolytes increases the value of (ΔΕv) and (ΔLv) whereas the value of (Vm) decrease with the concentration of electrolyte. REFERENCES
The following images related to this document are available:Photo images[ja05039f1.jpg] [ja05039f2.jpg] [ja05039t1.jpg] [ja05039f3.jpg] | |||||||||||||||||||||||||||||||||||||||||||||||||||||||||||||||||||||||||||||||||||||||||||||||||||||||||||||||||||||||||||||||||||||||||||||||||||||||||||||||||||||||||||||||||||||||||||||||||||||||||||||||||||||||||||||||||||||||||||||||||||||||||||||||||||||||||||||||||||||||||||||||||||||||||||||||||||||||||||||||||||||||||||||||||||||||||||||||||||||||||||||||||||||||||||||||||||||||||||||||||||||||||||||||||||||||||
| |||||||||
