 |
| About Bioline | All Journals | Testimonials | Membership | News |
|
||||||
|
||||||
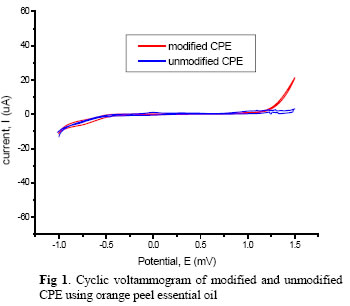
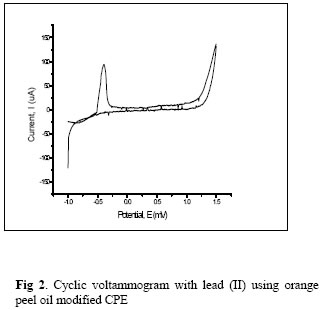
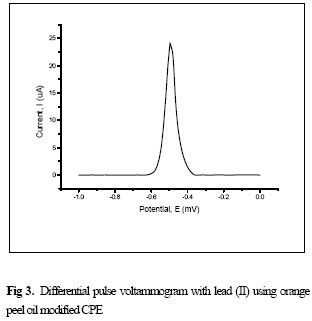
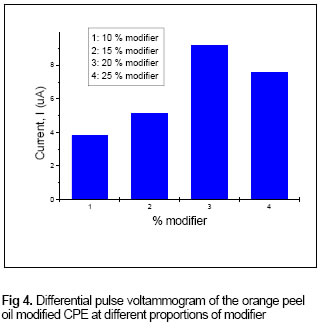
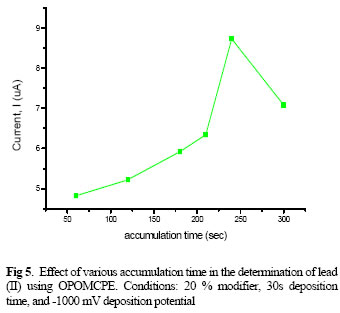
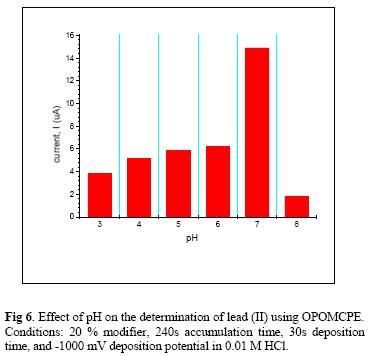
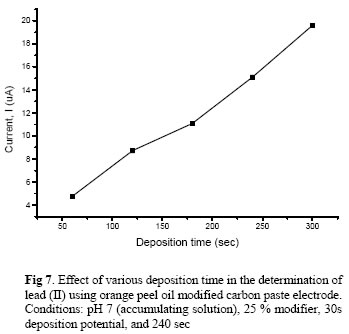
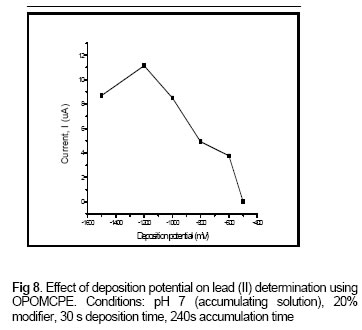
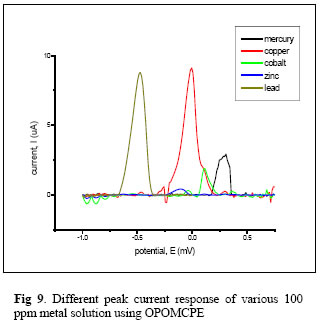
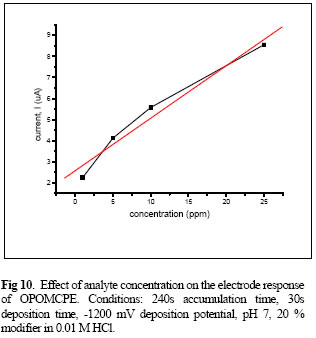
Journal of Applied Sciences & Environmental Management, Vol. 9, No. 2, 2005, pp. 23-27 Orange Peel Essential Oil as Component of a Metal Sensor for Lead (II) Ion Determination in Aqueous Solutions ROLANDO O. ELVIÑA, JR; ELMER-RICO E. MOJICA* Institute of Chemistry, College of Arts and Sciences, University of the Philippines Los Baños, Laguna 4031 Philippines *E-mail: elmericomojica@yahoo.com Code Number: ja05040ABSTRACT Orange (Citrus sinensis) peel, a waste material was used as source of essential oil that served as component of a sensor that detects the presence of lead (II) ions in aqueous solutions. The prepared sensor was investigated in evaluating its potential as a substitute for commercially available working electrodes. The electrochemical property of the prepared sensor was evaluated using cyclic voltammetry and differential pulse anodic stripping voltammetry. Optimization of different parameters was done for possible application of the sensor as a rapid method for lead analysis of aqueous environmental samples. @JASEM Citrus essential oil is present in small ductless gland contained in the peel of the Citrus fruits. The five main types of citrus from which peel oils are recovered commercially are orange, grapefruit, tangerine, lemon, and lime (Braverman, 1979). Citrusessential oil is derived from the peel of Citrus sinensis and usually produced by both cold expression (hand or machine) and distillation in vacuum. Sweet orange oil is a yellow to red-brown liquid with a distinct aroma of oranges. Its physical constants differ according to origin, season, and method of extraction. The main constituent of orange peel essential oil is d-limonene (present to the extent of at least 90 %), which is the only hydrocarbon present. The d-limonene is extracted from orange rinds or solids. The rinds and pulp are sent to an evaporator and the d-limonene is steamed out. It is widely known for it's pleasant scent and degreasing properties. d-limonene is currently being used in many applications such as chlorinated solvents replacements, hand cleaners and sewage treatments (Creaser et al. 1992). However, the principal odoriferous constituent of the orange peel essential oil is n-decyclic aldehyde, which was believed to be the only aldehyde present then until capraldehyde and citral have been identified. The alcohols d-linalool and n-nonylic are found in orange peel essential oil in the free state and most probably in the form of esters of formic acid, acetic, capric, and caprylic acids (Matthews et al. 1987). For applicability as sensors of heavy metals, the component used must have sufficient affinity for the analyte or the target metal. Yamashita et al. (1990) proposed a generalized theory on the basis of metallic interactions in host molecules. They concluded that a metal complexes with or has affinity for a shell of hydrophilic groups, such as atomic groups of oxygen, nitrogen, or sulfur, which is in turn imbedded within a larger hydrophobic shell, such as organic carbon groups. The orange peel essential oil fits this model well, with the hydrophilicity provided by the numerous oxygenated group and the hydrophibicity, by d-limonene which constitute 95% of the oil mass. This study was done with the intention of using orange peel essential oil as component of a sensor that detects heavy metal particularly lead (II) ions. The essential oil used that came from a waste material was used to determine lead ions, an environmental pollutant. MATERIALS AND METHODS The binding component for lead (II) ions used in this study was the essential oil from orange (Citrus sinensis) peel, which was obtained from a market stall in CalambaCity, Laguna. To get the essential oil, the orange peel was subjected through steam distillation where in approximately 200 grams of orange peel was cut in fine pieces, mixed with distilled water and placed in a round bottom flask. The steam distillate, composed of aqueous and organic layer, was collected and separated through the use of a separatory funnel. The organic layer, which was the desired product, was stored in a dry clean glass vial and was stored in a refrigerated temperature to avoid volatilization of the oil. The essential oil was mixed with carbon powder and mineral oil to form a paste, which was packed into the end of a hard plastic tube (with a thickness of 2 mm diameter) where a copper rod was inserted to establish electrical contact. The fabricated orange peel essential oil modified carbon paste electrode or the sensor that was prepared was then used as the working electrode in a 3-electrode cell connected to a Metrohm 693 VA processor where all voltammetric measurements were carried out. The processor was interfaced to a personal computer via an RS232 connection, which converts the generated data into ASCII format. The data obtained was processed using Microcal Origin version 5. A platinum auxiliary electrode and Ag/AgCl reference electrodes were used. All potentials were measured against the Ag/AgCl electrodes. The sensor was immersed in lead (II) standard solution at a preconcentration cell with constant stirring at open circuit. The electrode was then taken out of the preconcentration solution, rinsed with water and transferred to the voltammetric cell containing 0.01 M hydrochloric acid solution acting as a supporting electrolyte. Cyclic voltammetry (CV) was performed using the sensor with and without the orange peel essential oil in 0.01 M HCl. A potential range from -1000 to 1500 mV and a scan rate of 100 mV/s was employed. Cyclic voltammetry of the sensor accumulated with lead (II) ions was also performed. Optimization of parameters like accumulation time, pH of preconcentration solution, electrode composition, deposition time and deposition potential was done using differential pulse adsorptive stripping voltammetry (DPASV). RESULTS AND DISCUSSION The cyclic voltammogram of the sensor with and without the orange peel essential oil is shown in Fig 1. CV is not practical for quantitative analysis; however, it is a useful tool for redox systems. Result shows that the fabricated sensor is inactive at the potential range of –1000 to 1500 mv using a Ag/AgCl reference electrode. Hence, it can be inferred that during the analysis of lead ions, any signal that comes out of it is due to the metal (lead ions) itself. The cyclic voltammogram of the prepared sensor dipped in lead (II) ions solution is shown in Fig 2. A well-defined peak at –600 to -400 mV region indicates the oxidation of lead. Figure 3 shows the differential pulse anodic stripping (DPASV) voltammogram of the prepared sensor after lead (II) accumulation. A sharp, well-defined, and symmetrical peak was observed at –600 to –400 mV range. Thus, it can be ascertained that the orange peel oil as a binding component of the sensor can be used to analyze lead (II). The effect of increasing amount of orange essential oil in the sensor was analyzed. A maximum current response was obtained for a sensor containing 20 % orange peel essential oil by weight (Fig 4). Increased proportion of essential oil incorporated more binding sites available for metal attachment on the sensor surface. On the other hand, a decline in current response at large percentage of the binding component owes to deterrence of electrical conductivity. The decrease may be attributed to the decreasing amount of the carbon powder. Carbon is one of the components of the semsor and is responsible for its conductivity. Decreasing the amount of the carbon powder will decrease the conductivity of the sensor. Accumulation time is the time allowed for the lead (II) ions to accumulate on the sensor surface from a stirred analyte solution. As the accumulation time increases, the peak response also increases at a certain point and then levels off after continuous immersion (Fig 5). The peak height increases with accumulation time because of the increases in the metal ion concentration at the sensor surface but only up to the time when all the binding sites have been occupied. This saturation point is the maximum metal ion concentration at the electrode surface. This maximum concentration is then followed by a decline at the metal concentration adsorbed at the sensor surface. The voltammograms show that the optimum accumulation time for the sensor is 4 minutes. The optimum pH for the determination of lead using the fabricated sensor is 7 (Fig 6). The pH obtained for the sensor is in agreement with an experiment conducted by Dempsey et al. (1992) wherein lead was determined through voltammetry. Moreover, this result is in the range of pH that Gardea-Torresday (1988) specified in their investigation. According to them, lead is classed among the metals that are tightly and rapidly bound at pH > 5 and stripped at pH < 2. The voltammogram also showed that at pH higher than 7, the peak current decreases. The decrease in the current response of the electrode at higher pH is due to the formation of the hydroxylic lead complexes that inhibit lead accumulation on the electrode. On the other hand, the low peak current at low pH values can be explained by the protonation of the weakly basic coordinating groups at the surface of the modified electrode (Ramos et al. 1993). In addition to that, acidic media is not a good accumulating solution. Increasing intensities of peak current from pH 3 to pH 7 could be due to the concentration of protons on the accumulating solution. Acidic pH results in an increase in peak current, since the protons ability to displace lead from the binding positions is added to the ability of the the essential oil to form complexes with lead (II). Deposition time is the time required to convert Pb2+ to Pb0 while imposing a sufficiently negative potential to effect the reaction. The graph of the fabricated sensor showed that as the deposition time is increased, the current peak response also increases. This relationship is observed because more time is allotted for the reduction of the metal. The longer the time is for the reduction, the more cations will be reduced onto the sensor surface. Since more metal cation is reduced onto the surface of the sensor, an enhanced peak current was obtained due to an increased amount of metal cations that was stripped from the sensor surface. Ensuing that more metal cations were reduced would subsequently give an improved peak current. The deposition potential effect on the voltammetric determination of lead using the sensor was also investigated. The voltammogram showed that the peak current is enhanced as the potential is made more negative. This trend can be explained by the fact that it takes a longer time to scan towards the more negative potential. The longer it takes to scan towards the more negative potential the more lead ions are reduced to their metallic form. And the more lead ions reduced the higher the concentration of lead that will stick to the sensor surface, consequently resulting in a higher peak response. Higher peak response means more sensitivity for the lead ions There is a linear relationship between the peak current and deposition potential. Based on the voltammogram, it can be gleaned that the potentials -1500 and -1200 will actually give the same current response but due to some experimental errors, the peak current response for -1500 decreased. Therefore, the optimum deposition potential for fabricated sensor is -1200 mV. The most significant potential advantage of the sensor preconcentration is the opportunity that the binding component-analyte interaction affords for greatly enhanced sensitivity. In order to present a direct interference in such a determination, a sample component must fulfill two requirements. First, the interfering species must be able to react with the binding component to a sufficient extent that it is preconcentrated along with the analyte of interest. And, second, the interferent must posses a redox potential close enough to that of the analyte that overlapping voltammetric waves occur for the two deposited species (Baldwin et al. 1986). All the metals tested showed a current response signal on their potential region using the prepared sensor. The presence of these metals may interfere with the analysis of lead (II). Based on the current intensities, copper (II) could be the major interference on lead (II) determination in terms of competition on binding sites of the sensor. It can also be seen that the binding component could be selective towards lead alone, by limiting the potential window from –1000 mV to –250 mV. Increasing the analyte concentration results in increasing peak height. As expected, the lead (II) ion concentration and current peak response have a linear relationship. This trend is observed because increasing the lead concentration in the solution increases the analyte availability to the sensor surface. A calibration curve was made from the voltammogram obtained using lead (II) solutions having concentrations of 1 to 25 ppm. The linearity coefficient obtained for the sensor is 0.98264 (Fig 10). The concentration obtained by AAS analysis of a laboratory waste sample containing various heavy metals was calculated to be 52.38 + 0.11 mg L-1 while the data obtained using the prepared electrode was 10.45 + 0.32 mg L-1. The values obtained for lead content using the prepared electrodes were much lower compared to that of the AAS method. DPASV can only determine the lead that is in the lead (II) form. On the other hand, AAS detects the whole lead content. The large difference in AAS and DPASV results can also be due to the presence of interferences. It was found in this study that the modifier used was not selective towards lead (II) alone. The orange peel essential oil can also detect other metals such as Cu (II), Co (II), Cd (II), Zn (II), and Hg (II). Aside from the peak in the lead (II) region, there is also a distinct peak in the Cu (II) region. Copper which can compete effectively with lead (II) for the available binding sites on the electrode surface may also cause the large difference in the results using the two methods. REFERENCES
Copyright 2005 - Journal of Applied Sciences & Environmental Management The following images related to this document are available:Photo images[ja05040f10.jpg] [ja05040f5.jpg] [ja05040f9.jpg] [ja05040f7.jpg] [ja05040f4.jpg] [ja05040f2.jpg] [ja05040f8.jpg] [ja05040f1.jpg] [ja05040f6.jpg] [ja05040f3.jpg] |
| |||||||||
