 |
| About Bioline | All Journals | Testimonials | Membership | News |
|
||||||
|
||||||
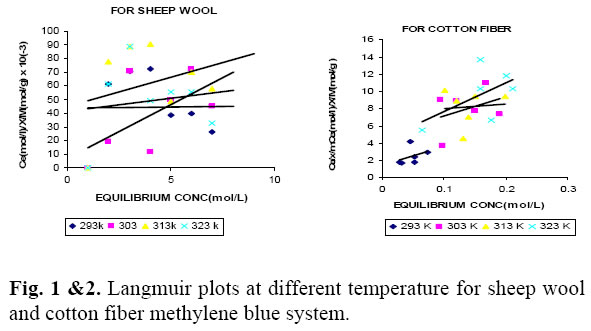
Journal of Applied Sciences & Environmental Management, Vol. 9, No. 2, 2005, pp. 29-35 Adsorption of Methylene Blue from aqueous Solution on the Surface of Wool Fiber and Cotton Fiber A. RASHEED KHAN, HAJIRA TAHIR, FAHIM UDDIN*; UZMA HAMEED Department of Chemistry, University of Karachi-Pakistan.E-mail: Fahim_uddin01@Yahoo. Com Code Number: ja05041 ABSTRACT Adsorption of dye methylene blue from aqueous solution on the surface of sheep wool and cotton fibers was accomplished under the optimize conditions of temperature, concentration, pH, stay time duration and quantity of adsorbent. Spectrometric technique was used for the measurements of concentration of dye before and after adsorption. The percentage removal and distribution constant (KD) values for the removal of of methylene blue were also calculated. The values of % adsorption data for methylene blue – sheep wool system show better adsorption capacity as compared to methylene blue – cotton fiber system. The applicability of Langmuir and Freundlich adsorption isotherm equations for the present system was also tested. The experimental data are fitted to the Langmuir and Freundlich isotherm equations. The values of their corresponding constants were determined from the slope and intercepts of their respective plots. Thermodynamic parameters like ΔG°, ΔH° and ΔS° were calculated on the basis of Langmuir constant K. The methylene blue – sheep wool system show non spontaneous and exothermic behavior, while methylene blue – cotton fiber system show spontaneous and endothermic behavior. The results of these investigations suggested that natural adsorbents can be utilized as adsorbent materials, because of their selectivities for the removal of dyes. @JASEM Global village is facing many issues regarding industrial pollution. Textile, leather, food, agro industries have brought enormous atmospheric changes. The alarming question is the disposal of effluent discharged by these industries. The basis of ISO-14000 is mainly for the disposal of residual contents of these industries. But unfortunately the industries are lacking some where in following the procedure recommended for this purpose. The effluent from textile industries is a big question mark, which has created environmental problems around urban areas. The dyes present in the effluent discharged by textile industries are first to be treated for the separation of dyestuff and then send to disposing end. An attempt has been made in this connection. Earlier adsorption of methylene blue and malachite green from aqueous effluent on the surface of wool carbonizing waste is reported [Khan et al 2004]. This method is found useful for this purpose but it is more efficient for the effluent containing methylene blue. In this paper results obtained spectrophotometerically were discussed in the form of Langmuir and Freundlich isotherms. This present work deals with the adsorption of methylene blue from aqueous solution on the surface of natural adsorbent. The concentration of dye was determined spectrophotometrically on the basis of relation between absorbance and concentrations. Percent adsorption before and after treatment gives the amount of dyestuff separated from effluent. The results are treated using the Langmuir and Freundlich isotherms. The values of activation energy, enthalpy change and entropy change were also evaluated. EXPERIMENTAL Preparations of adsorbents: The sheep wool fiber and cotton fiber were used as the natural adsorbent, which are collected from the natural resources. Cotton is very sensitive crop used as a fiber, which is easily available. Sheep wool fiber was obtained from sheep. Both fibers were washed thoroughly with hot water to remove impurities associated with them and then dried in air under shade. MATERIAL Potassium chloride, sodium acetate, citric acid, sodium citrate, acetic acid and hydrochloric acid of analar grade were used and methylene blue of BDH were used. Preparations of buffers: Buffers of pH 1, 2 (HCl-KCl) , pH 3 (citric acid – trisodium citrate), pH 4.5 (sodium acetate- acetic acid) and pH 6 (citric acid-trisodium citrate) were prepared in double distilled water. Stock solution of methylene blue (M.W. 374 ) of strength 1x 10⁻² was prepared in double distilled water. For the determination of λmax of methylene blue, the solution of 1×10⁻⁵ mol. dm-3 strength was prepared. The absorbance was measured on spectrophotometer (ERMA AE- 200). The value of λmax due to methylene blue was observed as 665 nm. Effect of Amount of Adsorbent: In order to find out optimum amount of adsorbent at which maximum adsorption takes place, 30ml of 6×10⁻⁶ mol. dm-3 of dye solution for sheep wool fiber , 3 ×10⁻⁶ mol. dm-3 of dye solution for cotton fiber system was taken. The dye solution of pH 5 for (sheep wool fiber), 3.5 for (cotton fiber) was added in the column packed with different quantity of adsorbent e.g. 0.3, 0.4, 0.5, 0.6, 0.8, 1.0……1.50 g. The solution of dye was kept stand for 20 minutes for (sheep wool fiber) and 10 minutes for (cotton fiber). The results are shown in Table 1. Table 1: Optimization for the amount of adsorbent in the adsorption of aqueous solution of methylene blue (MB) on the surface of sheep wool fiber and cotton fiber.)
Concentration of adsorbate = 6×10⁻⁶ mol. dm-3 (Sheep wool fiber), 3×10⁻⁶ mol. dm-3 (Cotton fiber) , Volume of adsorbate =30ml , Time= 20 minutes (Sheep wool fiber), 10 minutes (Cotton fiber) pH = 5.0(Sheep wool fiber), 3.5 minutes (Cotton fiber) Table 2: Optimization for the concentration of methylene blue in the adsorption of methylene blue from aqueous solution on the surface of sheep wool fiber and cotton fiber for 3 hours
Amount of adsorbent = 0.5g , Volume of adsorbate =30ml , pH = 5.0 (Sheep wool fiber), 3.5 (Cotton fiber) Effect of Concentration of Adsorbate: For this study eight columns with 0.5g of adsorbent were prepared. The pH of methylene blue was maintained as 5.0 (sheep wool) , 3.5 (cotton fiber) and time 3h. The results are summarized in Table 2. Effect of Stay Time:For the determination of the effect of time on the adsorption of dye, 0.5g of adsorbent was packed in each column and 30 ml of 6×10⁻⁶ mol. dm-3 dye for (sheep wool fiber), 3×10⁻⁶ mol. dm-3 dye for (cotton fiber) at pH 5.0 and 3.5 for cotton and sheep wool fiber respectively were added in the column for different intervals of time. When the solution of dye comes in contact with heterogenous surface of adsorbent, as usual unsaturated part of the dye strikes the surface of the adsorbent for adsorption. It was observed that the adsorption of dye increases with increasing in time to 30 minutes and reaches to maximum value and then attains a constant value when adsorption equilibrium is reached. In methylene blue on sheep wool fiber maximum adsorption occurs in 30 minutes as 82.50% whereas in cotton fiber the maximum adsorption occurs in 10 minutes as 72.0%. The results are tabulated in Table 3. Effect of pH: The influence of pH for the adsorption of dye was observed. For this purpose six experiments at different pH for each dye were accomplished. 30 ml of 1×10⁻⁵ mol. dm-3 solution of methylene blue carrying variable pH (1.0 to 6.0) was added in different columns packed with 0.5g adsorbent. Time period for both adsorbent was 3 hours. The results are depicted in Table 4. Effect of Temperature: For the determination of the effect of temperature on the adsorption of dye under optimize adsorption conditions, the adsorption process was proceeded at 293-323 K temperatures at the step of 10 K ± 0.2 °C Table 3: Optimization for the stay time in the adsorption of methylene blue from aqueous solution on the surface of sheep wool fiber and cotton fiber
Amount of adsorbent = 0.5g , Volume of adsorbate =30ml , Concentration of adsorbate = 6×10⁻⁶ mol. dm-3 (Sheep wool fiber), 3×10⁻⁶ mol. dm-3 (Cotton fiber) , Time= 20 minutes (Sheep wool fiber), 10 minutes (Cotton fiber) pH = 5.0(Sheep wool fiber) and 3.5 (Cotton fiber) Table 4:Optimization for the pH in the adsorption of methylene blue from aqueous solution on the surface of sheep wool fiber and cotton fiber for 3 hours
Amount of adsorbent = 0.5g , Volume of adsorbate =30ml , Concentration of adsorbate = 1×10⁻⁵mol. dm-3 Time= 3h METHOD 6 to 13 wide mouth column packed with optimize weight of adsorbent (0.2g, 1.5g sheep wool and cotton fiber respectively) were arranged. Known quantity of dye solution of specific strength (6±×10-6 mol. dm-3 , 3±×10-6 mol. dm-3 for sheep wool and cotton fiber) were added in the column and left stand for (20 and 10 minutes for sheep wool and cotton fiber ) duration. After required time the filtrate was obtained and % absorbance of a portion of filtrate was determined spectrophotometrically at 665 nm. The % absorbance of dye before and after adsorption on the surface of adsorbent gives this quantity of dye separated from aqueous solution. During the process of adsorption after a shorter or longer period equilibrium was established between molecules in the bulk and adsorbed phases. This is the adsorption equilibrium. It is dynamic equilibrium because the number of molecules leaving the surface per unit time is equal to the number of newly adsorbed molecules; the total number of molecules in the adsorbed state remains constant. RESULTS AND DISCUSSIONSAdsorption of dye methylene blue, cationic in nature was studied on sheep wool and cotton fiber under the optimize conditions of amount of adsorbents, adsorbate, stay time, temperature and pH. The results are summarized in Tables 1, 2, 3 and 4. Concentration of dye before and after adsorption is determined by spectrophotometerically using calibration curves methods. For determining the effect of adsorbent on the adsorption of methylene blue from aqueous solution on sheep wool fiber and cotton fiber nine experiments for each fiber system were accomplished. Concentration of adsorbate, time and pH for sheep wool fiber respectively were 6×10⁻⁶ mol. dm-3, 20 minutes and 5 respectively whereas the parameters for cotton fiber were 3×10⁻⁶ mol. dm-3 , 10 minutes and 3.5 respectively. The results (Table 1)indicate that maximum adsorption takes place as 94.3% at 1.0g of sheep wool fiber and 97% at 1.50 g of cotton fiber. The distribution constant (KD) values at this amount of adsorbent are 31.40. The minimum adsorption occurs at 0.2g adsorbent as 50.6%. The equilibrium concentration is 0.116 mol/L. On the other hand the maximum adsorption of dye was observed as 97% at 1.5g cotton fiber and Ce as 0.259 mol/L. The value of KD at this amount of adsorbent is 19.40 where as minimum adsorption takes place at Ce and adsorbent respectively as 0.046 mol/L and 17.2%. The value of KD is 20.6. These results show optimization for the amount of adsorbent occurring at 1.0g sheep wool fiber and 1.5 g cotton fiber. Over all adsorption for both fibers are random. Somewhere adsorption increases and thus abruptly drops. It shows that methylene blue show better affinity towards sheep wool fiber. But in the adsorption of methylene blue and malachite green on the surface of wool carbonizing waste, the maximum adsorption takes place at 0.6g wool carbonizing waste as 98.7% and for malachite green this value is 99.1% at 2.0g adsorbent. At 1.0g adsorbent (wool carbonizing waste) the percent of adsorption of methylene blue was obtained as 83.3% whereas for malachite green the %adsorption was determined as 93.7. The difference in % adsorption of these dyes on the surface of wool carbonizing waste, wool fiber and cotton fiber may be due to the presence of more or less irregular and defective edges. These edges play significant role on the adsorption phenomenon. These edges strike the unsaturated part of the dye and accelerate the removal of dye molecules (Khan et al, 2002, Tahir etal, 2003). These types of observations were also observed in the adsorption of organic acids on the surface of finely divided charcoal (Khan etal 1991, 1994). The effect of dye concentration on adsorption was carried out under the optimized conditions of pH (5 for sheep wool and 3.5 for cotton fiber), amount of adsorbent (0.5g), volume of adsorbate (30ml) and stay time (3h). The results are summarized in Table 2. For sheep wool fiber, the adsorption in general increases with increase in concentration of dye but it drops (%35.6) when concentration reaches to 5×10⁻⁶ mol.dm-3. But abruptly gets increased (71.6%) at 6×10⁻⁶ mol.dm-3 and then drops. The maximum and minimum adsorption occurs respectively at concentrations 6×10⁻⁶ mol.dm-3 and 5×10⁻⁶ mol.dm-3. The values of KD are random through out the system. In the case of cotton fiber, the maximum adsorption (84.4%) occurs at concentration 3×10⁻⁶ mol.dm-3 whereas minimum adsorption (57.7%) takes place at the concentration 6×10⁻⁶ mol.dm-3. Also, in this system the values of KD are random. There is no regularity found in the %adsorption and as well as in values of KD. But in the case of adsorption of methylene blue on carbonising waste, the maximum adsorption occurs at 3×10⁻⁵ mol.dm-3 concentrations as 98.7%. On the other hand the % adsorption 69.9 was obtained at 7×10⁻⁶ mol.dm-3 concentrations. It shows that wool fiber works better than carbonizing waste (Khan et al 2004). Table 3 illustrates the adsorption of dye at different duration. Maximum and minimum adsorption of dye from aqueous solution on sheep wool fiber takes place respectively in 20 minutes (Ce 0.336 mol/L, % adsorption 84.9) and 50 minutes (Ce 0.324 mol/L, % adsorption 75.1). On the other hand for cotton fiber, the maximum and minimum adsorption occurs in 10 minutes (Ce 0.192 mol/L, % adsorption 72.0) and 60 minutes (Ce 0.052 mol/L, % adsorption 19.4). The values of KD for both adsorbent are random. There is no regularity found in both cases. But maximum adsorption of methylene blue on wool carbonizing waste takes place in 40 minutes as 97.8 whereas malachite green adsorbs in 30 minutes as 94.7 % [Khan etal 2004]. On comparison wool fiber is better adsorbent than cotton fiber. Table 4 includes the result obtained from the adsorption of dye at different pH. The maximum and minimum adsorption respectively, occurs at pH 5 (%81.9) and pH 3 (%21.4) for sheep wool fiber where as maximum and minimum adsorption is due to cotton fiber respectively takes place at pH 3.5 (%59.60) and pH 3 (%14.70). Maximum and minimum adsorption occurs in the units of pH 3 and 3.5. Therefore for all subsequent studies initial pH was adjusted by using buffer solution of pH 5 and 3.5. The values of KD were also found random in both systems. It was already reported in the earlier paper (Khan etal 2004) that the maximum adsorption of methylene blue on wool carbonizing waste occurs as 97.2 % at pH 5 whereas the maximum adsorption of malachite green is observed as %82.2 at pH 5. When dye solution comes in the vicinity of adsorbent the action of partial forces at the boundary of surface of adsorbent accelerate at pH 3.5 (cotton fiber) and pH 5 (sheep wool fiber) hence maximum adsorption takes place. These results also support that sheep wool fiber is better adsorbent than cotton fiber. In brief when a pure liquid is placed in contact with solid, the state of affairs at the interface between solid and the liquid will be different from that in the interior part of the liquid because of molecule or ions of the solid now replace the molecule of liquid, the force acting on the liquid molecule transferred alter and this alternation results in an increase in the concentrations of the liquid at the interface as compared with intentions of liquid. The liquid may be adsorbed at the surface of the solid but adsorption is obvious much less than in solid gaseous system. The number of molecule, which will be adsorbed at a surface of solid or liquid from solutions, will be directly proportional to the concentration. During the period of adsorption after a shorter or longer duration, equilibrium established between molecules in the bulk place and adsorbed phase. For better understanding, the phenomena of the adsorption, when aqueous solution of methylene blue comes in contact with cotton or woolen fiber, the unsaturated part of methylene blue strikes the irregular or defective edges of adsorbent, the separation of methylene blue molecules starts rapidly in the initial stages. It is because by striking the molecules of methylene blue with irregular edges of adsorbent, radicals are formed and methylene blue molecules get started to join adsorbent surface hence thick layer of dye is formed on the surface of adsorbent. Wherever the open surface of adsorbent is found available, striking of ionic dye molecules would take place and helps in the separation of dye molecules. Amount of adsorbent, concentration of adsorbate, pH and stay time will together influence on the rate of adsorption. It is very clear to observe that there will be no regular increase or decrease of rate of adsorption. Maximum adsorption will depend upon the conditions stated above. The reason is not clear why it happens. Our laboratory experiences note that there will be random rate of adsorption. Some time at the early stages the maximum adsorption takes place rapidly and some time it does not happen. There are many references found in the literature for this phenomenon (Khan, 1987, Khan etal 1985, Coover, 1964). It should be necessary to note that the polar ends of the dye molecule have a tendency to attach themselves to the active sites of cotton or woolen fiber surface. Dye molecules speedly join the heterogeneous surfaces of fibers and hence dye separates out from aqueous solution. Many theories of adsorption have been put forward to explain the phenomena of adsorption. Langmuir and Freundlich isotherms are some of them. The well known Langmuir equation (Langmuir 1918) is given below. (Cs / X/m) = (1/ kVm) + (Cs / Vm) …(1) Where X/m explains the amount of adsorbate per unit mass of adsorbent, Cs is the equilibrium concentration of adsorbate in solution, Vm is the monolayer capacity or surface area of the solid and K indicates the binding constant which is related to the heat of adsorption. A straight line is obtained by plotting Cs/(X/m) Vs. Cs. The slope and intercept of this plot respectively are 1/Vm and 1/ (kVm). Experiments were accomplished at different temperatures. The plots are shown in Figs. 1 and 2 whereas these results are summarized in Tables 5 and 6. The decrease in k (Langmuir constant) values with the rise in temperature indicates weakening of adsorbate - adsorbent interactions at high temperature whilst the increase in K values predicts strong interaction. It reveals that the adsorption affinity of dye decreases with the rise in temperature. So adsorption is less favorable at high temperature (Saleem etal 1994, Ge-hui etal 1999). All the adsorption systems obey Langmuir adsorption isotherms equations except at 313K temperature [Hameed 2004]. . The monolayer capacity (Vm ) decreases with increase in temperature indicating high affinity of cationic dye at low temperature (except at 293K). So when dye molecules strike a part of this uncovered surface of the adsorbent at that moment the separation of dye from aqueous solutions and adsorption on adsorbent starts and ends when a thick layer is formed. The values 1/Vm and 1/KVm are random. Considering the concentration of dye if 1/K increases with decrease in concentration of dye, it means that at the high concentration dye molecules (Khan etal 2002) will utilize more surface area. On the other hand if the value of 1/KVm gets decreased with decrease in the concentration of dye then the strength of adsorption of K of dye on the surface of fibers will be increased with decrease in the concentration of dye. Table 5: Langmuir parameters of methylene blue -sheep wool fiber
Table 6: Langmuir parameters of methylene blue dye – cotton fiber
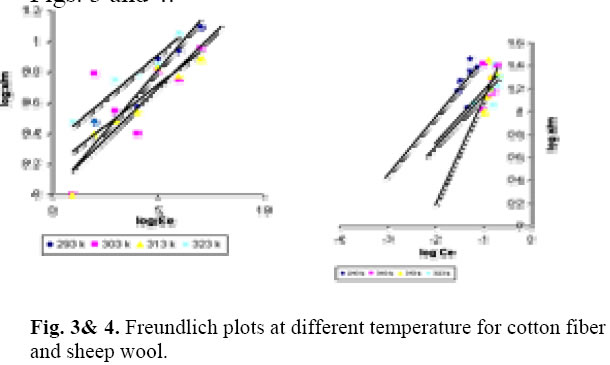
The linear form of Freundlich isotherm (Adsmson 1960} may be written as Log X/m = log K +1/n log Cs …(2) Where X/m is the amount adsorbed per gram of the adsorbent Cs is the equilibrium concentration and log K and 1/n are Freundlich constants. A plot of log X/m against log Cs gives a straight line. The slope and intercept of which corresponds to 1/n and log K respectively. The values of these constants are summarized in Tables 7 and 8 and plots are shown in Figs. 3 and 4. The parameters K and 1/n obtained from this isotherm give a measure of adsorbing capacity of the adsorbent and the intensity of adsorption respectively. The decrease in the values of K with rise of temperature reveals that adsorption affinity of methylene blue decreases with rise in temperature showing less adsorption favorable at high temperature. Both parameters (K and 1/n) are obtained random for both fibers. Table 7: Freundlich parameters of methylene blue dye- sheep wool fiber
Table 8: Freundlich parameters of malachite green dye- cotton fiber
Tables 9 and 10 include the values of thermodynamic parameters such as free energy (ΔG°), enthalpy (ΔH°) and entropy (ΔS°) of adsorption which were calculated from the Langmuir constant ‘K’ using the following relation: ΔG° = -RT ln K …(3) ln K = -ΔHo / RT + Constant…(4) Table 9: Thermodynamic parameters of methylene blue dye-sheep wool fiber system
Table 10: Thermodynamic parameters of methylene blue dye-cotton fiber system
The ΔHo and ΔSo were calculated from the slope and intercept of the linear variation of ln K with reciprocal of temperature (1/T). The values of ΔG° at different temperatures are negative except at 313K. This indicates a positive behavior in the case of methylene blue- cotton fiber system whereas in the case of wool fiber these values are positive in all cases except at 303K temperature. The positive value of ΔG° predicts spontaneous behavior. The values of ΔH° and ΔS° in methylene blue- cotton fiber system were found positive whereas the values are negative for methylene blue- sheep wool system which indicates respectively endothermic and exothermic behavior respectively. All the results obtained for methylene blue - sheep wool system show best adsorption capacity as compared to methylene blue – cotton fiber system at high temperatures. Tables 11 and 12 show the values of % removal at different temperatures for both systems. Methylene blue – sheep wool system shows best adsorption capacity as compared to the Methylene blue – cotton fiber system at high temperatures. Table 11: % Removal of methylene blue dye-sheep wool fiber system at different temperatures
Table 12: % Removal of methylene blue dye-Cool fiber system at different temperatures
REFERENCES
Copyright 2005 - Journal of Applied Sciences & Environmental Management The following images related to this document are available:Photo images[ja05041f3-4.jpg] [ja05041f1-2.jpg] | ||||||||||||||||||||||||||||||||||||||||||||||||||||||||||||||||||||||||||||||||||||||||||||||||||||||||||||||||||||||||||||||||||||||||||||||||||||||||||||||||||||||||||||||||||||||||||||||||||||||||||||||||||||||||||||||||||||||||||||||||||||||||||||||||||||||||||||||||||||||||||||||||||||||||||||||||||||||||||||||||||||||||||||||||||||||||||||||||||||||||||||||||||||||||||||||||||||||||||||||||||||||||||||||||||||||||||||||||||||||||||||||||||||||||||||||||||||||||||||||||||||||||||||||||
| |||||||||
