 |
| About Bioline | All Journals | Testimonials | Membership | News |
|
||||||
|
||||||
Journal of Applied Sciences & Environmental Management, Vol. 9, No. 2, 2005, pp. 37-42 Using GIS to understand the environmental chemistry of manganese contaminated soils, Kgwakgwe area, Botswana GEORGES EKOSSE1*; PAUL S. FOUCHE2 1*X-Ray
Diffraction Unit, Faculty of Science, University of Botswana,
P/Bag 0022 Gaborone, Botswana ekossege@mopipi.ub.bw Code Number: ja05042 ABSTRACT This study aimed at establishing the spatial distribution of manganese (Mn) and iron (Fe) within the periphery of a manganese oxide (Mn oxide) ore abandoned mine. Four hundred soil samples were obtained from a 4 km2 area close to the Kgwakgwe Mn oxide ore abandoned mine, Kanye, South eastern Botswana. The determination of Fe and Mn concentrations after acid digestion of samples was performed on a Varian Spectra AA-220 FS atomic absorption spectrometer (Varian, Australia) equipped with a deuterium background correction.Laboratory results were processed using Geographical Information Systems (GIS), and Remote Sensing (RS) techniques with the integrated Land and Water Information System (ILWIS), Geosoft Oasis Montaj and ArcGIS software packages. Microsoft Excel was used for statistical and graphical presentation of data analyses. The range of concentration levels of Fe in soils was from 1116 μg g-1 to 870766 μg g-1 with a mean of 17593 μg g-1 and for Mn in soils was 35 μg g-1 to 24907 μg g-1 with a mean of 1088 μg g-1. The gridded soil maps for Fe and Mn show anomalies in different parts of the study area. Where Mn is high, the Fe is low and vice versa. Manganese was high at the mine workings and in the northwestern part of the study area. Iron on the other hand is very low in the mine working area and is high on the northern part of the study area. Suggestions are advanced for the Mn interplay in the soils and environment around the Kgwakgwe abandoned Mn oxides ore mine. @JASEM Kgwakgwe, the study area, is within the periphery of Kanye township, the capital of the southeastern District, Botswana. Kanye is one of the few major towns/cities of Botswana with a current population of over 65 000 inhabitants(National Census, 1991). Kgwakgwe is located 4 km south of Kanye township, in the southeastern part of Botswana. Kgwakgwe is located between latitudes 24°59' and 25°02', and longitudes 25°17' and 25°20'. The soil types at the study area do vary with changes in topographic elevations and underlying rocks. The ferric luvisols and calcic luvisols are associated with lowland areas having ephemeral streams. The soils are characterised as moderate, moderate-well to well drained, brown to yellowish brown sandy loam to sandy clay soils (Mitchell, 1976; Reemelwaal A. (1988). They overlie the granitic, rhyolitic and doleritic rocks of the Basement Complex and dolerite intrusions. The soils at Kgwakgwe could be contaminated with Mn and Fe from the Mn oxide orebodies. The Mn content in soils is derived from the parent materials, and usually the element is associated with Fe because of their ability to isomorphically substitute one another in the crystal lattice structure of minerals. Manganese (Mn) occurrences at Kgwakgwe hill are associated with goethitic ochre and kaolin (Ekosse and Mulaba-Bafubiandi, 2003; Ekosse and Nkoma, 2002; Lanzincka, 1992). Minerals of Mn occur within the Kgwakgwe Shale of the Neoarchaean Transvaal Supergroup (Lanzincka, 1992; Ekosse and Modisi, 1999). Both the goethitic ochre and kaolin have never been mined for any known economic applications (Ekosse and Modisi, 1999). Manganese mining, which started in 1957 (Aldiss et. al, 1989), has been suspended over two decades ago. Previous studies carried out at Kgwakgwe area focused on origin of the Kgwakgwe Chert Breccia (Modisi, 1995), manganese oxides (Mn oxides) as evidence for shallow aqueous palaeo-environment (Ekosse and Vink, 1998), provenance of argillaceous sediments (Ekosse, 2001; Ekosse and Shemang, 2002), and the geology and mineralogy of the manganiferous, ferruginous and argillaceous sediments (Ekosse and Vink, 2001). Due to limited high grade quality and associated high cost of mining, the exploitation of Mn oxides was suspended. However, the abandoned mine workings have not been rehabilitated. During mining of Mn ore, a lot of anthropogenic activities were carried out to the extent that aeolian, aquatic and terrestrial distribution of the mineral covered a wider area than the mining premises. Consequently, concentration levels of Mn in soils within susceptibly contaminated areas may have increased. A need therefore to fully understand the spatial distribution of Mn and Fe, and as determinant factors for contamination of surrounding soils by Mn was necessary. No known studies have so far been conducted to appraise the Mn mining impact on the surrounding surface sedimentary environments. This study aimed at investigating the concentration levels of Mn and Fe in the soils occurring at Kgwakgwe in an attempt to determine their spatial distribution. METHODS AND ANALYTICAL TECHNIQUESSampling: Sampling was done over a period of one month, and there were two sampling areas, which included a chosen control site located 4 km south of the study area. The X and Y coordinates of sampling points for soils were obtained, and gridded on the satellite image. The control site had an area of 900 m2 (300 m X 300 m). This control site was chosen because it was at the other side of a paleotopographic barrier where Mn mineralisation has not occurred (Ekosse and Vink, 1998). The soil lithology and vegetation cover of the control sampling site were very similar to those of Kgwakgwe area. Detailed soil grid of 2 km X 2 km was established. Soil samples were taken at 100 m intervals. To make the grid a base point of known location was marked.Gridding is an interpolative method used to create a two dimensional surface of distribution of point data. Point interpolation is performed on randomly distributed point values to create a raster map in which each pixel has a value calculated on the input point values. The result is an equally spaced grid of values in a specified co-ordinate system. This technique is often used to display geochemical data in environmental studies. Soil samples:Random techniques highlighted in Jewell et al (1993) and judgmental techniques described in Crépin and Johnson (1993) were used in obtaining soil samples from both the study and control sites. Figure 2.3 reflects the soil sampling points. Details of sampling have been explained in section 2.2.1. A total of 400 samples were collected from the study site and nine samples from the control site for analyses. Grab soil sampling method as explained by Tan (1996, 1998) was used to obtain the samples with the aid of a machete, a trowel and/or a shovel. Soil samples were taken at a depth of between 0 cm and 20 cm. Each sample was placed in a 20 cm x 30 cm polythene bag and put in an oven at 60 °C overnight for the release of surface soil moisture, and eventual analyses. Chemical analyses: The determination of Fe and Mn concentrations in the soil samples after acid digestion of samples was performed on a Varian Spectra AA-220 FS atomic absorption spectrometer (Varian, Australia) equipped with a deuterium background correction. The operational parameters are provided in Table 1. The procedure for sample digestion is as reported by Jones and Case (1990) and Page et. al. (1982). Ultra pure water was obtained using the Milli-Q water system, millipore. Nitric, perchloric and hydrochloric acids used in the digestion process were of spectral purity (Fluka, Switzerland). 1000 mg/L Fe and Mn stock standards were purchased from SAACHEM, South Africa. The data obtained with the Varian SpectrAA 220 FS AAS interfaced to Pentium 4 PC (Veriton 7500, Vic, Australia) was manipulated by the software, SpectrAA CFR, version 2001. The latter used the equation by Jones and Case (1990) to calculate concentrations of metal in μg /g of soil sample, on entering the parameters; final volume after dilution, dilution factor and mass of the digested sample.
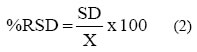
The concentration (μg /g) values are accompanied by the errors expressed as standard deviation (SD) automatically generated by the software. In order to calculate the percent relative standard deviation (% RSD), the mean (X) and SD values were entered in equation (2) using Microsoft Excel.
Data interpretation using GIS: Three main software packages were used for classification and processing of the data and these were ILWIS, Geosoft Oasis MontajTM, and ArcGIS. The software used for processing the satellite image is ILWIS version 3.0 released May 2001. The ILWIS is a PC-based GIS and remote sensing package. The International Institute for Aerospace Survey and Earth Sciences (ITC) in the Netherlands developed it. The Geosoft executables that run on the Oasis Montaj core platform were used to process the data. The data obtained through field mapping and laboratory tests were coded, processed and analysed both qualitatively and quantitatively. The satellite image of the area was rectified and processed using different image processing software packages. Classification exercise was carried out on the MSS image using the ILWIS software. For the handling of data on concentration levels of Mn and Fe in soils, gridded maps were made as the base map. ArcGIS was used for the distribution map. The main aim of the distribution map was to use GIS so as to show location and spatial variation of Mn and Fe concentrations in the soils. RESULTS AND DISCUSSIONResults A summary statistics of the results of analyses of Fe and Mn assays of soil and leaf samples from the study area is given in Table 2. Both μg g-1 and ppm are used interchangeably. The range of concentration levels of Fe in soils was from 1116 μg g-1 to 870766 μg g-1 with a mean of 17593 μg g-1 and for Mn in soils was 35 μg g-1 to 24907 μg g-1 with a mean of 1088 μg g-1. The standard deviation and threshold values of the analysed assays are reported in Table 2. For soil samples, values of median, mode, sample variance, Kurtosis, skewness, sum and count for Fe and Mn concentrations are presented in Table 2. The concentration levels of Mn and Fe in the control area were significantly lower than the mean concentration values of soils and leaves from the study area. Table 1: Operational parameters set for the determination of manganese and iron in soils and leaves of plants from the Kgwakgwe area
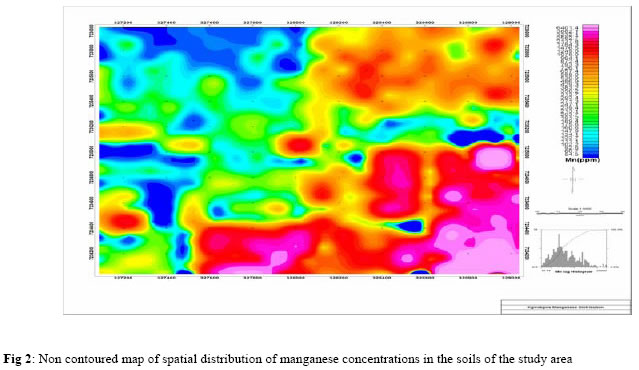
Manganese concentration in soils The Mn concentration levels in the soils samples obtained were significantly high and ranged from 56 μg g-1 and 6401 μg g-1 as shown in the histogram in Fig 1 and the non contoured map in Figures 2. The Mn concentration levels in the soils depict as plotted in the histogram in Fig 1, a log normal distribution though it is positively skewed as described by Miller and Miller (1994), and it has one population. The data set does not distinguish different classes of Mn in soils. Threshold is at 3000 whereby there are about 197 samples above this threshold value. The different shades reflected in the map presented in Figures 2, were unevenly spatially distributed and depicted prograded Mn concentration levels. Table 2: Statistics of iron and manganese assays of soil and leaf samples from the study area (Note: LN = log normal, N = normal)
The high Mn concentration levels were prominent in the southwestern part of the study area to the west of the mine workings whereas the low to medium Mn concentration levels were observed in soil samples located further away from the mine workings as depicted on the map in Fig 2. The high concentration levels of Mn at these sites could be attributed to their closeness to the mine workings and areas of topographic lows. Concentration levels of Mn decreased as one moved away from the mine workings, Mn orebodies and stockpiles. Iron concentration in soils
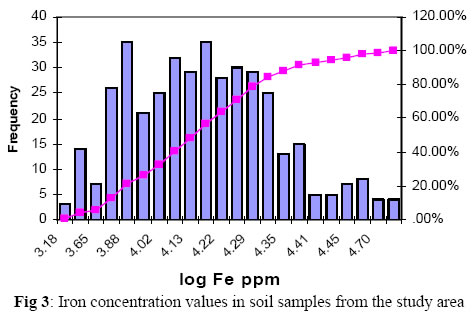
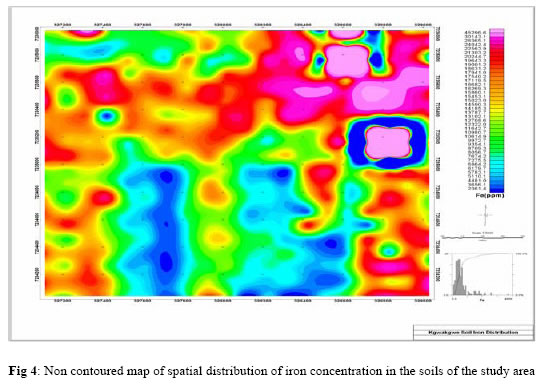
The Fe concentration levels in the soils samples obtained were significantly high and ranged from 2361 μg g-1 and 45297 μg g-1 as shown in the histogram in Fig 3 and the non contoured map in Fig 4. The Fe concentration levels in the soils shows as plotted in the histogram presented in Figure 3 a log normal distribution and it is polymodal in nature as it reveals at least three populations. Threshold is at 22500 whereby there are about 47 points above this threshold value. The shades reflected in the map presented in Figures 4 were unevenly spatially distributed and depicted prograded Fe concentration levels. The low Fe concentration levels were prominent in the southwestern part of the study area to the west of the mine workings whereas the medium to high Fe concentration levels were observed in soil samples located further away from the mine workings as depicted on the map in Figure 4. The low concentration levels of Fe at the sites enriched with Mn could be attributed to the closeness of the mine workings and areas of topographic lows. Concentration levels of Fe significantly increased as one moved away from the mine workings, Mn orebodies and stockpiles. Relationship between manganese and iron concentrations in soils Though looking at the Fe and Mn histogram there is a certain small population that shows extremely high values almost like outliers in the graph (Fig 5). There is a high correlation of 0.70 between the Fe and the Mn. Iron content in soils is low in the quarry sites (SW) and on the Kgwakgwe hills them selves. The anomalies are in the northeastern parts of the area. There is a big petal shaped anomaly that is surrounded by an immediate decrease of the iron. The southern part of the area has low iron content as opposed to the northern parts. Manganese on the other hand is very high around the quarry sites and on the Kgwakgwe hills. Manganese is generally low in the northern part of the area with the lowest points being in the northwestern parts of the map area. Also to note that it is not the whole of the southern part that shows Mn anomalies. The southwestern parts of the map have very low Mn concentrations. The anomalous Mn form pockets in the southeastern part of the map area. It can be inference that the geology of the area as well as mining activities have affected the Mn and Fe contents in the soils within the study area. Conclusion: This work focused on determining the concentration levels of Mn and Fe in soils close to an abandoned Mn oxide mine, and using the data to present their spatial distributions. Concentration levels of Mn and Fe in soils of the study area are significantly higher than those of the control site. Using GIS techniques to present the spatial distribution of these elements in the soils near the abandoned Kgwakgwe Mn oxide mine, higher concentrations of Mn were obtained for samples closer to mine workings, ores and where anthropogenic activities took place during mining. The reverse was applicable for Fe. It is thus evident from both the results obtained for concentration values of Fe and Mn in the soils and their spatial distribution that the geology of the area as well as mining activities have affected the Mn and Fe contents in the soils within the study area. REFERENCES
Copyright 2005 - Journal of Applied Sciences & Environmental Management The following images related to this document are available:Photo images[ja05042f5.jpg] [ja05042f2.jpg] [ja05042f1.jpg] [ja05042f4.jpg] [ja05042f3.jpg] |
| |||||||||

