 |
| About Bioline | All Journals | Testimonials | Membership | News |
|
||||||
|
||||||
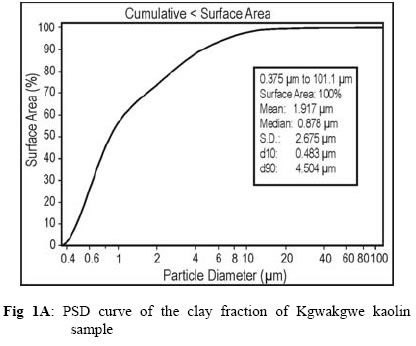
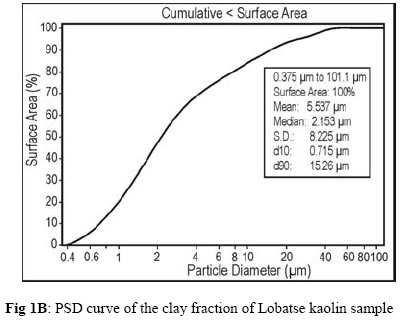
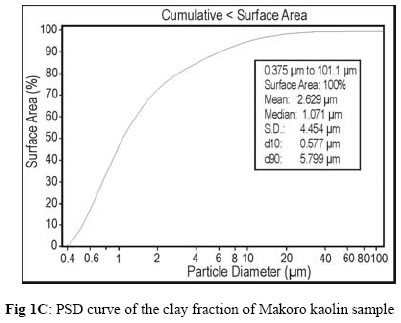
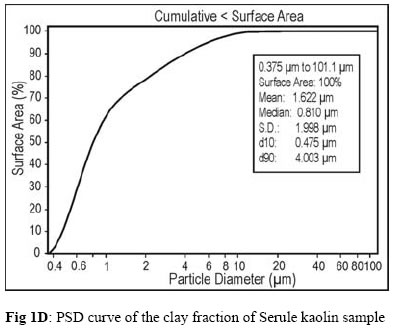
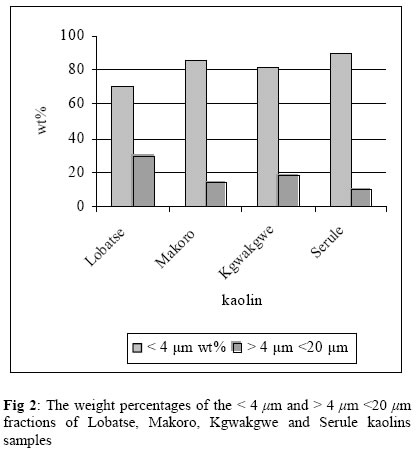
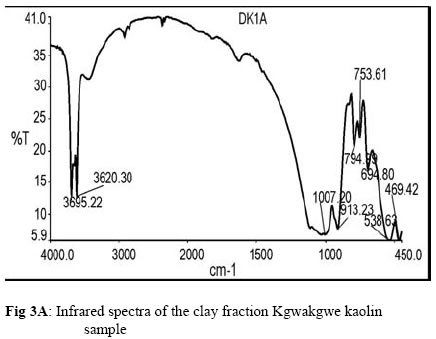
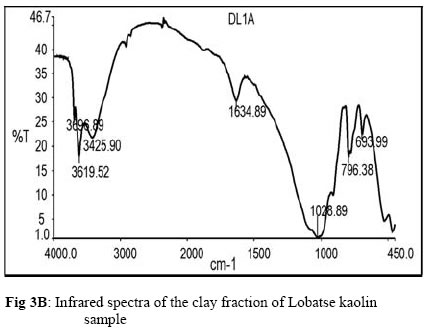
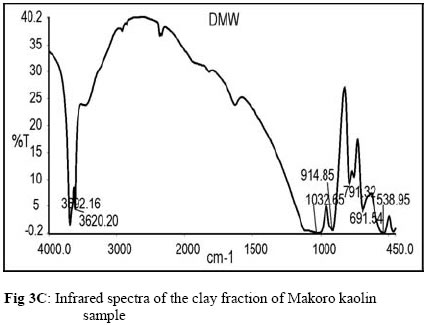
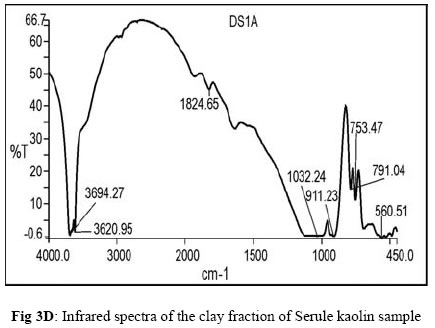
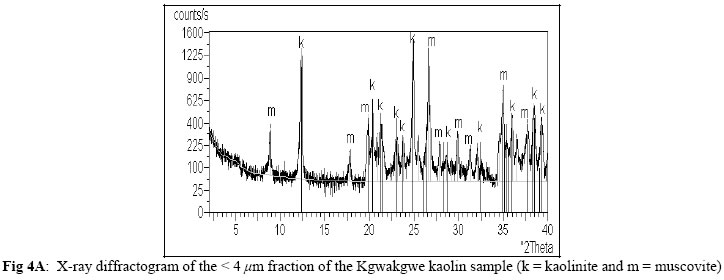
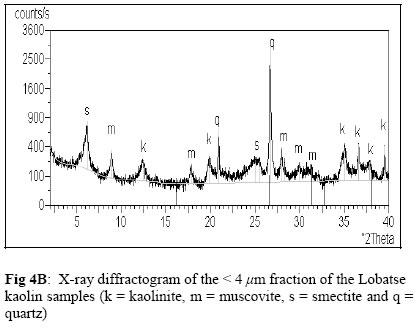
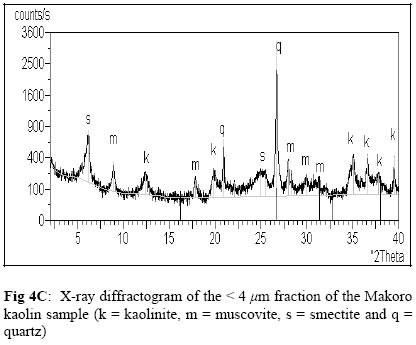
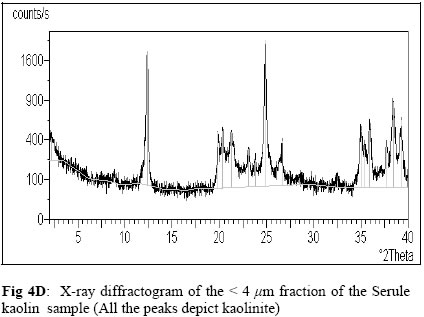
Fourier Transform Infrared Spectrophotometry and X-ray powder Diffractometry as Complementary Techniques in characterizing Clay size fraction of Kaolin GEORGES-IVO E. EKOSSE X-Ray Diffraction Unit, Faculty of Science, University of Botswana, P/Bag 0022 Gaborone, Botswana. Code Number: ja05043 ABSTRACT This study aimed at demonstrating complementary roles offered by both Fourier transform infrared (FTIR) spectrophotometry and x-ray powder diffraction (XRPD) techniques in characterizing clay size fraction of kaolins. The clay size fraction of kaolin samples obtained from Kgwakgwe, Makoro, Lobatse and Serule kaolin occurrences and deposits in Botswana were characterized using laser diffraction particle size analyzer (LDPSA), FTIR spectrophotometry and XRPD techniques. More than 70 wt % of the clay size fraction of these samples were < 4 μm. Main peaks in the infrared spectra reflected Al-OH, Al-O and Si-O functional groups in the high frequency stretching and low frequency bending modes and were those for kaolinite but possible absorption interference peaks for quartz, smectite and muscovite are inferred. The XRPD results identified kaolinite as the major mineral phase with confirmed presence of quartz, smectite and muscovite as minor quantities in the samples. The findings therefore suggest that XRPD technique could be used as a complementary tool when characterizing the clay fraction of kaolin using FTIR spectrophotometry. @JASEM Kaolin is both a rock and clay mineral term consisting of pure kaolinite or related minerals such as halloysite, nacrite and dickite as well as associated mineral assemblages which include quartz, smectites, feldspars and micas. Its deposits could be primary (hydrothermal, residual or mixed hydrothermal and residual deposits) or secondary (erosion and transportation of clay particles and their deposition in lacustrine, paludal, deltaic and lagoonal environments) depending on their genesis. Kaolin genesis has a direct bearing on its industrial applications. Kaolin is utilized in the paper, paint, rubber, ceramic and plastic industries. Other applications include pharmaceutics, cosmetics, wine and vegetable clarifiers, insecticides, pesticides, fungicides, crayons and pencils, oil absorbers, fertilizers, polish, cat litter, cosmetics, and iron smelting (Ekosse, 2000, 2001; Murray, 1986). Brick making, pottery chinaware and porcelain, and the construction industry are major consumers of kaolin. Kaolin is widely utilized for different industrial applications, and as such any of its occurrences is worth proper chemical, mineralogical and technological investigations. Tests for its characterization include FTIR spectrophotometry technique. This technique has been well used for the identification of functional groups in kaolin. The strength of FTIR spectrophotometry applied to clay mineralogy lies in its ability to characterize the functional group and fingerprint regions of very small quantities of samples (Tan, 1998). Unfortunately, due to its sensitivity, FTIR spectrophotometry has draw backs such as absorption peak interferences whereby two or more minerals share same absorption peaks in the high frequency stretching and/or low frequency bending modes (Ojima, 2003); thereby possibly affecting the interpretation of results. In eliminating ambiguity caused by interferences of peaks, complementary analytical techniques should be applied. In this regard, XRPD technique could be used in the identification and characterization of mineral phase components present in kaolins. Its limitation in identifying phases below instrument detection limit is equally recognized. This study demonstrates the complementary role of both FTIR spectrophotometry and XRPD techniques in characterizing the clay size fraction of kaolins. MATERIALS AND METHODS Samples were obtained from four kaolin occurrences and deposits in southeastern Botswana: Kgwakgwe, Lobatse, Makoro and Serule. The Kgwakgwe kaolin occurs at latitude 25° 00" 05±S and longitude 25° 19" 30±E. Lobatse kaolinitic mudstones are located at latitude 25° 41’ 02” S and longitude 25° 12’ 04” E. Makoro kaolinitic mudstones are found at latitude 22° 39" 50±S and longitude 27° 05" 05±E. Serule kaolin occurs at latitude 21° 59’ 06” S and longitude 27°20’16” E. Clay size fraction in this study was defined as particles being < 4 μm in particle size. The clay size fraction of the samples for minerals identification and characterization was obtained based on the principle of sedimentation according to Stoke’s law (Gaspe et. al., 1994). The particle size distribution (PSD) analyses of the clay size fraction of kaolin samples were carried out using a Beckman Coulter LS 200 laser diffraction particle size analyzer (LDPSA) with a Fraunhofer Rf 780z optical mode. Analyses were performed in the dry powder module from a free flowing position, following the procedures described in the manual. Calculations for particle sizes were from 0.375 μm to 101.1 μm. The procedure used for FTIR spectrophotometry analysis is that mentioned by Ojima (2003) and Madejova et. al. (1997). The infrared spectra were acquired using a Perkin Elmer system 2000 FTIR spectrophotometer at a resolution of 4 cm-1. The dried powdered samples were homogenized in spectrophotometric grade KBr in an agate mortar and pressed at 3 mm pellets with a hand press. In order not to distort the crystallinity of kaolinite in the samples, the mixing was set to 3 min allowing for minimal grinding as suggested by Tan (1998). Peaks were reported based on % transmittance to given wavelengths. For XRPD analysis, the dried samples were gently crushed in an agate mortar to a fine texture in order not to affect kaolinite crystallinity (Ekosse, 2004). The powder samples were mounted on the sample holder with very little pressure, and later scanned in the Philips PW 3710 XRPD system which was operated at 40kV and 45 mA, with a Cu-Kα radiation and a graphite monochromator. A PW 1877 Automated Powder Diffraction, X'PERT Data Collector software package was employed to capture raw data, and a Philips X'PERT Graphics & Identify software package was used for qualitative identification of the minerals from both the data and patterns obtained by scanning at a speed of 1°2θ / min. Samples were scanned from 2°2θ to 40° 2θ and their diffractograms recorded. The interpreted results were compared with data and patterns available in the Mineral Powder Diffraction File, data book and the search manual issued by the ICDD (1986, 2002) for confirmation. RESULTS AND DISCUSSION The PSD curves for Lobatse, Makoro, Kgwakgwe and Serule kaolins are presented in Figures 1A, 1B, 1C and 1D respectively, and the wt % of the clay size and silt fractions (silt defined as > 4 μm <20 μm) are given in Figure 2. The smallest particle size for Lobatse kaolin was 0.72 μm and biggest one was 15.26 μm with a median of 2.15 μm and a mean of 5.53 μm. The Makoro kaolin, being finer than Lobatse, had 0.52 μm for the smallest particle size and 5.799 μm for the biggest one, with a median of 1.07 μm and a mean of 2.53 μm. The Kgwakgwe kaolin was finer than both Makoro and Lobatse kaolins. Its smallest particle size was 0.48 μm and the biggest one was 4.50 μm with a median of 0.88 μm and a mean of 1.92 μm. The Serule kaolin was the finest of all. Its smallest particle size was 0.48 μm and the biggest one was 4.00 μm with a median of 0.81 μm and a mean of 1.62 μm. The clay size fraction for the kaolin samples were as follows: Lobatse = 70 wt %, Makoro = 82, Kgwakgwe = 86 and Serule = 90 (Figure 2). The infrared spectra of the Lobatse, Makoro, Kgwakgwe and Serule kaolins samples presented in Figures 3A, 3B, 3C and 3D respectively and Table 1 exhibited OH stretching at bands 3620, 3621, 3694, 3695 and 3697 cm-1, and the OH deformation bands were observed at 911, 913 and 915 cm-1. Bands associated with SiO stretching were 692, 994 and 695 cm-1; 753 and 754 cm-1; and 791, 795 and 796 cm-1, whereas SiO deformation bands were 1007, 1032 and 1033 cm-1. These bands are close to those obtained for theoretical kaolinite. Peaks for theoretical kaolinite, defined as pure kaolinite with the chemical formula Al2Si2O5(OH)4, are also given in Table 1. Other peaks corresponding to smectites, muscovite and quartz were equally observed. The XRPD results of the < 4 μm fraction of the Kgwakgwe, Lobatse, Makoro and Serule kaolin samples are summarized in Table 2, and the diffractograms of the samples are presented in Figures 4A, 4B, 4C and 4D respectively. Minerals identified included kaolinite, muscovite, smectite and quartz. All the samples contained kaolinite with well defined peaks as the dominant mineral. The < 4 μm fraction of the Serule kaolin contained only kaolinite. Table 1: Wave numbers in cm-1 of main absorption bands for the clay fraction of samples of Kgwakgwe, Lobatse, Makoro and Serule kaolins compared to theoretical kaolinite
Table 2: Minerals identification by XRPD of the < 4 μm fraction of the Kgwakgwe, Lobatse, Makoro and Serule kaolin samples.
Kaolinite consists of a basic unit cell made of a tetrahedral sheet of silica (SiO2) and an octahedral sheet of gibbsite (Al(OH)3), both bonded by shared O atoms; of which the units are held by hydrogen bonds. It is classified as 1:1 dioctahedral kaolinite because only 2/3 of the vacant sites in the octahedral sheet are filled (Bailey, 1980; Ekosse, 2005). Layer stacking of kaolinite is controlled by repulsion between highly charged Si and Al cations which tend to avoid superposition (Bailey, 1980; Dixon, 1989). Kaolinite is an aluminosilicate formed by the alteration of K-feldspar such as microcline and micas such as muscovite as shown in equations 1 and 2. 2KAl3Si3O10(OH)2 + 2H+ + 3H2O → 3Al2Si2O5(OH)4 + 2K+ (1) K-feldspar kaolinite 2KAlSi3O8 + 2H+ + 9H2O → Al2Si2O5(OH)4 + 2K+ + 4H4SiO4 (2) muscovite kaolinite From the chemical composition of a kaolinite unit cell, and the product of the reactants as illustrated in equations 1 and 2, it could be observed that Si-O, Al-O and OH play functional roles in its identification and characterization. Unfortunately these functional groups are equally present in several other aluminosilicates; such that absorption peak interferences using FTIR technique are often misinterpreted in characterizing the mineral phases (Tan, 1998; Madejova et. al., 1997). Peak values obtained for highest frequencies observed in the kaolinite samples were the stretching OH vibrations occurring for these samples between 3620 cm-1 to 3697 cm-1, but only Lobatse kaolin exhibited a peak at 3426 cm-1 which is attributed to smectite (Ojima, 2003). There was no interference of peaks occurring at these highest frequencies where stretching OH vibrations occur, similar to the observations of Lanson et. al. (2002). Interferences of peaks were however observed at lower frequencies (between 114 cm-1 and 430 cm-1) of bending vibrations, and another peak which pertains to smectite was observed at 1635 cm-1. Within this range of wavelength, main functional groups were SiO and Al-OH. Muscovite and possibly quartz interference could be observed at 1029 cm-1 for Lobatse kaolin. The Al-OH absorption peak was identified for Kgwakgwe kaolin at 913 cm-1, Makoro at 915 cm-1 and Serule at 911 cm-1 whereas for theoretical kaolinite it is at 912 cm-1. Possible peak interferences of quartz in the region of 785 cm-1 – 820 cm-1; smectite at 797 cm-1 and muscovite at 799 cm-1 could only be inferred. In order to eliminate the uncertainty of minerals identification based on functional grouping using FTIR spectrophotometry, XRPD technique was employed as both a complementary and confirmatory tool. Results obtained firmly confirmed the presence of kaolinite for all the samples; muscovite, smectite and quartz in the Lobatse and Makoro samples, and muscovite for the Kgwakgwe sample. The perfect confirmatory result was that of the Serule sample in which there were no other minerals identified by XRPD technique except kaolinite, supporting results also obtained by FTIR spectrophotometry. In concluding, this study aimed at demonstrating complementary roles of FTIR spectroscopy and XRPD techniques in characterizing the clay fraction of kaolin samples obtained from Kgwakgwe, Lobatse, Makoro and Serule kaolin occurrences and deposits in Botswana. The results revealed that Lobatse kaolin was the coarsest of all the studied samples with 70 wt % of particles being < 4 μm followed by Makoro kaolin with 82 wt % being < 4 μm. Infrared Absorption peaks obtained for their clay fractions depicted values at the functional group region that could possibly correspond to those of smectite, muscovite and quartz. However, it was not possible to pinpoint these minerals from the infrared spectra because the peaks at the fingerprint region reflected those for kaolinite, and possibly quartz. Using XRPD as complementary technique, these mineral phases were identified. Serule kaolin was the finest of the four studied kaolin samples with 90 wt % of particles being < 4 μm followed by Kgwakgwe kaolin with 86 wt % being < 4 μm. Infrared Absorption peaks obtained for the clay fraction of the Serule kaolin were very similar to those obtained for theoretical kaolinite, and the XRPD results depicted kaolinite as the monomineralic phase. A similar trend of FTIR peaks was obtained for Kgwakgwe. However, the XRPD results depicted not only kaolinite but muscovite as well. It is not certain why muscovite absorption peaks could not have been detected by FTIR analysis. However, the findings confirm that both techniques complement one another in characterizing clay fractions of kaolin. Acknowledgement: Dr. J. C. Ngila, Chemistry Department, University of Botswana is acknowledged for assistance with FTIR spectrophotometric analysis of the samples. REFERENCES
Copyright 2005 - Journal of Applied Sciences & Environmental Management The following images related to this document are available:Photo images[ja05043f1b.jpg] [ja05043f1d.jpg] [ja05043f4a.jpg] [ja05043f1c.jpg] [ja05043f3a.jpg] [ja05043f2.jpg] [ja05043f4b.jpg] [ja05043f4d.jpg] [ja05043f4c.jpg] [ja05043f3b.jpg] [ja05043f3c.jpg] [ja05043f3d.jpg] [ja05043f1a.jpg] |
| |||||||||
