 |
| About Bioline | All Journals | Testimonials | Membership | News |
|
||||||
|
||||||
Journal of Applied Sciences & Environmental Management, Vol. 9, No.
2, 2005, pp. 49-55
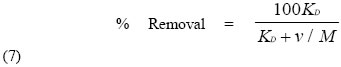
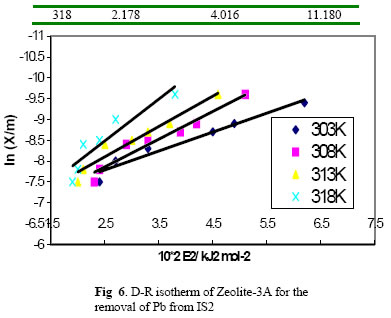
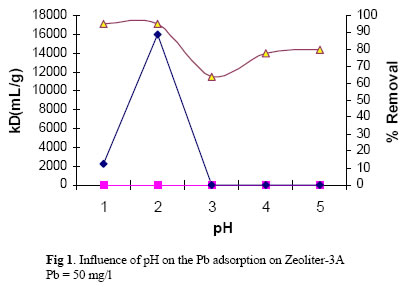
Estimation of Pb from Metal and Electroplating Industrial Waste by Zeolite-3A HAJIRA TAHIR; FAHIM UDDIN* Department of Chemistry, University of Karachi, Karachi-75270Pakistan. Code Number: ja05044 ABSTRACT The concentration of lead in sediment and liquid waste samples of selected metal electroplating industries was measured by atomic absorption spectrophotometer. The data obtained revealed that lead content in liquid wastes varies in the range of 0.582-14.97 mg L-1 and 1.300- 757.8 mg Kg –1 in sediments. Removal of lead in the sediments and liquid waste was then carried out using zeolite-3A. Result shows the quantitative removal of lead. Factors that effect the lead removal include the adsorbent concentration, pH and temperature. The applicability of Freundlich, Langmuir and Dubinin – Radushkevich equations for the present system has been tested and the values of distribution coefficient were also evaluated. Thermodynamic parameters like ΔG°, ΔH° and ΔS° were also calculated. The results of such studies suggested that about (99.9%) removal was obtained by using zeolite-3A. It show that zeolite- 3A could be utilized as a potential decontaminate for the removal of lead from metal electroplating industries waste before discharging into hydrosphere. @JASEM Industrial development has been accompanied by heavy metal pollution of the environment with lead being of particular interest. Many incidences of lead poisoning resulting from untreated industrial wastes (Cikrt and Bencko 1982, Finkelman and Phai-ng 1996). Lead serves no useful purpose in the human body, and its presence in the body can lead to toxic effects, regardless of exposure pathway. Since lead is chemically very similar to calcium, it is handled by the body as if it were calcium and therefore very dangerous to bone formation. Thus the first place for its transportation is plasma and membrane sites in soft tissues. It is then distributed to the other sites where calcium plays an important role, most notably in the teeth of developing children’s and in bone at all ages. Lead primarily affects the peripheral and central nervous systems, renal function and blood cells. It can also cause hypertension, reproductive toxicity and developmental effects. Acute high lead exposure can cause serious physiologic effect, including death or long damage to brain function and organ systems. The pervasiveness of lead contamination in the environment is the result of wide spread use of lead by humans and the transboundary dispersion patterns of industrial lead accumulation. Lead and its compounds are widely used as an industrial raw material for storage battery manufacture, printing, paint, dyeing processes, photographic material, matches, explosives and lead pipes. The potential environmental impact of waste water from metal and electroplating industries was evaluated by the examination of lead content. Elevated lead concentration normally emanated from the sediments of mentioned industries waste streams (Clement et al 2000, Dudka et al 1996). The problem of disposal of waste water containing heavy metals is well recognized. A number of investigations on the use of zeolites to remove heavy metals contamination before discharge into water basins have been reported (Gaboury 1994, Sultan et al 1998). The aim of this work is therefore to report the assessment of the metal pollution level through the analyses of metal and electroplating industries wastes, elaborate the technical methods to support trace metals minimization and the removal of Pb from metal and electroplating industries wastes. MATERIALAS AND METHOD Sample Collection and Pre-Treatment: Two series of sampling were carried out simultaneously obtaining two sets of samples of liquid wastes and sediments from the same spot in order to compare their contents of metals. Thirteen sampling sites were chosen located at Lahore and Islamabad, two major cities of Pakistan, to value the impact of lead pollution level. At each sampling point three liquid waste and sediments samples were collected from outside and inside the flowing waste stream. The sampling of the sediments was performed using Van Dean grab sampler and that of the liquid waste using a peristaltic pump. IL1 to IL5 show the sampling sites of the liquid waste stream at location 1 to 5, while IS1 to IS7 sampling sites of sediments and location 1 to 7. The sediment samples were dried at 60±1ºC in electric oven (Toyo F-Type) to constant weight and ground to powder in a Teflon mortar and sieved to 100 μm particle size and stored in pre- washed plastic container. In the present investigation, a nitric acid digestion method was adopted. The digestion procedure was carried out by mixing 50 mL of the liquid waste or 5.0 g of dried sediment samples to 25 mL of nitric acid (65%). These samples were heated at 120 °C on a hot plate until 2/3 of the volume was evaporated. The mixture was filtered through a Millipore membrane. The digested liquid wastes and sediments samples were analyzed by a Perkin – Elmer Model 3100, Flame Atomic Absorption Spectrophotometer equipped with hollow cathode lamp. The chemical composition of the employed zeolite-3A, supplied by the Union Carbide Corp. may be written as K9 Na3 [AlO2)12 (SiO2)12]. 27 H2O. The zeolite samples were activated by heating overnight in a stepwise manner from room temperature to 500°C. The Adsorption Process: The adsorption processes were undertaken by using IL3 and IS2 samples in the temperature range 303–318 K. The initial pH of the liquid waste was adjusted using a buffer solution of known pH and known amount of zeolite-3A were added to the solution contained in a reagent bottle, which was shaken for a fixed time period (60 min.) using shaker incubator 1000 of Heidolph to attain equilibrium. The contents of the reagent bottles were filtered to separate the zeolite and the residual concentration of lead ions in the filtrate measured by Atomic Absorption Spectrophotometer.. Effect of pH: The influence of pH for the adsorption of Pb was observed. For this purpose 50 ml of 50 mg. dm-3 solution of lead nitrate having variable pH (1.0 to 5.0) was added in different flasks with 0.5g zeolite -3A. The content of flasks was shaken for 60 minutes and then filtered to separate the zeolite. The residual concentration of lead ions in the filtrate was measured by atomic absorption spectrometer. Effect of Amount of Adsorbent: In order to find out optimum amount of adsorbent at which maximum adsorption takes place 50ml of 50 mg. dm-3 of Pb solution having pH 2 was added in the flasks with different quantity of adsorbent e.g. 0.1, 0.2, 0.3, 0.4, 0.5, 1.0……1.50 g. The Pb solution was kept shaken for 60 minutes and then filtered. Effect of Temperature: For the determination of the effect of temperature on the adsorption of Pb under optimize adsorption conditions, the adsorption process was proceeded at 303-318 K temperatures at the step of 5 K ±0.2 °C. Adsorption Isotherms: The equilibrium relationships between the adsorbent and adsorbate are described by three different adsorption isotherms. The experimental data points were fitted to Freundlich, Langmuir and Dubinin – Radushkevich (D-R) isotherm equations. Freundlich Isotherm: The Freundlich isotherm equation is expressed in the form: X/m = A Cs 1/n (1) Where A and n are empirical constants, X/m is amount adsorbed per gram of adsorbent and Cs is the equilibrium concentration. Langmuir Isotherm: The Langmuir adsorption isotherm is the best-known model and the one most frequently utilized to determine the adsorption parameters. The Langmuir expression can be represented by eq. (2). (Cs / x/m) = (1/ kVm) + (Cs / Vm) (2) where K is a constant of Langmuir adsorption , Xm is the limiting amount of adsorbate that can be taken up per mass of adsorbent, Cs has the same meaning as in the Freundlich isotherm. Dubinin – Radushkevich (D-R) Isotherm:The data were also fitted to Dubinin-Radushkevich (D-R) equation, which expressed in the linear form as: ln (X/m) = ln Xm – K’ε2 (3) where K’ is a parameter of the D-R equation and ε = RT ln Co/ Cs (4) Where Co is the initial concentration, Cs is the equilibrium concentration and X/m is the amount adsorbed per gram of the adsorbent. The D-R plots of ln (X/m) vs. ε2 obtained at various temperatures are shown in Fig. 6. Values of Xm and K’ were obtained from the intercept and slope. The mean free energy of adsorption process (Es) was calculated from K’ according to the equation: Es = (-2K)-1/2 .(5) RESULTS AND DISCUSSIONEstimation of Lead:The mean concentrations of lead metal in five liquid wastes IL1 to IL5 are (13.17, 7.914, 14.97, 3.096, 5.992, 0.582 mg/L) and in seven sediments samples from IS1 to IS7 are (199.3,757.8, 20.8, 24.9, 171.5, 1.3, 36.68 mg/Kg ) respectively. The highest concentration of lead was present in the liquid waste samples IL3 (14.97 mg/L) and in the sediment samples IS2 (757.8 mg/Kg) which are far greater than maximum permissible limit. Therefore pretreatment is required before discharging the industrial water in the main drainage system. Purification of Waste: Adsorption of Pb was studied on zeolite-3A under the optimize conditions of pH, amount of adsorbents and temperature. The results are summarized in Figure 1, 2 and 3. The influence of pH on the adsorption of lead ion by zeolite –3A from sample IS2 has been studied using the optimized shaking time of 60 minutes and 0.5 g of adsorbent, as shown in Fig. 1. The percentage adsorption increases slightly while the value of KD increases dramatically with increasing pH up to a value of 2, followed by a decline in the former value and an equally dramatic fall in KD at higher pH. For this reason, a buffer with a pH of 2 was used in all subsequent studies. The values of distribution coefficient (KD) and percentage adsorption were computed using the following equations: KD = C1 / C2 (6) and
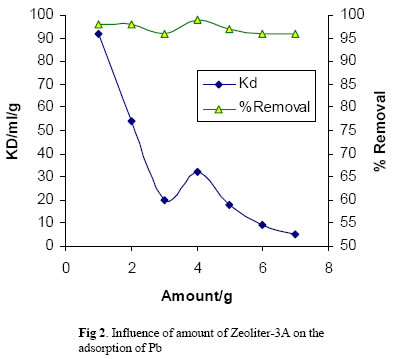
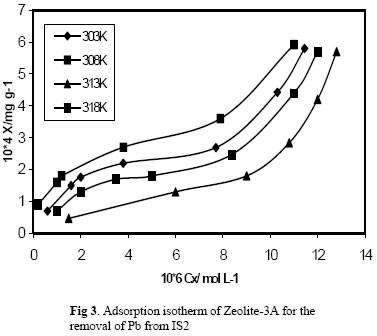
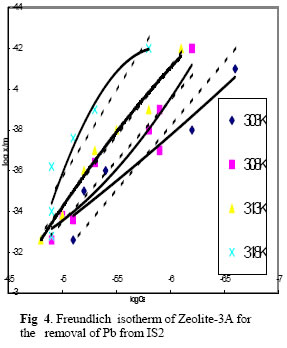
In equation (6), C1 is the amount of Pb ions adsorbed per gram of solid and C2 is the concentration of Pb ions per ml of tannery waste solution. In equation (7), V is the volume of the solution and M is the amount of adsorbent. Another parameter, which affects the extent of adsorption, is the amount of zeolite-3A employed in the system. The results are depicted in Fig. 2 indicates that the optimum amount of zeolite in the system was 0.5g. Adsorption isotherms measured at temperatures ranging from 303K to 318K are shown in Fig. 3. The data have been plotted in terms of the amount adsorbed (X) per gram of solid (g) Vs. the equilibrium concentration expressed in mol/L. The quantity X/m expressed in g/g was calculated from the following equation: X/m = (Co – Cs )V/m (8) where Co is the initial concentration of lead ions in the present system. Cs is the equilibrium concentration. V is the total volume of the solution and m is the weight of zeolite employed. The adsorption isotherm for solution according to Giles classification (Giles, 1960) may be classified into five types relating to their shapes are S, L, H, C and Type III All isotherms in our present system are L3-type. The initial steep increase in these isotherms indicates that the large amount of the Pb is adsorbed at lower concentration, since more active sites of adsorbent are available for adsorption. As monolayer is formed it becomes increasingly difficult for a solute molecule to find vacant site available as more sites in the adsorbent are filled. The increase in adsorption with temperature may be due to negative temperature coefficient for the solute solubility or a simultaneous decrease in the real adsorption of the solvent. The Freundlich plots are shown in Fig. 4. Values of n and A are computed from the respective slopes and intercepts are tabulated in Table 1. The values of n reveal the nature and strength of adsorptive forces involved, with a higher value indicating the existence of strong adsorption forces operating on zeolite-3A. However, the higher values of A confirm a higher affinity of lead ions for the activated zeolite ( Saleem et al, 1994). Table 1: Freundlich isotherms of zeolite- -3A for the removal of lead from IS2 sample.
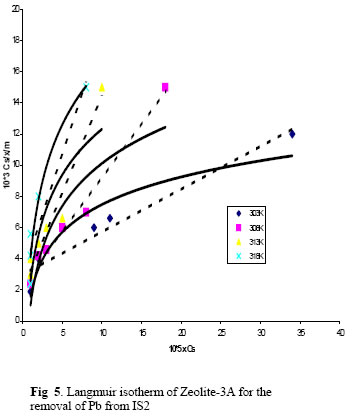
A plot of Cs/(X/m) Vs. Cs was made to test the Langmuir isotherm model and found to be linear with a gradient of slope and intercept of this plot respectively are 1/Vm and 1/ (KVm) as shown in Fig. 5. The doted and solid lines represent linear and non linear regression fits for both isotherms. Their correlation coefficient values are summarized in Table 2, indicating that the data fit the Langmuir isotherm better than the Freundlich isotherm, both in case of linear and non linear regressions. Table 2: Correlation coefficients for linear and non linear regression fits of different adsorption isotherms
The Freundlich adsorption isotherm is an indication of surface heterogeneity of the adsorbent while Langmuir adsorption isotherm hints towards surface homogeneity of the adsorbent. This leads to the conclusion that the surface of zeolite-3A is made is up of small homogenous adsorption patches, which are very much similar to each other in respect of adsorption phenomenon. The good correlation coefficient values of Langmuir isotherms also explaining strictly localized monolayer adsorption phenomenon. The Dubinin –Radushkevich isotherm was plotted as ln (X/m) Vs. ε2 at various temperatures are shown in Fig. 6 and Table 3, showing that the values of Es increased with temperature indicating increase in lead ion separation with temperature. Table 3: D-R isotherms of zeolite-3A for the removal of Pb from IS2 sample
Thermodynamics of Adsorption:The adsorption of Pb from IS2 sample was investigated at 303K through 318K. Table 4 shows the distribution coefficient and % removal values, which increase in temperature. With increasing temperature, electrostatic interactions become weaker, the matrix becomes more flexible and the ions become smaller because solvation is reduced and the process of removal was found to be endothermic. In endothermic process, the increase in extent of removal with temperature is due to increase in adsorbing tendency of the adsorbate species on the surface of adsorbent. Table 4: Percentage removal and distribution coefficient (KD) of Pb from IS2 sample using Zeolite-3A
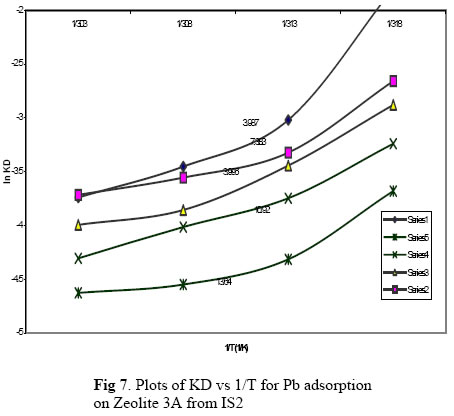
The thermodynamic quantities such as ΔHo (enthalpy change) and ΔSo (entropy change and ΔGo (free energy change) for Pb adsorption were calculated from distribution coefficients using: ln K = -ΔSo / RT + Constant (9) The values of free energy of adsorption (ΔG°) were obtained using the well known formula: ΔGo = ΔH°-TΔS° (10) The values of ΔG°, ΔH° and ΔS° for Pb adsorption from IS2 sample are given in Table 5 and Fig. 7. The adsorption of Pb was endothermic. At higher temperature ions are more readily desolvated and hence its adsorption become more favorable at higher temperatures. The values of free energy of adsorption ΔG° indicate that the adsorption process is more spontaneous at higher temperatures (Hajira.et al 2005). Table 5. Thermodynamic Parameters for the removal of Pb from IS2 sample using Zeolite-3A
Conclusions: The result of present investigation show that in most of the waste samples concentration of lead is higher than the maximum permissible level. The distribution pattern of lead ion in sediment and liquid waste are not identical. This explains the overall higher contamination level of lead in sediments than in liquid waste. Effectiveness of the method as a means of removing lead metal ion to meet permissible discharge levels has been studied. The results obtained show that the lead under the optimized conditions can be removed quantitatively (99.9%) by using zeolite-3A. REFERENCES
Copyright 2005 - Journal of Applied Sciences & Environmental Management The following images related to this document are available:Photo images[ja05044f7.jpg] [ja05044f5.jpg] [ja05044f3.jpg] [ja05044f4.jpg] [ja05044f2.jpg] [ja05044f1.jpg] [ja05044f6.jpg] | ||||||||||||||||||||||||||||||||||||||||||||||||||||||||||||||||||||||||||||||||||||||||||||||||||||||||||||||||||||||||||||||||||||||||||||||||||||||||||||||||||||||||||||||||||||||||||||||||||||||||||||||||||||||||||||||||||||||||||||||||||||||||||||||||||||||||||||||||||||||
| |||||||||
