 |
| About Bioline | All Journals | Testimonials | Membership | News |
|
||||||
|
||||||
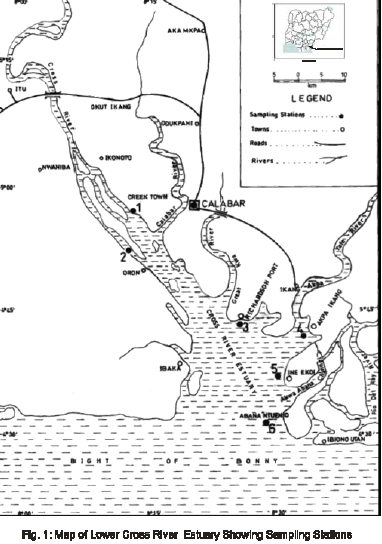
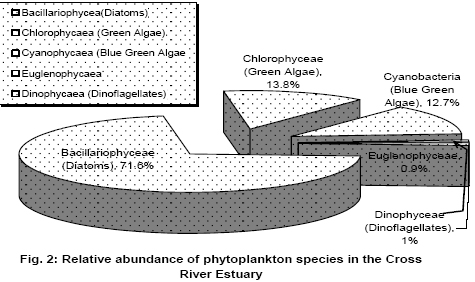
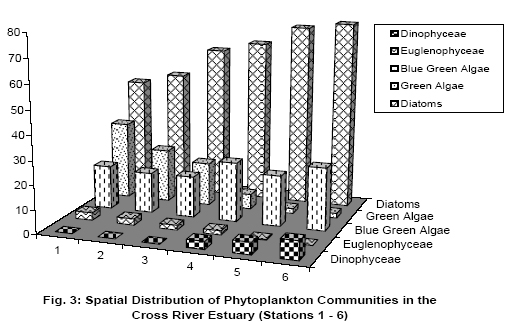
Journal of Applied Sciences & Environmental Management, Vol. 10, No. 1, March, 2006, pp. 89-95 Phytoplankton Diversity in the Cross River Estuary of Nigeria *1EKWU, A O; 2SIKOKI, F D2 1Department of Fisheries and Aquaculture, University of Uyo, Akwa Ibom State, Nigeria Corresponding author. E-mai: ekwualice@yahoo.com Code Number: ja06015 ABSTRACT: Studies on the species composition, relative abundance, spatial distribution and diversity of phytoplankton assemblages in the Cross River Estuary were carried out for twenty-four months, across six (6) sampling stations. A total of 105 species of 57 genera, belonging to 5 families was observed. Bacillariophyceae (Diatom) was the most abundant phytoplankton family, constituting 71.58% of total Algal density, followed by Chlorophyceae (Green algae) with 13.84%, Cyanobacteria (Blue-green algae) with 12.69%, while Euglenophyceae (Green flagellates) and Dinophyceae (Dinoflagellates) recorded 0.88% and 1.01% respectively, of total phytoplankton abundance. Bacillariophyceae showed progressive importance from stations 1 to 6 while chlorophyceae and Euglenophyceae were more abundant in stations 1, 2, and 3. Cyanobacteria however, showed no spatial bias, whereas Dinophyceae were observed only in stations 4, 5 and 6. Bacillarlophyceae was the most dominant family, while chlorophyceae and cyanobacteria were observed to be subdominant groups. Similarity of species occurrence was generally observed in stations 1 and 2, station 3 and 4 and stations 5 and 6. Analysis of variance (ANOVA) showed significant variation (P<0.05) in community structure between stations 1, 5 and 6 whereas stations 1, 2 and 3 showed no significant difference (P>0.05) in composition of phytoplankton assemblages. High abundance of certain cyanobacteria taxa indicated environmental degradation. @JASEM The phytoplankton of an aquatic ecosystem is central to its normal functioning. While they constitute the starting point of energy transfer, they are highly sensitive to allochthonously imposed changes in the environment (Khattak et. al., 2005; Eletta et. al., 2005). Thus the species composition, biomass, relative abundance, spatial and temporal distribution of these aquatic biota are an expression of the environmental health or biological integrity of a particular water body. The Cross River estuary has been described as one of the richest inland fisheries resources in Nigeria, contributing one of the highest quotas of fish production (Moses, 2000) and that 90% of Nigeria’s total marine/brackish water output comes from this estuary. Moses (1999) had earlier reported that this estuary is Nigeria’s richest source of shrimp fishery, producing the world’s best quality shrimps. However, although this estuary has been noted for rich aquatic biodiversity, (Moses 1999; Asuquo et al., 1998), little documented information exists by way of baseline data on algal communities, which are essential tools in assessment of the biological integrity of the area. Previous studies in this area carried out by Akpan (1994) did not identify planktonic forms up to species level. This study was carried out to provide a concise set of structural based criteria (i.e. phytoplankton community composition, species diversity and distribution) for assessment of the environmental status of the estuary. Study area:The Cross River estuary lies between longitudes 8o001E and 8o401E and between latitudes 4o301N and 5o151N of the equator (Fig. 1). The river basin, covering an estimated area of 54,000km2 is rich in clay materials and is located within the tropical rain forest region. Thus the mineral rich catchment area in combination with the dense vegetation and torrential rainfall pattern characteristic of this area play a tremendous role in the biogeochemical regulation of organic and inorganic nutrients in the estuary (Akpan and Ofem, 1993; Asuquo et al., 1998). The estuary is also prone to allochthonously imposed negative changes in the environment owing principally to oil pollution activities (Asuquo et. Al., 1998), a situation which is common to other estuaries in the Niger Delta (Ubom and Essien, 2003; Ekeh and Sikoki, 2004). The Cross River estuary, the largest in Nigeria with a tidal amplitude of 3M (Asuquo et al., 1998) is delineated into three aquatic ecological habitats, ranging from fresh water in the upstream region through brackish water in the middle reaches to the marine environment at the mouth of the estuary (downstream). MATERIALS AND METHODSVertical water samples were collected once a month from six (6) sampling stations over a 24-month sampling period. The sampling stations were divided into three zones, located progressively over a salinity gradient. Sampling Zone A (SZA) comprised stations 1 and 2 while Sampling Zone B (SZB) and C (SZC) comprised stations 3 and 4 and stations 5 and 6 respectively. The water samples were collected using a Hydrobios Nansen water sample of 2 litre capacity. Each sample was then filtered through a No. 20 net of mesh size 76mm made of silk bolting cloth. Also, qualitative samples were collected by trawling a plankton tow net attached to a slow moving boat. Plankton filtered from such catch was washed into 1.5litre polytethylene bottles and were fixed immediately with 5 drops of 4% hemaxine-buffered formalin to preserve the organisms (Parsons et al., 1984). This was followed by addition of 3 drops of lugol’s solution and allowed to stand for 30 minutes in order to settle. The samples were kept in ice boxes at 4oC during transportation to the laboratory. All samples were taken at ebb tide to reduce tidal and diurnal variation. Enumeration and identification were performed using a zeis inverted microscope at x 400 and x 1000 magnification. Identification was done using guides provided by Newell and Newell (1977); Maosen (1978); APHA (1985) and Egborge (1973). RESULTS AND DISCUSSION The taxonomic listing of the phytoplankton species observed in the Cross River estuary during the study period is given in table 1, while the relative abundance of these organisms is shown in figure 2. A total of 105 species of 57 genera, belonging to 5 families were identified during the study. The family Bacillariophyceae (diatom) was the most abundant with 63 species, belonging to 32 genera. Similar observations of Bacillariophyceae abundance along Nigerian coastal waters have been reported by Nwadiaro and Ezefili (1986); Akpan (1997) and Ekeh and Sikoki (2004). This was followed by chlorophyceae with 28 species belonging to 14 genera and cyanobacteria with 13 species belonging 9 genera. This sequence however, deviated from the report of Ekeh and Sikoki (2004) which stated a higher abundance of cyanobacteria than chlorophyceae in New Calabar River. Euglenophyceae and Dinophyceae had 5 species and 2 species respectively, belonging to 3 and 2 genera respectively. The higher abundance of green algae in the Cross River estuary is attributable to the prevalence of fresh water in this estuary. Bacillariophyceae were more abundant in stations 5 and 6 (sampling Zone C) which is the lower reach of the estuary. This is probably due to higher concentration of silicates in this zone. Akpan (1997) reported a strong correlation between silicates and Diatom abundance. The chlorophyceae on the other hand, were more important in Stations 1 and 2 (Sampling Zone A) and in station 3, which are the upper and middle reach segments of the estuary, whereas this group was scantily represented in the lower reach stations 5 and 6 (Sampling Zone C). This can be explained on the basis of salinity gradient across the sampling zones with zone C having higher salinity than zone A. Fresh water algae have been reported to disintegrate at high salinities (Reynolds, 1993). Similarity, the Euglenoids were more important in stations 1, 2 and 3. Dinophyceae were absent from 1, 2 and 3. This can be attributed to the fact that Dinoflagellates are marine and estuarine species (Tait, 1981; Hickman et al., 2001). The Cyanobacteria showed no spatial bias whatsoever. The spatial distribution of phytoplankton in the Cross River estuary is given in Fig. 3. The index of dominance also showed that Bacillariophyceae were more dominant than all other phytoplankton species. Highest dominance value of 0.81 was recorded in sampling zone c, followed by 0.62 in sampling zone A, while the lowest value of 0.526 was recorded in sampling zone B. The lower diatom dominance in sampling zone B could be attributed to inhibition of further growth of diatom in this zone due to rapid uptake of silicates in the upstream zone A and subsequent slow mineralization. Chlorophyceae ranked next in dominance with higher values in sampling zone A. This was followed by Cyanobacteria, Dinophyceae and Euglenophyceae, respectively. The observed order of phytoplankton dominance in this study however deviates slightly from the reports of Chindah et al. (1993) and Ekeh and Sikoki (2004) which presented a sequence of Bacillariophyceae, Cyanobacteria, Chlorophyceae, Euglenophyceae and Dinophyceae, for Bonny River and New Calabar River respectively, within the Niger Delta. Taxa richness was highest in stations 5 and 6 (sampling Zone C) with values of 10.28 and 10.30 respectively, while the lowest taxa richness values of 5.90 and 5.63 were recorded in station 3 and 4 (Sampling Zone B) respectively. The higher taxa richness observed in the lower reach Sampling Zone C may be due to insurgence of seawater, bringing more species into this zone. Jaccard’s coefficient of similarly (Sj) showed that plankton communities in stations 1 and 2 were more similar (Sj = 0.74) than those of stations 1 and 3 (Sj = 0.59); stations 1 and 5 (0.32) and stations 2 and 6 (0.33). Comparison of stations 1 and 6 showed the lowest coefficient of similarity of 0.29. Analysis of variance showed significant variation (P < 0.05) in taxa occurrence between stations 1 and 5 and 1 and 6; whereas stations 2 and 5, 2 and 6 and 3, 4, 5 and 6 showed no significant variation P<0.05. High abundance of certain species of Cyanobacteria such as Lyngbya major, Anacystis cyanae, Oscillatoria sancta and Anabaena sp. Suggests conditions of environmental degradation. These species have been associated with aquatic pollution (APHA, 1985; Ubom and Essien, 2003; Ekeh and Sikoki, 2004; Khattak et al. 2005) a situation which has become a serious source of environmental concern in the area. An earlier report of the presence of Oscillatoria sp and Anacystis sp in the estuary (Akpan, 1997) showed much lower levels of abundance compared to the present study. This suggests increasing deterioration of the estuarine water. Table 1: Taxonomic listing and spatial distribution of phytoplankton species in Cross Rivers estuary. (+ = presence, - = absence)
Conclusion: The high levels of taxa richness and diversity of phytoplankton communities in the Cross River estuary provides a concise set of structural based criteria for assessment of the environmental status and productivity of this ecosystem. Furthermore, the high abundance of polluted water species of algae revealed in this study is indicative of increasing environmental degradation. Acknowledgement: The authors are indeed grateful to the Institute of Oceanography, University of Calabar for providing the laboratory facilities used for this study. REFERENCES
Copyright 2006 - Journal of Applied Sciences & Environmental Management | |||||||||||||||||||||||||||||||||||||||||||||||||||||||||||||||||||||||||||||||||||||||||||||||||||||||||||||||||||||||||||||||||||||||||||||||||||||||||||||||||||||||||||||||||||||||||||||||||||||||||||||||||||||||||||||||||||||||||||||||||||||||||||||||||||||||||||||||||||||||||||||||||||||||||||||||||||||||||||||||||||||||||||||||||||||||||||||||||||||||||||||||||||||||||||||||||||||||||||||||||||||||||||||||||||||||||||||||||||||||||||||||||||||||||||||||||||||||||||||||||||||||||||||||||||||||||||||||||||||||||||||||||||||||||||||||||||||||||||||||||||||||||||||||||||||||||||||||||||||||||||||||||||||||||||||||||||||||||||||||||||||||||||||||||||||||||||||||||||||||||||||||||||||||||||||||||||||||||||||||||||||||||||||||||||||||||||||||||||||||||||||||||||||||||||||||||||||||||||||||||||||||||||||||||||||||||||||||||||||||||||||||||||||||||||||||||||||||||||||||||||||||||||||||||||||||||||||||||||||||||||||||||||||||||||||||||||||||||||||||||||||||||||||||||||||||||||||||||||||||
