 |
| About Bioline | All Journals | Testimonials | Membership | News |
|
||||||
|
||||||
Journal of Applied Sciences & Environmental Management, Vol. 10, No. 2, 2005, pp. 5-10 Determination of Sulphur (IV) Oxide in Ilorin City, Nigeria, During Dry Season 1*ABDUL RAHEEM, A M O; 1ADEKOLA, F A; 2OBIOH, I B 1 Department of Chemistry University of Ilorin, P.M.B
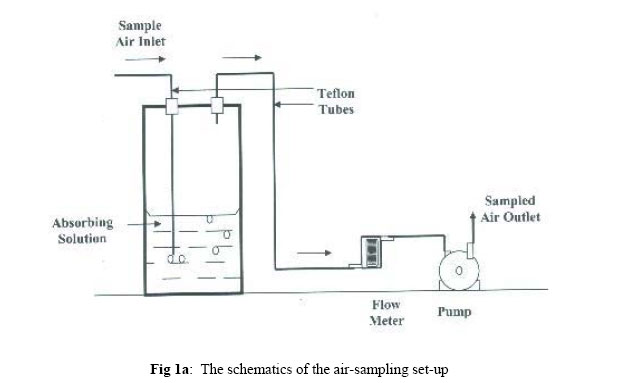
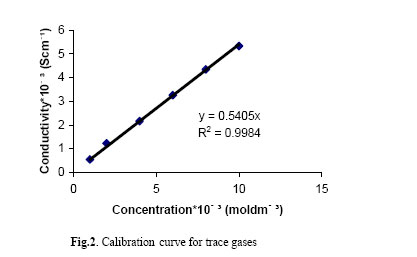
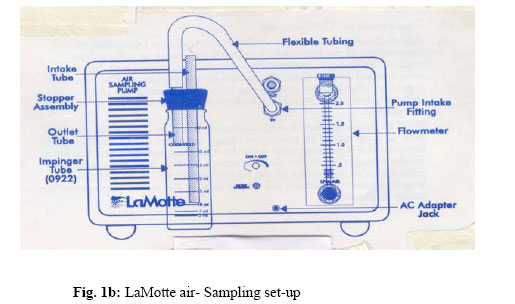
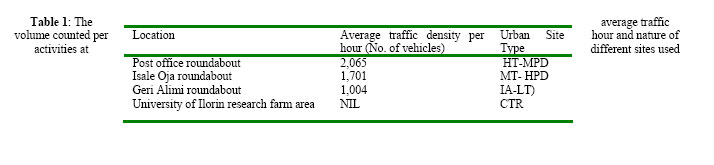
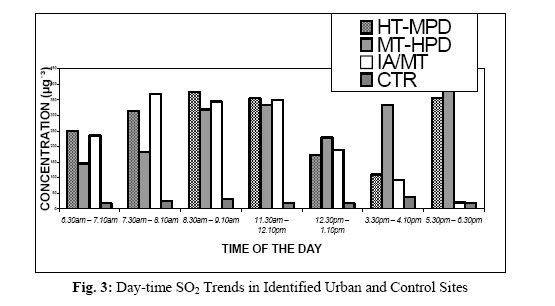
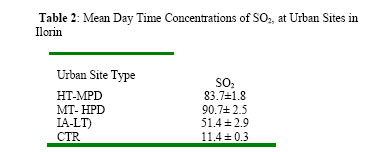
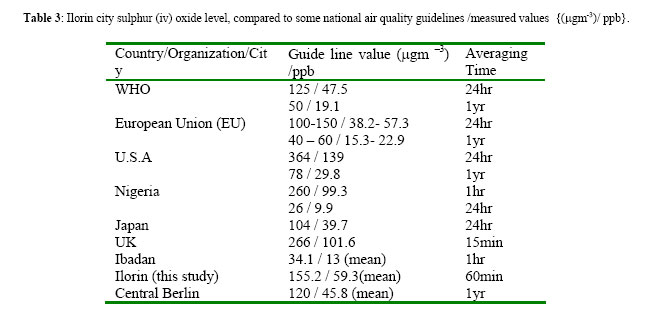
1515, Ilorin- Nigeria Code Number: ja06017 ABSTRACT: Ambient concentrations of sulphur (IV) oxide (SO2) have been determined in the city of Ilorin, Nigeria between mid February and mid Novembers 2003. SO2 levels were found to vary significantly with the traffic density and human activities. There was a significant difference (P = 0.05) between the SO2 concentrations at two sites (high and low traffic volume areas); however, there was no significant difference (P= 0.05) between high traffic/medium population density and medium traffic/high population density areas. The regression analysis indicated a strong correlation (r= 0.94) between the concentration of SO2 pattern and the hourly average traffic volume in all the sites. Average level found for the city was 59.3 ± 1.9ppb, which falls within the limits of the United States Environmental Protection Agency guidelines for air quality standards. Atmospheric pollution being one of the most dominant problems associated with urbanization, urban areas are associated with high density of industries and transport networks, among other infrastructure, which generate a wide range of air pollutants .@JASEM Generally, it is estimated that each year between 250 and 300 million tons of air pollutants enter the atmosphere above the United States as a direct results of human activities and the annual emission estimate for sulphur (iv) oxide is put at 130 million tones for industrialized Europe, Asia and USA as reported by Foell et al (1975) and UNECEP (1994). Globally, combustion processes emit an estimated 163 million tons on the basis of NOx while Environmental Protection Agency (EPA) estimates that nearly 23 million tons of NO2 are released annually into atmosphere of United States arising mainly from human activities. These pollutants, acting in concert rather than separately have been implicated in many forms of damage to vegetation, materials, aquatic resources, wildlife and human health according to USEPA (1971). Sulphur (iv) oxide pollution is known to inhibit photosynthesis in lower and higher plants. Also reproductive disorders, respiratory and cardiac problems in humans have been related to sulphur (IV) oxide pollution and it’s main source of acidity in rainfall, which causes a great damage on vegetation and materials as mentioned by Baumbach and Vogt (2003). If the concentration of SO2 is higher along with other gaseous pollutants in the troposphere and it accumulates over time, the overall concentration has a negative effect on health, vegetation and structures. This coupled with the dearth of reported works in the developing countries such as Nigeria gave impetus to our work, which focuses on monitoring and modeling of concentrations of SOx, NOx and ozone as total oxidants in different cities and rural areas of Nigeria of which this work is a part. MATERIALS AND METHODS Study Area: The ancient city of Ilorin is located on latitude 8° 20’N and longitude 4° 35’E, at an approximate altitude of 306 m above the mean sea level. The city, which is about 500km South-West of Abuja, the Federal Capital City of Nigeria, is strategically located in the Guinea Savannah belt of Nigeria, at what may be described as the geographical and cultural confluence of the Northern and Southern parts of the country. As a result of its location, Ilorin experiences two major seasons: dry and rainy. The persistence of either season is influenced by the absolute fraction of time during an annual cycle that the line of the Inter-Tropical Convergence Zone (ITCZ) or the Inter-tropical Discontinuity (ITD), as it is called in West Africa, is below or above its line of latitude. The dry season (under the influence of the north-east trade winds, when the ITD is south of the city), on the average, starts around the middle of October and lasts until the middle of April of the following year, though more pronounced between mid November and mid February. Rains initiated by predominance of southwest monsoon winds in the area, dominates the remaining six months of the year when the ITD lies north of the city. The dry season period is characterized, not only by near absence of rain, but also by transport of dust haze from the Sahara Desert into the region. The winds are generally cold because they form part of the Hadley cell, which are known to move equator-ward from the poles at ground levels, and pole-ward from the equator at upper levels. The Harmattan period, being wintertime in Europe, implies that very cold air, drafted across Europe through the Sahara, arrives in the sub-region, carrying the Sahara dusts with it. The season is characterized by high atmospheric turbidity, which inhibits the penetration of a significant fraction of the solar radiation to the earth’s surface. The city may be described as semi-industrial in the sense that, although a relatively large urban centre geographically by national standard, there seems to be very little presence of large scale industries that could qualify as major point sources. Hence, apart from the few industries, which are sparsely located, the rest of the city is dominated by mobile sources from the expanse of road network across the city, and area sources, which are a mix of residential, commercial and, medium to small scale industries. As for other major cities in the country, no strict demarcation exists between industrial, residential and commercial areas. The sampling locations were selected across the city to reflect the following categories of interest: High traffic volume/medium population density (HT-MPD) zones; Medium traffic volume / High population density (MT-HPD) zones; Industrial areas / Low traffic volume (IA-LT) zones, and Low population density / No traffic volume (LPD-NT) zone was used as control (CTR). The application of these techniques to the monitoring required the preparation of the following reagent as sampling and absorbing solution. In the preparation of the absorbing solution, 10.41g of sodium ethanoate 4.17cm3 ethanoic acids and hydrogen peroxide} (18.4cm3) were successively dissolved in distilled water. The solution was made up to the 1 litre mark on the volumetric flask. The pHof the absorbing solution was maintained at 5 in order to prevent the dissolution of carbon (IV) oxide along with SO2 into the absorbing solution. The details of the air sampling set up used have been described elsewhere by Lawani et al (1996). However, a brief overview of the schematic is presented in Fig 1a. The flow rate was slow, about (1000cm3min-1) and the volume of absorbing solution (30cm3) to ensure that the pollutants were given enough time to dissolve in the absorbing solution because of the low concentration. The sampling train was made completely airtight by use of silicon grease at all necessary joints. After each sampling of sixty minutes (60mins), the bubbler was removed carefully and the absorbent solution transferred into sample bottle for analysis. Reference samples, containing no sample were run along with the samples in order to take care of the sample matrix of the reagents used for the analyses. In order to determine pollutant variability over daytime periods, air sampling was undertaken at each location over seven defined sixty minutes periods for any sampling day. The seven sampling periods were equitably spaced between approximately 6 am and 6 pm. A minimum of 21 samples was collected at each site per week for the pollutant monitored. The time of sixty minutes was found from the preliminary investigations to be sufficient for the quantitative sampling of these gases within the environment of Ilorin. All samplings reported were carried out in triplicates. The sampling exercise lasted 12 weeks and precisely, between mid November and Mid February. Since road traffic is the common source cutting across all sites classes, the average traffic densities were determined for all sampling locations. Traffic counts were undertaken at hourly intervals. The daily minimum and maximum temperatures were between 23° C and 36.5° C, throughout the sampling time. Conductivity measurements were undertaken using the Hanna Instruments EC 214 Conductivity meter model. From the samples of absorbing and sampling solutions, approximately 20 cm3 were measured respectively into a liquid sample holder boiling tube of Hanna model Conductivity meter. The concentrations of the samples were picked from reference plot (Fig 2) got by the use of standardized tetra oxo - sulphate (vi) acid. All the results obtained were correlated and corrected with the use of a standard LaMotte air sampling kit and accompany reagents. The diagram is shown in Fig 1b RESULTS AND DISCUSSION The specific urban locations, and the site classification by type of activity as well as the results of the hourly traffic counts undertaken at the various urban sites where sampling were undertaken are presented in Table 1. This shows urban site classes, type HT-MPD represented by the Post Office Roundabout recorded the highest average traffic density of 2,065 vehicles per hour over the sampling period. The other two sites had 1,701 and 1,004 while the background site represented by the University of Ilorin Research Farm recorded no vehicle traffic throughout the sampling period. The average traffic density per hour at different sites used was 1,590 for the city. In order to relate traffic density with the diurnal variations in the monitored trace gas concentrations, the hourly average traffic flow density recorded over the entire day is presented in Table 1. Results of calibration curves obtained for the trace gas pollutant is presented in Figure 2 . Results show that the high traffic and medium population density (HT-MPD) and the medium traffic density and high population density (MT-HPD) zones are higher than the industrial areas by approximately 16% in respect of SO2 Function of the daytime trends in atmospheric concentrations of SO2 measured as a time of the day is presented in Fig 3. This shows that SO2 concentration reached a maximum value between 8.30a.m and 12.10pm, which corresponds to peak traffic periods with average traffic counts of 2,500 vehicles moved within the sampling period of 60minutes. The SO2 concentrations then decreased steadily until in the evening when the volume of vehicles increased towards a peak again. This is an indication that traffic density is one of the major contributors to atmospheric SO2 concentration in the city. In spite of this, sites HT-MPD and MT-HPD share nearly the same hourly mean concentrations, despite one being high traffic and the other, medium traffic. This shows that transportation is probably not the only key source. Rather, there appears to be significant contributions from the residential sector activities. These include the burning of fuel wood, charcoal and kerosene using domestic appliances, generation and burning of household wastes, as well as other stationary sources.This further supports the justification that the intensity of human activities and traffic volume are responsible for the level of SO2 recorded. Function of the daytime trends in atmospheric concentrations of SO2 measured as a time of the day is presented in Figure 3 . This shows that SO2 concentration reached a maximum value between 8.30a.m and 12.10pm, which corresponds to peak traffic periods with average traffic counts of 2,500 vehicles moved within the sampling period of 60minutes. The SO2 concentrations then decreased steadily until in the evening when the volume of vehicles increased towards a peak again. This is an indication that traffic density is a major contributor to atmospheric SO2 concentration in the city. Despite this, sites HT-MPD and MT-HPD share nearly the same hourly mean concentrations, despite one being high traffic and the other, medium traffic. This shows that transportation is probably not the only key source. Rather, there appears to be significant contributions from the residential sector activities. These include the burning of fuel wood, charcoal and kerosene using domestic appliances, generation and burning of household wastes, as well as other stationary sources. This further supports the justification that the intensity of human activities and traffic volume are responsible for the level of SO2 recorded The Ilorin city oxides of sulphur concentration level compared with those obtained for other cities of the world as shown in Table 3. The values of emission of SOx in other part of the world quoted ranges from 38.2-57.3 in European Union to 139 ppb in U S A. The value got for Ilorin fell within the range of other cities of world cited as well as the hourly guide value for Nigeria, however the value got for Ibadan as reported by Onianwa et al (2001) looks too low, this probably could be attributed to the attenuation effect of rain, during sampling . Conclusions The results of this study have provided estimate of the mean concentrations of sulphur (iv) oxide daytime trends. Results show conductivity techniques could be used to obtain results useful in supporting air quality management decisions, as well as in-depth understanding of the source strengths, and potential impacts. Results presented are however, preliminary. Much research and more spatial and temporal assessments are still needed to improve the understanding of the air quality potential and options for control in the city and through- out Nigeria. Acknowledgement We wish to thank Global Change System for Analysis Research and Training (START) USA for taking the credit of sponsoring this work and further work of ours, on pollution in Nigeria. REFERENCE
Copyright 2006 - Journal of Applied Sciences & Environmental Management The following images related to this document are available:Photo images[ja06017t3.jpg] [ja06017f3.jpg] [ja06017f1b.jpg] [ja06017f1a.jpg] [ja06017t1.jpg] [ja06017f2.jpg] [ja06017t2.jpg] |
| |||||||||
