 |
| About Bioline | All Journals | Testimonials | Membership | News |
|
||||||
|
||||||
Journal of Applied Sciences & Environmental Management, Vol. 10, No. 2, 2005, pp. 83-89 Use of Experimental Design for Peuhl Cheese Process Optimization 1KRA SEVERIN ; 1*ASSIDJO N. EMMANUEL; 2DIOPPOH K. JACQUES ; 3CARDOT PHILIPPE 1Laboratoire de Nutrition et de
Technologie Alimentaire, Département Génie Chimique et Agro-Alimentaire, Institut
National Polytechnique Houphouët-Boigny, BP 1313Yamoussoukro, Côte d’Ivoire, ABSTRACT This work points out the use of experimental design for peulh cheese making process optimisation. Peulh cheese, a milk coagulum, well-known in certain West African countries (e.g. Benin), is unfortunately ill-known in Côte d’Ivoire (Ivory Coast). However, it could be a transformation way of milk. This work consisting in use of a central composite design enables the determination of optimal process conditions concerning: leaf extract volume added (7 mL), heating temperature (84.12°C) and heating time (15 min). When these optimal conditions are reached, the maximal value for process yield is 58.88%, the minimal value for TCB is 6.40 min and the value found for total solids is 42.75%. Furthermore, this work has showed that the experimental design is more suitable than the traditional study method called “one factor at a time”. @JASEM Since two decades, the Côte d’Ivoire (Ivory Coast), has initiated an intensive development program, in the purposes of (DCGTX and MINAGRA, 1988):
The development and promotion policy that have followed, supported by different organisms, have improved the installation of several agro-pastoral firms which diary production is today in constant development. Unfortunately, the farmers’ social life conditions constitute one of the major obstacles for the promotion and the industrial transformation of this production. Most of cattle breeders, after unsuccessful tentative to sell their diary production, pour it in the nature. Face to this situation, the emergency of finding out a conservation method of milk is needed. Then, the traditional technique of cheese making well known in the West African region, but few known in Côte d’Ivoire, appears to be the appropriate solution to save milk produced by farmers, especially in rainy period (Kees et al., 1996). The cheese making process that, essentially consists in a coagulation of raw milk by sap or leaf extract of a tropical green plant (Calotropis procera), gives a coagulum, which is used in sauce by certain populations (Kees et al., 1996). This cheese could consequently improve food quality in rural environment. Due to the interest that could present the result of such a transformation, the purpose of this work is to optimize the making process by a random combination of the different parameters that can influence it. THEORY The experimental design is a statistical tool which purpose is to point out relationships that can exist between a dependent variable (response) and factors (parameters) [Massart et al., 1988; Cochran and Cox, 1992). It consists in studying these relationships by varying together all factors under study, and to appreciate the effect of these variations on the response. This methodology can also put in evidence eventual interactions between factors (Cox, 1992). Different experimental designs exist. But they can essentially be divided in two groups (Cochran and Cox, 1992): · first degree designs This group is composed of designs whose main hypothesis is the linearity that exists between the response and every factor. Therefore, only two points (or two levels) are sufficient to establish the relationship between these two types of variables (i.e. response and factors). Designs frequently used in this group are the complete factorial designs (CFD) or fractional ones (FFD) 2k or 2k-p, respectively; with k the number of factors and p the number of fractionation. · second degree designs When the linearity hypothesis is not respected anymore, the second degree designs are, then, those used. The most used in this group is the central composite design whose composite matrixes enable the estimation of second degree polynomial model coefficients. This model is defined as following:
The central composite design is divided in three sub-sets (Feinberg, 1996):
as shown in table 1, representing a 3 factors experimentation matrix, in coded values. MATERIALS AND METHODS Cow milk: Milk samples (about 1 L each) used in this study, were drawn from healthy cows in a modern farm in Yamoussoukro city (in the centre of Côte d’Ivoire). Samples drawn were preserved at 8°C. Two hours prior analyses, they were set at ambient temperature (25°C). Raw extract of C. procera: Leaves of C. procera of about 10g (10 to 12 leaves) were harvested from plants in the Agronomy High School (ESA/INP-HB) arboretum. Each leaf is weighted on a Sartorius balance (Sartorius Gmbh, Göttingen, Germany), carefully washed, wiped up and cut in small pieces before grounding. Ground obtained was pressed with the help of a press (Pers, Paris, France). The obtained extract was filtered on Millipore (0.5 µm diameter) filters (Millipore Corporation, Bedford, MA, USA). Filtered juice constituted the raw extract that was mixed to a quantity of milk for the cheese making. Experimental design The cheese making optimization was operated using a 3 factors central composite design. The chosen factors were:
When fixing the different experimental domains, the experimentation plan obtained was summarised in table 2. Tests were made in a random order and the responses determined were:
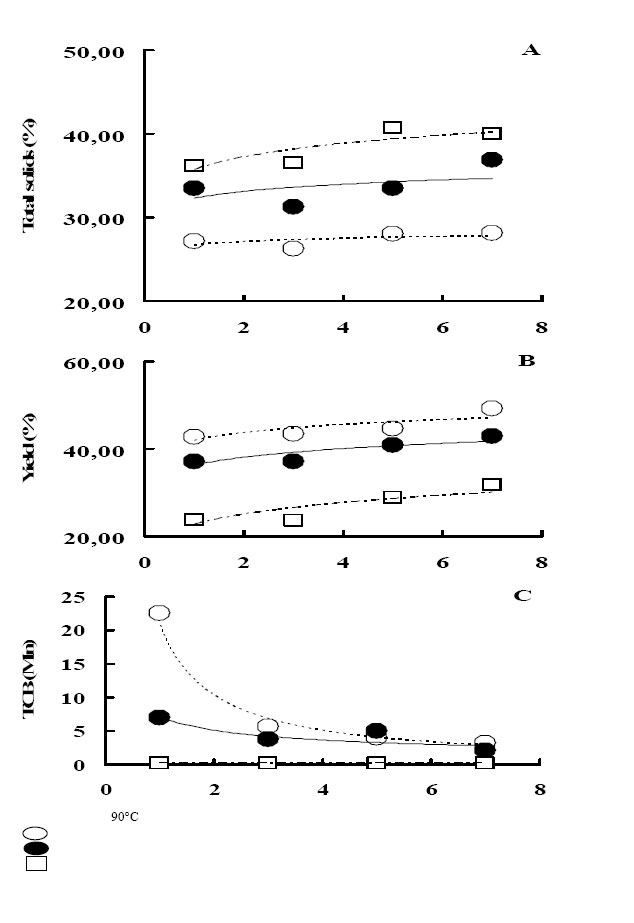
Total solids and ash rates were determined using Afnor norms (AFNOR, 1980; Brochet, 1982), whereas, the TCB was obtained using a formagraph (Delacroix-Buchet et al., 1994; Zannoni and Annibaldi, 1981). Coefficients of the second degree polynomial were calculated via the multiple linear regression procedure programmed in the Excel 2000 (Microsoft France, Meylan, France) software. Peulh cheese making: According to conditions in table 2, a certain quantity of raw extract (e.g. 4.5 mL) was mixed to 100 mL milk. Then, the mixture was heated to the required temperature during a certain time. The coagulum obtained was separated from the surfacing whey and then weighted. RESULTS AND DISCUSSION Before optimising the transformation of milk to peulh cheese, preliminary studies were made varying heating temperature and the leaf extract volume; each parameter at a time. Thus, the milk samples were mixed with a certain quantity of leaf extracts (i.e. 1, 3, 5 and 7 mL) and heated at 70, 80 and 90 °C respectively. The results obtained are plotted in Figure 1. The analysis of Figure 1A shows that total solids rate varies slight linearly according to the extract concentration. For instance, at 80°C, the cheese total solids rate ranges from 33.48 ± 0.32% to 36.84 ± 0.40%. This slight increase lets suppose that the total solids is constant while the extract concentration increases. In order to confirm or infirm this assertion, an ANOVA study was performed and the results presented in table 3. It appears clearly, concerning total solids, that no significant difference can be observed, in all cases, because the tabulated values of Fisher coefficient are superior to the calculated ones (Feinberg, 1996). This result confirms therefore that total solids rate is constant whatever the leaf extract concentration. Nevertheless, when considering the effect of temperature, at constant volume, Figure 1A shows also that total solids increases with the increase of the temperature. It can be noticed that this increase is about 0.85 % when the temperature increases of 10°C. When analysing Figure 1B, it appears that cheese yield increases, as total solids does, linearly according to the extract concentration increase. But, in this last case, its evolution is more pronounced as shown by ANOVA analysis in table 3. Thus, the cheese yield is not constant when the extract volume increases. In addition, when temperature is lower (e.g. 70°C), the cheese making yield is higher; while the total solids rate is lower. This observation can be due to the fact that when heating temperature is lower, protein insolubilisation phenomenon is slower enabling the imprisoning of more milk constituents. But when the heated temperature is higher (e.g. 90°C), it denatures very quickly the milk proteins that are therefore practically alone in the coagulum (Nuñez et al., 1989; Brulé et al. 1997). The Figure 1C presents the TCB evolution. The analysis of this figure shows that, at 70°C, TCB decreases exponentially from 22.60 to 3.25 minutes when the extract concentration varies from 2 to 7% (v/v). But, when the temperature increases, the exponentially decrease of TCB is less pronounced. Thus, at 80°C, its value goes from 7.00 to 2.10 minutes. At 90°C, this evolution seems to be constant at about 30.00 seconds (0.50 min). This result confirms the instantly coagulation of milk protein at higher temperature, as previously explained. This approach that consists of varying a factor and maintaining the others at constant level, to study its effect on the response, does not enable to point out eventual interaction that can exist between factors. In addition, as it is difficult to find out in this case the optimal conditions to make Peulh cheese, an experimental design is necessary. But, as it is visible that all responses do not vary linearly according to the factors studied (e.g. temperature, concentration), a second order design (e.g. CCD) must be used (Cox, 1992; Feinberg, 1996).
Cheeses making were performed according to table 2 conditions. The different responses determined are presented in table 4. When analysing this table, a variation of different responses values can be observed. Thus, the total solids rate varies from 29.36 to 49.37 %. Whereas the ash one ranges from 0.91 to 1.29 %. Concerning the process yield and the TCB, their values vary respectively from 44.09 to 61.98 % and from 7.00 to 22.00 min. This observed variation points out that factors, under study, influence the responses obtained. However, is this influence proven? What is the real part of each factor in the global influence on the peulh cheese making? Using the multiple linear regression method (Draper and Smith, 1998), the mathematical model (1) coefficients were determined according to the studied response and the results are summarized in table 5. It appears, when analysing this table that coefficients vary from -0.037 to 1.063, from 3.578 to 44.472 and from 1.212 to 50.378 respectively for ash, total solids and cheese yield. The TCB coefficients range from -3.967 to 10.430. The associated probabilities range globally from 0.000 to 0.973. The probability plotted in the table represents the probability to be mistaken while accepting the coefficient as significant. If we take account minimal risks to make a mistake of 10 % (probability = 0.10)
as recommended by Feinberg (1996), it appears that the significant coefficients and their corresponding parameters that have an influence on the response and must therefore be kept in the final mathematical model are:
Thus, if the coefficients are replaced by their real values, the different final equations are as follows:
+1.346X22
It appears that, whereas the total solids rate depends on the quadratic term of temperature, the ash rate depends on no parameter. Therefore, for the later (ash rate), whatever the variation, no consistent variation effects can be observed. But, when the heating temperature increases, the total solids rate increases till an optimal value of 44.472% before decreasing. The process yield depends on the added volume quadratic term. Therefore, when the later increases in the limits of the experimental design, the former firstly decreases from 58.880 to 50.378% before increasing till the initial value (58.880%). Thus, to optimise the process yield, volume must be set at its lower or upper values (i.e. 2 or 7 mL). In addition, the other parameters can be fixed to their lower values (i.e. 70°C, 15 min) because the yield of the process does not depend on them.
Concerning coagulum TCB, the model equation reveals that it is influenced by the simple and quadratic terms of heating temperature, the simple term of volume and the interaction of both factors. Two of the coefficients obtained are negative and, the interaction and the quadratic terms ones are in contrary positive. Consequently, when coagulant volume increases, the TCB decreases. On the other hand, when the temperature increases, at a constant volume (e.g. 5 mL), this response decreases from 18.81 minutes to 9.06 minutes before increasing. To determine the optimal conditions to find an optimal (minimal) value of the TCB, derivative must be used. When using this method, the equation found is as follows:
It appears that the value of X2 depends on that of X1. But, as to find a minimal value of TCB, one must use a high value of coagulant volume (i.e. 7 mL), the coded value of X2 is then 0.693. This result corresponds in real value to 84.12°C, leading therefore to a TCB minimal value of 6.40 minutes. It can also be observed that no significant influence of heating time can be noticed, whatever the response studied. Otherwise, in the limit of the experimental domain, it is few important to heat the mixture at longer (20 min) or shorter (15 min) time. But for economic purpose, it is obvious that using the shorter time is recommended.
Are these results different from those previously obtained when using the “one factor at a time” method? In order to answer to this question, values obtained from both methods were grouped by defined temperature and the Fisher F coefficients were calculated and presented in table 6. It appears that, all F coefficients calculated concerning total solids and process yield are inferior to those tabulated, indicating therefore that both methods draw equivalent results. But, it can be noticed that for TCB, all the F coefficients are superior to the tabulated ones. This remark leads to conclude that for this response, the results produced by both methods are different. The discrepancy observed can be related to the presence of interaction in the last method, what can not appear with the first method. The CCD is, therefore, more suitable because it can point out eventual existence of interaction between factors. Conclusion At the end of this work, we can note that when the coagulant added volume and the heating temperature vary, certain responses (i.e. total solids, process yield and TCB) vary also, whatever the method used for the study. Concerning the ash rate, it was found constant even if the factors under study vary. Nevertheless, all results do not show any influence of the heating time on any response. It is therefore useful, in order to make cheese, to heat during shorter time the mixture of milk and C. procera leaf extract. This duration is 15 minutes in our case. The optimal conditions found are as follows:
When the optimal conditions are reached, the maximal value for process yield is 58.88%, the minimal value for TCB is 6.40 min and the value found for total solids is 42.75 %. But the best value for total solids (44.472 %) is reach when the X2 factor is set at 80°C. The results obtained using experimental design are found to be equivalent to those obtained with the so-called “one factor at a time” method above all for total solids rate and yield. But, for TCB results, a discrepancy exists between both methods because of interaction between factors that was pointed out by the experimental design method. This last method is therefore more suitable for optimisation study.
REFERENCES
Copyright 2006 - Journal of Applied Sciences & Environmental Managemen The following images related to this document are available:Photo images[ja06029t6.jpg] [ja06029f1.jpg] [ja06029t4.jpg] [ja06029t1.jpg] [ja06029t5.jpg] [ja06029t3.jpg] [ja06029t2.jpg] | ||||||||||||||||||||||||||||||||||||||||||||||||||||||||||||||||||||||||||||||||||||||||||||||||||||||||||||||||||||||||||||||||||||||||||||||||||||||||||||||||||||||||||||||||||||||||||||||||||||||||||||||||||||||||||||||||||||||||||||||||||||||||||||||||||||||||||||||||||||||||||||||||||||||||||||||||||||||||||||||||||||||||||||||||||||||||||||||||||||||||||||||||||||||||||||||||||||||||||||||||||||||||||||||||||||||||||||||||||||||||||||||||||||||||||||||||||||||||||||||||||||||||||||||||||||||||||||||||||||||||||||||||||||||||||||||||||||||||||||||||||||||||||||||||||||||||||||||||||||||||||||||||||||||||||||||||||||||||
| |||||||||
