 |
| About Bioline | All Journals | Testimonials | Membership | News |
|
||||||
|
||||||
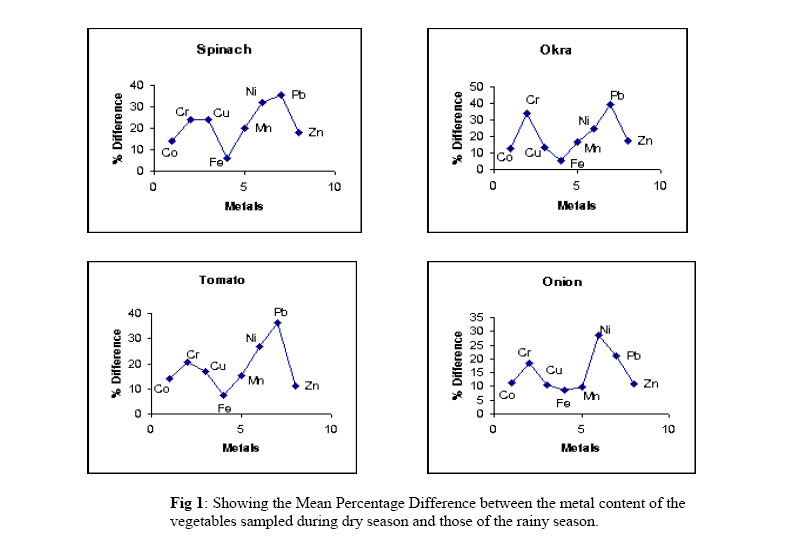
Journal of Applied Sciences & Environmental Management, Vol. 10, No. 2, 2005, pp. 105-109 Variation in Metal Contents of Plants in Vegetable Garden Sites in Kano Metropolis *AUDU, A A; LAWAL, A O Department of Chemistry, Bayero University, P. M. B. 3011, Kano, Nigeria Code Number: ja06033 ABSTRACT The concentrations (mg/Kg) of Cr, Co, Cu, Fe, Mn, Ni, Pb and Zn were determined in seven different vegetables which were obtained from sharada, kwakwachi and Jakara irrigation gardens in the Kano metropolis using Atomic Absorption Spectrophotometry (AAS). Samples were collected during both dry and rainy seasons. The mean levels of metals obtained ranged widely from 0.34 mg/Kg Cr to 27.35 mg/Kg Fe. The relative abundance of metals in vegetables analyzed followed the sequence Fe > Zn > Mn > Cu > Ni > Pb > Co > Cr. Reductions of metal levels ranging from 8.25% Fe in onion to 45.19% Ni in Okra were recorded in rainy season samples over those of the dry season. @JASEM Metallic elements are ubiquitous in the environment. Some trace heavy metals are significant in nutrition, either for their essential nature or their toxicity. Metals such as chromium, cobalt, copper, iron, manganese and zinc are essential with known biochemical functions (Underwood 1971) while lead is non-essential with toxic effects (Hind, 1972). Evidence of requirement for nickel has been obtained in experiments with animals (Clarkson, 1972). Metals may enter the food chain from soil through mineralization by crops or environmental contamination, as in application of agricultural inputs such as pesticides and fertilizers or in the treatment of soils with sewage sludge Copper content of normal plant tissues varies according to species but is usually within the range 1-25mg/Kg dry matter (Walsh, 1971). It is toxic to man at concentration of 250mg/day (Bowen, 1979). In soils copper reduces the enzymatic activities and it is particularly toxic to lower organism and has been used as an algaecide in lakes (Hewitts, 1966). The iron content of normal plant tissue varies according to species but, it is usually within the range 20-200mg/Kg dry matter (Walsh, 1971).. The role of manganese in plants is undoubtedly catalytic, but, it is also related in some ways in chlorophyll synthesis (Epstein 1972). It is toxic to plants at concentration range of 1-99mg/L depending on the plant species (Walsh, 1971). The levels of chromium in plants are less than 1 or 2µg/g dry matter even when growth is reduced by toxicity (Gambi, 1982). Cobalt is essential for dinitrogen fixation by rhizobium in legume nodules. There is no evidence that higher plants have a direct requirement for the metal (Russell, 1988). However, cobalt has been found in legumes, spinach, cabbage, lettuce, beet greens and figs (Elson and Haas, 2001). The cobalt content of normal plants is usually within the range 0.01-1.00mg/Kg dry matter (Walsh, 1971). Lead is toxic to plants at concentration range of 3-20ppm depending on plant species, to animals at a concentration of 1mg/day, and human at 10 g/day (Bowen, 1979). Zinc is an essential element involved in metabolic functions, and is important for both man and plant health growth (Jeffery, 1992). Although, sludge treatment usually results in elevated zinc levels, plants do not accumulate zinc to a degree that would be toxic to animals or humans (Jeffery,1992). The zinc content of normal plant tissues varies according to species, but, it is usually within the range 5-300mg/Kg dry matter (Walsh, 1971). Accurate and adequate food composition data are invaluable for estimating the adequacy of intakes of essential nutrients and assessing exposure risks from intake of toxic non essential elements (Onianwa et al., 2001). In many less developed countries such data are not readily available (Hoover and Pelican, 1984). The aim of this study is to estimate the metal contents in vegetables cultivated in Sharada, Kwakwachi and Jakara irrigation gardens in Kano metropolis and determine the trend of the concentration of these metals in each of the vegetables sampled. The metals of interest include cobalt, chromium, copper, iron, manganese, nickel, lead and zinc. MATERIALS AND METHOD Analytical reagent (AnalaR) grade chemicals and distilled water were used throughout the study. All glassware and plastic containers used were washed with detergent solution followed by 20% (v/v) nitric acid and then rinsed with tap water and finally with distilled water. Sampling and Sample Treatment:The vegetables analyzed include spinach, lettuce, cabbage, okra, tomatoes, onions and carrots. Samples were collected twice in the year 2002 from three different farms in each site. The first round of sampling was carried out in May towards the end of the dry season while the second round was carried out in September towards the end of the rainy season. Each sample was randomly handpicked, wrapped in a big brown envelope and labelled with date and site. In the laboratory, each sample was washed with tap water (Burton and Patterson, 1979) and thereafter with distilled water and then dried in an oven at 80oC (Larry and Morgan, 1986). Each sample was grounded and sieved to fine powder and finally stored in 250cm3 screw capped plastic jar and labeled appropriately for analysis. Digestion Procedure: A 2.0g of the sample of the vegetable (in duplicate) was weighed out into Kjedahl flasks, mixed with 20cm3 of a mixture of sulphuric acid, perchloric acid and nitric acid in the ratio 1 : 4 : 40 by volume respectively, and left to stand overnight (to prevent excessive foaming). Thereafter, the flasks were heated moderately at 70oC for about 40 minutes and then gradually increased to 120oC. The mixture turned black after a while and the digestion was complete when the solutions became clear and white fumes appeared (Erwin and Ivo, 1992). The digests were diluted with about 20cm3 of distilled water and boiled for another 15minutes. These were then cooled and transferred into a 100cm3 volumetric flask and diluted to the mark with distilled water. The sample solutions were then filtered into screw capped polyethylene bottles, and used for analysis. This procedure was repeated for all other samples. Instrumental Analysis: An Alpha 4 model atomic absorption spectrometer equipped with a digital read-out system was used for the determination of the metal concentrations. Working standards were prepared by further dilution of 1000ppm stock solution of each of the metals. A calibration curve was constructed by plotting absorbance versus concentration. By interpolation, the concentrations of the metals in sample digests were determined. RESULTS AND DISCUSSION The metal contents obtained from each vegetable sample from different sites are listed in Table 1. Among the seven different vegetables analyzed spinach recorded highest levels of Pb, Ni and Mn which are 1.60, 2.02 and 5.79 mg/Kg respectively. From the results, the general trend for the mean levels of metal analyzed in spinach samples from both the irrigation and control sites for both dry and rainy seasons showed that: Fe > Zn > Mn > Ni > Pb > Cu > Co > Cr. This observation is similar to that shown by Pushpanjali and Santosh (1995) in which spinach recorded highest retention capacity for Mn among the vegetables analyzed. The results also showed that the mean percentage difference of metals during rainy season when compared with the values in dry season indicated a sequence: Pb > Ni > Cu > Cr > Mn > Zn > Co > Fe. The sequence showed low percentage difference for essential metals (such as Mn, Zn and Fe) which recorded 19.91, 18.13 and 6.24% difference respectively, and high percentage difference for toxic metals (Pb, Ni and Cr) which recorded 35.28, 32.09 and 23.88% difference respectively (Fig 1). The mean levels of metals in the Okra samples for dry season were found to be in the order: Fe > Cu> Zn > Mn > Ni > Pb > Co > Cr; while those of the rainy season indicated: Fe > Cu > Zn > Mn > Ni > Co > Pb > Cr. The trends suggest that okra has a high retention capacity for iron and copper. In fact, among the seven vegetables analyzed, Okra recorded the second highest copper content in both dry (6.74 mg/Kg) and rainy (5.45 mg/Kg) seasons while, it recorded the second highest levels of chromium (0.74mg/Kg) and cobalt (0.97mg/Kg) in the dry season. It could also be observed that okra has higher retention capacity for essential metals (Fe, Cu, Zn and Mn) than the toxic ones (Pb, Cr and Ni). This is confirmed from the mean percentage difference of metals from Okra during rainy season when compared with their levels in dry season samples which indicated the trend: Pb > Cr > Ni > Zn > Mn > Cu > Co > Fe. Among the seven vegetables analyzed Onions recorded highest mean levels for iron (27.35mg/Kg), copper (7.50 mg/Kg), zinc (18.89 mg/Kg) and cobalt (1.14mg/Kg), but, the lowest level for manganese (0.75mg/Kg) (Table 1). The sequence for the mean metal levels in Onions for both dry and rainy seasons indicated: Fe > Zn > Cu > Mn > Co > Pb > Ni > Cr. This is similar to the earlier observation by Onianwa et al. (2001) where onions recorded highest retention capacity for copper and zinc among the vegetables analyzed. Similarly, Pushpanjali and Santosh (1995) results indicateded that onions recorded the highest retention capacity for iron among the various vegetables analyzed. The trend for the mean percentage difference for metals from rainy season Onions when compared with dry season samples indicated: Ni > Pb > Cr > Co > Zn > Cu > Mn > Fe. This has shown more retention of essential metals (Zn, Cu, Mn) than the toxic ones. Table 1A: Average Level of Heavy Metals (mg/Kg) in Vegetables In The Dry Season.
KEY: SRD = Sharada KKC = Kwakwachi JKR = Jakara Sp = spinach Ok = okra On = onion Tm =tomato Lt = lettuce Cb = cabbage Ct =carrot
Tomatoes have low copper and zinc contents and high lead content. It recorded the second highest level in the amount of manganese (5.39mg/Kg) and lead (1.56mg/Kg) absorbed, but with the least in the level of zinc (1.30 mg/Kg). The mean levels of metals in tomatoes for both dry and rainy seasons were found to be in the order of: Fe > Mn > Zn > Pb > Ni > Cu > Co > Cr. The sequence for the mean percentage difference in the levels of metals from rainy season Tomato samples compared with those of the dry season showed that: Pb > Ni > Cr > Cu > Mn > Co > Zn > Fe.Lettuce generally recorded relatively high level of toxic metals. It recorded the highest level of chromium (0.87mg/Kg), the second highest level of nickel (1.52 mg/Kg) and the third highest levels of lead (1.46 mg/Kg) and cobalt (0.87mg/Kg). It recorded relatively moderate levels of essential metals. For instance, lettuce recorded the second highest level of iron (21.86 mg/Kg)) and third highest levels of copper (1.63 mg/Kg), manganese (4.87 mg/Kg) and zinc (5.45 mg/Kg). The trend for the mean levels of metals in lettuce was found to be: Fe > Zn > Mn > Cu > Ni > Pb > Co > Cr. Cabbage generally recorded relatively low levels of almost all the metals. It recorded the second to the least in the levels of iron (3.64 mg/Kg), nickel (0.61 mg/Kg), lead (0.46 mg/Kg) and the least for cobalt (0.10 mg/Kg) and chromium (0.10 mg/Kg) (Table 1). The mean levels of metals in cabbage were found to be in the order: Fe > Zn > Mn > Cu > Ni > Co > Pb > Cr. Carrots recorded the lowest in the levels of two of the toxic metals, Pb (0.36 mg/Kg), and Ni (0.41 mg/Kg). Among the essential metals it also recorded the least value for Iron (3.45 mg/Kg) and the second to least for manganese (0.93 mg/Kg) and zinc (0.75 mg/Kg). Trend for the mean metal levels in carrots was found to be: Fe > Zn > Mn > Cu > Co > Ni > Cr > Pb Table 2: Comparison of metal levels (mg/Kg) in vegetables analyzed in this study with the levels in similar studies elsewhere
a = Onianwa et al.(2001), b = Erwin and Ivo (1992), c = Elson and Haas (2001), d = Pushpanjali and Santosh (1995), e = Pennington et al. (1995), f = John and Stephen (1982 From this study, the mean relative abundance of metals as recorded by vegetables analyzed generally indicates that: Fe > Zn > Mn > Cu > Ni > Pb > Co > Cr. This correlated with the results of Pennington et al (1995), which indicated the level of Fe, Mn, Cu and Zn in vegetables in the order Fe > Zn > Mn > Cu; Zwarich and Mills (1982), observed a sequence of Zn > Cu > Pb in lettuce, carrots and peanuts. Onianwa et al (2001), also indicated the sequence Zn > Cu in vegetables; and Pushpanjali and Santosh (1995) reported the levels of Fe, Zn, Cu and Mn in fresh vegetables in the order of Zn > Fe > Mn > Cu. The high concentrations of iron recorded by all vegetables analyzed coupled with its lowest percentage loss from plants recorded during rainy season can be attributed to its role in chlorophyll synthesis in plants in addition to its relative abundance in the earth crusts. Authors like Brown, (1982) and Onianwa and Egunyomi, (1983) have also noted this observation. The relative low concentrations of manganese may be due to its catalytic role in plants or low retention ability (Brown, 1982). The vegetables analyzed generally show higher retention capacity for essential metals (Zn, Mn and Cu) than for the toxic ones (Ni, Pb, Cr and Co). However, the levels of metals found in vegetables analyzed in this study fall within the range in reported literature values (Table 2.0). Acknowledgement The authors appreciate the assistance of Mal. Musa G. Beli of the Central Laboratories Complex, Bayero University, Kano. Conclusion The results indicate that: onions recorded relatively high levels of Fe, Cu, Zn and Co; spinach, lettuce and tomatoes recorded relatively high levels of Ni and Pb; while cabbage and carrots recorded relatively low levels of all the metals studied. REFERENCES
Copyright 2006 - Journal of Applied Sciences & Environmental Management The following images related to this document are available:Photo images[ja06033t2.jpg] [ja06033t1.jpg] [ja06033f1.jpg] | ||||||||||||||||||||||||||||||||||||||||||||||||||||||||||||||||||||||||||||||||||||||||||||||||||||||||||||||||||||||||||||||||||||||||||||||||||||||||||||||||||||||||||||||||||||||||||||||||||||||||||||||||||||||||||||||||||||||||||||||||||||||||||||||||||||||||||||||||||||||||||||||||||||||||||||||||||||||||||||||||||||||||||||||||||||||||||||||||||||||||||||||||||||||||||||||||||||||||||||||||||||||||||||||||||||||||||||||||||||||||||||||||||||||||||||||||||||||||||||||||||||||||||||||||||
| |||||||||
