 |
| About Bioline | All Journals | Testimonials | Membership | News |
|
||||||
|
||||||
Journal of Applied Sciences & Environmental Management, Vol. 10, No. 2, 2005, pp. 121-127 Evaluation of Heavy Metals Loading of River Ijana in Ekpan – Warri, Nigeria *1EMOYAN, O O; 1OGBAN, F E.; 2AKARAH, E 1aDepartment of Chemistry, Delta State University, Abraka. Nigeria.Email-
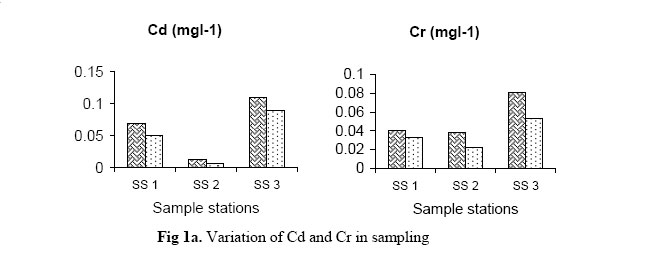
onostica_pub@yahoo.com Code Number:ja06036 ABSTRACT The concentration of Cadmium (Cd), Chromium (Cr), Copper (Cu), Iron (Fe), Nickel (Ni), Lead (Pb) and Zinc (Zn) which may affect human health and the “health” of the aquatic ecosystem were determine in the River Ijana Ekpan, using a pye unicam Atomic Absorption Spectrometry SP model 2900. The level of heavy metal in the study area varied between Cd (0.010 ± 0.004mgl-1) and (0.100 ±0.014mg1-1); Cr (0.037 ± 0.006mg1-1) and (0.067 ± 0.020mg1-1), Cu (0.020 ± 0.004mg1-1) and (0.050 ± 0.029mg1-1); Fe (0.046 ± 0.007 mg1-1) and (0.229 ± 0.008mg1-1); Ni (0.030 ± 0.004mg1-1) and (0.080 ± 0.010mg1-1); Pb (0.025 ± 0.006mg1-1) and (0.058 ± 0.008mg1-1) and Zn (0.088 ± 0.012mg1-1) and (0.122 ± 0.007mg1-1). The concentration of these parameters of pollution contained in the study area (SS1–SS3) indicated that the River is fairly polluted. The possible sources of these parameters of pollution are diverse: originating from anthropogenic / natural and point sources. @JASEM Due to hydrodynamics, inland aquatic ecosystems are interconnected from the atmosphere to the sea, and as a result of their physical, chemical and biological characteristics they exhibit a high natural variability. They are therefore more susceptible to anthropogenic influence than the more consistent and stable marine ecosystems (Rainbow and Dallinger, 1993). The ability of a water body to support aquatic life as well as its suitability for other uses, depends on many trace elements. Some metals such as Manganese, Zinc, Copper, Iron, Nickel, when present in trace concentrations are important for the physiological functions of living tissue and regulate many biochemical processes (Rainbow and White, 1989; Sanders, 1997). Generally, trace amounts of metals are always present in freshwaters from the weathering of rocks and soils. In addition, industrial wastewater discharges and mining are major sources of metals in freshwaters. Through precipitation and atmospheric deposition, significant amounts also enter the hydrological circle through surface waters (Merian 1991; Robinson, 1996). Some metals when discharged into natural waters at increased concentration in sewage, industrial effluent or from mining and refining operations, can have severe toxicological effects on aquatic environment and humans. (Merian, 1991; DWAF, 1996). In addition, heavy metals become toxic when a level is reached when it damages the life functions of an organism (Albergoni and Piccinni 1983). The toxicity of metals in solution depends on the degree of oxidation of a given metal ion together with the forms in which it occurs. For example, the maximum allowable concentration of Cr (IV) in the former USSR was 0.001mgl-1 whereas for Cr (III) it was 0.5mgl-1, as a rule however, the ionic form of a metal is the most toxic form (Bestemyanov and Krotov, 1985), the toxicity is reduced if the ions are bound into complexes e.g with natural organic matter such as fulvic and humic acids. Under certain conditions, metallo – organic, low molecular weight compounds formed in natural waters exhibit toxicities greater than the uncombined forms. An example is the highly toxic alkyl derivatives of mercury (methylmercury) from elemental mercury by aquatic micro-organisms (WHO, 1992). Various environmental factors such as temperature, pH, water hardness, dissolved oxygen, light, salinity and organic matter can influence the toxicity of metals in solutions (Bryan, 1976; Dojlildo and Best, 1993; DWAF 1996). Also, the lack of natural elimination processes for metals aggravates the situation. As a result, metals shift from one compartment within the aquatic environment to another including the biota often with detrimental effects, through sufficient bioaccumulation. Food chain transfer also increases toxicological risk in humans. (Rainbow, 1985; Mason,1991). As a result of adsorption and accumulation, the concentration of metals in bottom sediments is expected to be higher than in the water above and this sometimes can cause secondary pollution problems, therefore, bottom sediments are repository of heavy metals. Metals in natural waters can exist in truly dissolved colloidal and suspended forms. The proportion of these forms varies with metals and for different water bodies. Consequently, the toxicity and sedimentation potential of metals change depending on their forms, (Bestemyanov and Krotov, 1985). Non essential metals often exert their action through their chemical similarity to essential elements for example, Cadimium with Copper or Zinc (George, 1982). However, the effects of toxicity are usually additive and / or synergistic (Depledge, 1987). Essential heavy metals are generally considered to be less toxic than non-essential metals, (Batley, 1993). Metals such as cadmium, chromium, copper, iron, nickel, lead and zinc exhibit aquatic toxicity when present above recommended standard in that they can contaminate surface and ground water bodies, soil, plant, aquatic life and man, through bioaccumulation. Bioconcentration of heavy metals over time in aquatic ecosystem has been reported by Alabaster and Lloyd, (1980); Spear, (1981); Friberg et al. (1986); Fischer (1987); Grandwork, (2002). According to Mason (1991), heavy metals pollution is one of the five major types of toxic pollutants commonly present in surface and ground waters. The environmental pollutants tend to accumulate in organisms, and become persistent because of their chemical stability or poor biodegradability and that they are readily soluble and therefore environmentally mobile. Heavy metals form one of the major contributors to the pollution of natural aquatic ecosystems. (Puvers, 1985; Sanders, 1997). The elevated level of heavy metal in the Niger Delta aquatic environment as a result of industrial discharges from refining operations have been elaborated by Atuma and Egborge, (1986); Ikomi and Owabor (1997); Ikomi and Emuh (2000); Spiff and Horsfall, (2004); Brades et al., (2004). The unregulated discharge of untreated influents into natural receptors by industries in Nigeria has also been reported by Egborge, (1994, 2000); Omishakin, (1996). Warri Refining and Petrochemical Company Limited, Ekpan Warri, generate effluent and discharge it into a natural receptor – River Ijana. Therefore it is important to monitor pollution limits of heavy metals in the aquatic ecosystem carefully, so that approximate measure of the potential hazards can be attained. These measures should give an estimation of the type of effects that could be expected after exposure to heavy metals. Thus, the intent of the research was to obtain information on the concentration and distribution of heavy metals in River Ijana. Study Area: Warri in Delta State of Nigeria is situated on the north bank of the Warri River, one of three major sinusoidal river which in conjunction with their anastomosing tributary streams and creeks drain the wetlands of the western Niger Delta. The study area (River Ijana) is located within longitude 5.54°E and 5.7°W and latitude 5.31°N and 5.6°S as shown in Fig.1a, b, c, d . It stretches from low population density of Ubeji and Ughuotor that generate rural/urban waste that are discharged into the river untreated, it meanders through its course and empties into the Tobi Creek. The activities along the river course include auto-mechanic workshops, petroleum refinery and services, bathing, fishing and swimming. The river is unidirectional in the upper reach and tidal in the lower reach. Its upstream reach is fresh water with dense forest vegetation. The downstream reach is however brackish and consist of Mangrove. The area experienced tropical humidity of the semi-hot equatorial type-with a mean annual rainfall of about 3000mm (Alakpodia, 2001). The wet season period stretches from April to October each year, and however with occasional precipitation in the dry season month of November-March. Table 1: Heavy Metal Concentration in mg/l in River Ijana (mean values are replicate of two determination)
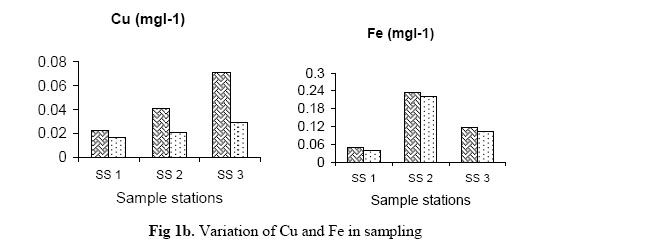
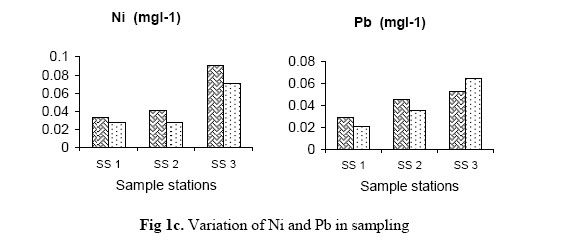
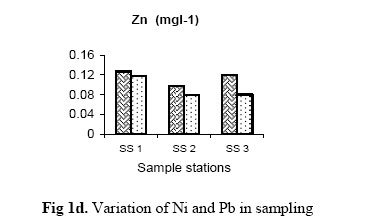
*WHO = World Health Organization Effluent Standards; *FEPA = Federal Environmental Protection Agency Effluent Standards. EXPERIMENTAL Sampling stations: Three sampling stations were established to cover possible impacted and unimpacted area along the river course based on an earlier field reconnaissance tour. The locations of the various sampling points are; i) SS1: About 100metres upstream of the Ijana River from the point of discharge of Warri Refinery effluents. ii) SS2: This is the point of discharge of Warri Refinery effluent. iii) SS3: About 100metres downstream of the Ijana River from the point of discharge of Warri Refinery effluent. Sample collection and analysis: The composite water sampling method was used in collection of sample in each sampling station twice covering a period of March/August 2003. A 2litre wide mouth polyethylene container thoroughly cleaned was used. Samples were preserved by adding 5 drops of Nitric acid to the samples and stored below 4°C in a refrigerator before analysis. Analyses of parameters were based on the principles and procedures outlined in standard methods for the examination of heavy metals in water and wastewater samples (APHA, 1995). The concentrations of heavy metals in the preserved samples were analysed using a Pye-Unicam Atomic Absorption Spectrometry 2900-model. All reagents used were of AnalaR grade and all glassware and polyethylene were properly cleaned with acid – cleansing reagents and rinsed thoroughly with distilled deminerized water.RESULTS The level of individual parameters of pollution analysed are presented in Table 1 and in Figure 1a, b, c, and d. Cadmium values ranged between (0.010 ± 0.004mg1-1) and (0.100± 0.014mgl-1) along the river course within the period of study. Seasonality difference existed with higher values of 0.110mg1-1 at SS3 during the dry season, while the wet season recorded a maximum concentration of 0.090mg1-1 at SS3. In the same vein, Chromium concentration within the study area varied between (0.037 ± 0.006mg1-1) and (0.067 ± 0.020mg1-1). The concentration distribution in the study area show that Cr experienced maximum level of 0.081mgl-1 at SS3 during the dry season while at SS1 0.022mg1-1 was recorded during the wet season as shown in Figure 1b. Copper, Iron and Nickel mean concentrations in the water body ranged between (0.020 ± 0.004mg1-1) and (0.050 ± 0.029mg1-1); (0.046 ± 0.007mg1-1) and (0.229 ± 0.008mg1-1) and (0.030 ± 0.004mg1-1) and (0.080 ± 0.010mg1-1) respectively. Also, Copper and Nickel recorded maximum values of 0.071mg1-1 and 0.090mg1-1 respectively at SS3 during the dry seasons, while Iron recorded maximum value of 0.235mg1-1 at SS2 . In the same vein, Copper and Nickel recorded maximum concentration of 0.029mgl-1 and 0.070mgl-1 respectively at SS3 while Iron has maximum concentration of 0.223 mgl-1 at SS2 during the wet season. Concentration levels of Lead and Zinc in the study area varied between (0.025 ± 0.006mg1-1) and (0.050 ± 0.00mg1-1); (0.088 ± 0.100mg1-1) and (0.122 ± 0.007mg1-1) respectively. Higher values of Lead was recorded in the wet seasons, it recorded a maximum concentration of 0.064mg1-1 at SS3, while higher value of 0.052mg1-1 was recorded during the dry season at SS3. Conversely, Zinc experienced higher concentration of 0.127mg1-1 at SS2 during the dry season, Over 0.117mg1-1 recorded during the wet season. DISCUSSION As shown in Figure 1a Cadmium mean concentration level of 0.060mg1-1 at SS1 could be attributed to rural / urban effluents along the river course and atmospheric precipitation which support the finding of Robinson, (1996). However, higher value at SS3 is a pointer to the fact that leachate from the refinery sludge lagoon containing Nickel – Cadmium batteries and Cadmium plate items along the jetty and the refinery effluent at SS2 empties into the natural receptor. Cadmium presence in the study area was as a result of industrial discharges, resulting from refinery operations, household wastes such as paints, which supports the earlier findings of Stoeppler, (1991). DWAF (1996); Merian, (1991),
In view of the fact that the major use of water in the study area is fishing and domestic, the concentration levels of Cadmium recorded exceeded that recommended by W.H.O. for aquatic ecosystem, therefore it is of great concern since Cadmium is extremely toxic and the consumption of water high in Cadmium could cause adverse health effect to end users Since, Cadmium has been found to be toxic to fish and other aquatic organisms, which conforms with similar reports of Woodworth and Pascoa, (1982), Friberg et al., (1986), Kjellstroem, (1986) and DWAF, (1998) The high concentration of Chromium and Copper in the study area could be attributed to the dumping of wood treated with chemicals made from salts of Arsenic, Chromium, and Copper in mixed soluble formulation (as copper-chrome-arsenate preservative) being used the to prevent fungi and pest attack which provide a potential source of chemical spills and drainage from the treated wood within and around the refinery, which support the earlier findings of Ndiokwere, (2004). Similarly, effluent from photographic colour laboratory around the study area could also be a source of Chromium in the River as noted by Brades et al, (2004). The high level of Fe recorded at SS2 and SS3 within the study area could be related to run-of from rusted metallic pipes at the refinery scrap metal dump sites and the refinery sludge lagoon. Also, the presence of Iron in the study area could be attributed to high organic matter and low dissolved oxygen content, in that Iron can easily be absorbed on particulate organic matter or complexed with colloidal organic matter in aquatic environment as pointed out by Bryan (1976), Sanders (1997). High concentration of Iron in the Niger Delta has also been reported by (Atiakiru, 1997; Akporido, 2000). Lead and Nickel high concentration within the study area as shown in fig. 2e and f is a pointer to the fact that naturally, Lead and Nickel are distributed in surface waters due to weathering of minerals and atmospheric deposition (Merian, 1991; Robinson, 1996). Also, Lead and Nickel presence at high concentration in study area could be related to industrial and other technical uses most of which are: electric storage batteries , petroleum refining catalyst, chemical pigment and alloy production, leachate from refining sludge lagoon containing Nickel – Cadmium batteries and Nickel plate items, emissions from burning of fossil fuels and gasoline which contain high levels of tetraethyl lead (TEL) which support the earlier findings of Stoeppler, (1991) and Horsfall, (2001). Zinc level in the study area could be attributed to the high concentrations of Cadmium and Iron in that Zinc occurs in nature with other metals of which Iron and Cadmium are the most common which supports the work of Dallars and Day, (1993). Conclusion The levels of heavy metals, namely cadmium, chromium, copper, iron, nickel, lead and zinc were analysed in the River Ijana. Generally, excessive levels of the parameters of pollution above W.H.O. standards recommended for surface waters were observed. This is an indication of pollution. From the distribution pattern of the individual parameters, the downstream point is more contaminated than the upstream point. This is a pointer to the fact that there is unregulated discharge of contaminated effluent into the natural receptor - River Ijana without prior treatment by industries and communities within the study area. Acknowledgement The authors expressed their profound and indebt gratitude to Prof. R.B. Ikomi, Prof. S.H.O. Egboh and Dr. M. Horsfall Jr. for their scholarly contributions and discussions during the course of this research. Recommendation A comprehensive study of physicochemical parameters should be carried out on sediments of Rive Ijana. REFERENCES
Copyright 2006 - Journal of Applied Sciences & Environmental Management The following images related to this document are available:Photo images[ja06036f1a.jpg] [ja06036f1c.jpg] [ja06036f1d.jpg] [ja06036t1.jpg] [ja06036f1b.jpg] |
| |||||||||
