 |
| About Bioline | All Journals | Testimonials | Membership | News |
|
||||||
|
||||||
Journal of Applied Sciences & Environmental Management, Vol. 10, No. 2, 2005, pp. 135-143 Soil Heavy Metal Concentration Patterns at Two Speed Zones along the Gaborone-Tlokweng Border Post Highway, Southeast Botswana MOHAMMED SHAIKH; NKOBI MOLEELE; GEORGES-IVO E. EKOSSE; OTLOGETSWE TOTOLO; JULIUS ATLHOPHENG Faculty of Science, University of Botswana, P/Bag 0022 Gaborone, Botswana Code Number: ja06038 ABSTRACT Since 1988 Botswana has been experiencing an unprecedented increase in vehicular traffic which is suspected to be having contamination effects on soils along heavily used roads in the country. This study aimed at understanding the contamination trends of heavy metals on soils due to vehicular emissions. The soil physico-chemistry (bulk density, particle size distribution, pH, electrical conductivity and cation exchange capacity), mineralogy (using x-ray diffraction techniques) and heavy metals (Cd, Pb, Cu and Zn) concentrations were determined for soil samples obtained along the roadside at 2m, 4m, 6m and 100 m of the Gaborone – Tlokweng Emigration/Immigration Boarder Post Road, which is one of the busiest in the country. Bulk density of soil samples were from 1.19 to 1.4; and sand, loamy sand and sandy loam textural classes constituted the soil samples. The soil pH was from 5.09 to 8.57; the EC ranged from 6.27 µS cm-1to 20.3 27 µS cm-1 and the CEC values were from 10.2 meq100g-1 to 27.2 meq100g-1. Clay minerals were identified in the samples as well as feldspar and quartz. The concentration levels for Pb were from 0 mgkg-1 to 71 mgkg-1; Zn were from 5.23 mgkg-1 to 51.26 mgkg-1 ; Cu were from 0.3 mgkg-1 to 18.1 mgkg-1 and Cd 0 mgkg-1 to 2.4 mgkg-1. The interplay of soil physico-chemistry and mineralogy on heavy metals concentrations is discussed. Although levels of heavy metals concentrations fell below normal ranges, the values obtained were generally higher than those from some developed and developing countries. @JASEM Heavy metals are widely distributed in the environment and are not biodegradable but can be transformed into different chemical forms, often with different valance states (Waalkees, 1998). Some of the transformation processes result from activities related to industrialization, including combustion of fuels, or other temperature driven reactions associated with motor vehicle performance (Sawyer, 1998). Cadmium (Cd), Lead (Pb), Copper (Cu), and Zinc (Zn) are fuel additives that are released into the atmosphere and carried to the soil through rain and wind. Therefore it is commonly known that high concentrations of these heavy metals occur within 100m of major road highways and near urban centres, hence directly impacting on surrounding soils (Brady and Weil., 1996). Botswana may not be an exception to the foregoing heavy metal concentration problem. During the past decade, Botswana has experienced a steady increase in the number of automobiles and kilometres of roads. According to figures released from the Central Statistics Office (2004) in Botswana, maintained roads documented in the country increased from 8 000 km in 1988 to 11 000 km in 2002, and for the same period, the number of vehicles rose significantly from 65 000 to 163 000. Moreover, there was an increase in flow of visitors moving to and from Botswana. The statistics indicated that there were 1 2000 000 people visiting the country in 1998 compared to 1 800 000 in 2002. Furthermore, 16% of this traffic used the Tlokweng Emigration/Immigration Boarder Post (Central Statistics Office, 2004). With such an unprecedented high vehicular traffic flow observed at the Tlokweng Boarder Post, there have undoubtedly been increased levels of fuel use and consequently resulting in more exhaust fumes and fuel leakages to soils and vegetation along the heavily used road. This study therefore investigates the patterns of heavy metal concentration along the Gaborone-Tlokweng Border Post route, in relation to vehicular traffic speed zones (60 km/hr and 120 km/hr), specifically:
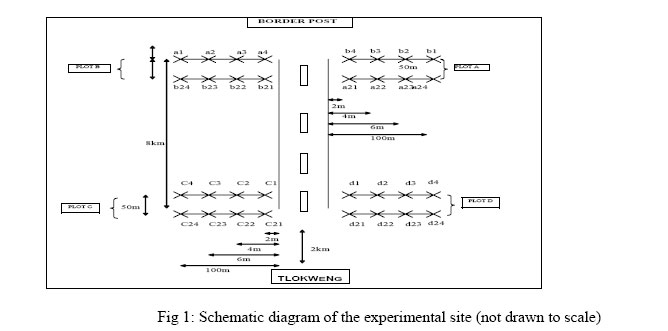
MATERIALS AND METHODS Study Area: The study area is a 20km highway connecting Gaborone City with the Tlokweng-South Africa Border Post. The geographical coordinates of the study area are from 24° 40.278’ S and 26° 00. 280’ E (Tlokweng) to 24° 41. 958’ S and 26° 05.070’ E (Boarder Post). The road is one of the oldest tarmac in the country and carries a high density of traffic as it is the shortest/closest gateway neighbouring South Africa. Gaborone is the capital city located in the south eastern part of Botswana, and the area is characterized by a semi-arid subtropical continental climate with a distinct winter and summer. The mean annual rainfall of Gaborone is about 525 mm, with most of the rain falling between October and April (Republic of Botswana 2000).Given the low annual rainfall and the high rates of evaporation, especially in summer, and the erratic nature of rainfall, water deficiency is a major constraint on agriculture and plant growth. Temperatures are high in summer and mean monthly maximum temperature range between 32°C and 35°C between October and January. The average monthly temperature for Gaborone for December (summer) is 26°C compared to 14°C in June during the winter. In response to the semi-arid climate with prolonged periods of drought, the vegetation is xeromorphic savanna in which thorny trees, especially Acacia spp. are an important element of the flora. This type of vegetation, known as hardveld vegetation, characterizes the more humid eastern part of Botswana. It is more densely wooded than the semi-desert vegetation developed over Kalahari sands in the western part of the country. The dominant woody species in the vegetation include Acacia tortilis, A. erubescens, A. melifera, A. karoo and Dicrostachys cinerea and Ziziphus mucronat, while the dominant grasses include Aristida congesta, A. lehmaniana and Rhynchelytrum repens. The soils were derived from granitic parent materials and they are usually coarse – textured, with clay enriched subsoils due to downward eluviations of clay minerals in the soil profile. They are mainly Alfisols (Ustalfs) according to United States Soil Taxonomy (Soil Survey Staff 1987), and are brownish in the subsoil but dark in the immediate topsoil where humus is concentrated. Hydromorphic soils which are predominantly greyish, with poorly defined horizons are characteristic of the main river valleys and adjoining floodplains. Field/Experimental Design: Two distinct speed zones on uniform land use (mixed farming) were selected for the experiment along the study highway, the 60km/hr and 120km/hr speed zones. At each speed zone an area of 5000m2 was demarcated on either side of the highway, resulting in four plots (A, B, C, and D), two at each speed zone (Figure 1). Within each plot two replicates with four treatments were established at a distance of 50m apart. The distances between the first three treatments were set at 2m, 4m, and 6m from the roads’ edge. The final treatment was levied at a distance of 100m perpendicular to the road to serve as a control (Figure 1).Cluster sampling (Cresser, 1994) was carried out on the designated plots during the month of March 2003. Soil samples were collected at a depth of about 20 cm from the surface using a soil auger. A core sampler was also used to collect undisturbed core samples from the 0-10 cm layer of the soil for bulk density determination. Laboratory procedures: Bulk soil samples collected were air-dried, passed through a 2mm sieve prior analysis. Soil bulk density using core samples was determined by applying the method described by Okalebo, 1993 and Tan, 1996. The particle size distribution (PSD) analyses of the soil samples were carried using of a 1993 model Shimadzu SA-CP4 particle size analyzer (PSA), and Stoke’s law of sedimentation was the governing principle of operation. The analyzer was set at 240 revolutions per minute (rpm). Soil pH was determined potentiometrically in 0.01M calcium chloride solution using a soil to solution ratio of 1:2 whereas electrical conductivity (EC) was measured using a conductivity meter (Accumet Model 30) following the procedure employed by Van Reeuwijk (1993). The ammonium acetate method was used to determine the soil CEC as specified by Van Reeuwijk (1993). Sample preparation for X-ray powder diffraction (XRPD) analyses were carried out according to techniques mentioned in literature (Ekosse, 2004; Ekosse and Vink, 1999; Hughes and Brown, 1979). Whole samples (<53 µm) as well as clay fractions (<2 µm) were scanned for minerals, after samples were pulverized in a ball and sieb mill for 30 seconds to obtain a powdered form (Ekosse, 2000; Ekosse and Vink, 1999; Nkoma and Ekosse, 1999). A Philips PW 3710 XRPD system operated at 40kV and 45 mA, with a Cu-Ka radiation and a graphite monochromator with a PW 1877 Automated Powder Diffraction, X'PERT Data Collector software package was employed. Scanning occurred at angles ranging from 40 2 θ to 700 2 θ, a step size of 2 θ= 0.02 and time per step set at 0.3s. The analysis of soil samples for Cd, Pd, Cu, and Zn were determined using the Varian Spectra AA10 Atomic Absorption Spectrophotometer equipped with a deuterium background corrector. The soil samples were digested using the HNO3, which is considered accurate for the determination of heavy metals (Siaka et al., 1998) in various environmental and biological samples. The procedure was according to Alloway and Ayres, 1997; Siaka et al., 1998 and Ramocha, 2002. The characteristics (e.g. heavy metals) of soils from the four plots of the two speed zones were compared using the ANOVA, and where the F values were significant (p = 0.05), the means were further compared using the Duncan Multiple Range Test. RESULTS AND DISCUSSION Summary results: Values for bulk density of soil samples were from 1.19 to 1.4. Regarding PSD of the soil samples, the sand fraction ranged from 68.63 wt % to 92.45 wt %, silt fraction figures were from 6.2 wt% to 19.32 wt %, for clay fraction the values were from 1.85 wt % to 12.53 wt %, and sand, loamy sand and sandy loam textural classes were identified according to USDA soil classification scheme (United States Department of Agriculture, 1996). The soil pH was from 5.09 to 8.57 and the EC ranged from 6.27 µS cm-1to 20.3 27 µS cm-1. Soil CEC ranged from 10.2 meq100g-1 to 27.2 meq100g-1. Soil minerals identified by XRPD for bulk soil samples were albite, anorthite, biotite, calcite, kaolinite, microcline, quartz, sanidine in different levels of abundances which is presented in Table 1. The mineral assemblages for the clay fraction included beidellite, biotite, calcite, halloysite, illite, kaolinite, microcline, quartz and rectorite (Table 2). The concentration levels for Pb were from 0 mgkg-1 to 71 mgkg-1; Zn were from 5.23 mgkg-1 to 51.26 mgkg-1 ; Cu were from 0.3 mgkg-1 to 18.1 mgkg-1 and Cd 0 mgkg-1 to 2.4 mgkg-1 . Table 1: Minerals identified by X-ray diffraction for individual whole soil samples.
(Al=albite, An=anorthite, B=Biotite, C=calcite, K=kaolinite, M=microcline, Q=quartz, S=sanidine, + + +=major, + +=minor, +=trace, -=not present) Soil physico-chemistry: Particle Size analysis: Generally, all samples from the four plots were dominated by high % sand fractions, followed by % silt and finally % clay. Soil samples closest to the road (2m) were largely dominated by sand fractions, constituting on average 91%. The constituents of silt and clay fractions increased with an increase in horizontal distance from the Highway. These variations in particle size patterns away from the road, gave rise to three textured soils: sandy soil at 2m and 4m; sandy loam at 4m and 6m; and loamy at 100m. Table 2: Minerals identified by X-ray diffraction for individual clay soil samples.
(B=beidellite, B=Biotite, C=calcite, H=halloysite, I=illite, K=kaolinite, M=microcline, Q=quartz, R=hectorite, + + +=major, + +=minor, +=trace) Bulk Density: Bulk density (Db) relates to the combined volumes of pore and solid space. Soils that are generally porous will normally tend to have lower Db. The Db values show no significant variation amongst the four plots (D.F.=3; F=1.48; Pr.=0.2456). However significant differences are realized for treatments within a given plot (D.F.=3; F=131.57; Pr.=<0.0001). Soil samples 100m from the road (a4, a24, b4, b24, c4, c24, d1, d24-see Figure 1) tend to have low Db values relative to samples at 2m, 4m and 6m, implying that the % sand constituent decreases with an increase in horizontal distance from the road. Sandy soil generally tends to have low organic matter and solid particles less aggregated, hence higher Db than fine textured soils (Brady and Weil, 1996). Db mean values were higher for plot C (1.292 g/cm3) and lowest for plot A (1.278 g/cm3), typical values for sands and sandy loams which are reported to vary from 1.20 g/cm3 – 1.75 g/cm3 (Brady and Weil, 1996). Soil pH: Analysis of Variance reveals a significant difference in the pH values of the four studied plots (D.F. =3; F=7.71; Pr. =0.0009). Significant variations amongst the treatments per plot were also evident (D.F. =3; F=185.1; Pr. =<0.0001). The pH values were indicative of an alkaline environment since the maximum mean pH was 8.0 for plot C and minimum mean was 7.3 for plot B, hence the presence of soluble salts (Landon, 1996; Tan, 1996). Such pH value ranges are common to areas that receive low rainfall (Brady and Weil, 1996), where leaching tends not to be very intense and the base forming cations are left to dominate the exchange complex in the place of Al3+ and H+ ions. Electrical Conductivity: Significant variations in electrical conductivity values for the four plots (D.F.=3; F=5.01; Pr.=0.0077) and the treatments (D.F.=3; F=77.10; Pr.=<0.0001) were observed. The mean EC values range from 12.8 µS/cm for plot A to 15.8 µS/cm for plot C. A direct relationship between measured EC of soil and quantity of dissolved salts in solution is normally expected (Alloway and Ayres, 1997). This therefore suggests that soils in plot C have higher concentrations of salts when compared to the other three plots, an observation further supported by the pH results. Yaron (1995) states that a decrease in soil pH from 7 – 5.5 causes an increase in conductivity because many more ions, especially those of heavy metals go into solution. This however was not the situation, and this mild association between pH and EC values could probably be explained by anthropogenic rather than pedologic forces. Cation Exchange Capacity (CEC): No statistical differences were discovered for CEC values across the four plots (D.F. =3; F=1.21; Pr. =0.3285), but the treatments within individual plots displayed strong statistical relationship (D.F. =3; F=13.52; Pr.=<0.0001). The CEC values range from 25.6 meq/100g soil (sample a3) to 10.2 meq/100g soil (sample b24). Sampling Plot A (19.4) averages higher than the other three plots whilst C (16.3) recorded the lowest CEC value. The ability to exchange cations is one major soil property that controls the fate of ionically charged contaminants in soil. Ions with high valance state tend to possess greater replacing power than ions with greater degree of hydration (Alloway, 1995). Prevailing pH condition of the soil tends to influence/determine ion exchange capacity, and hence CEC of most soils increases with higher pH (Brady and Weil, 1996). However, the present results show opposite patterns to the expected, which probably reflects large sand fractions within these soils and relatively lower clay and humus contents. Soil physico-chemstry and heavy metals concentrations: Statistically significant positive relationships between the physico-chemical parameters: pH; CEC; EC; and Db (Table 3) were recorded. Soil pH was highly correlated with CEC, EC and Db, but the relationship between Db and EC was weaker in comparison to other physcio-chemical parameters. The heavy metals (Pb, Cd, Cu and Zn) also showed significant positive relationships amongst themselves as well as with the measured soil physcio-chemical parameters. However, relatively strong relationships existed between concentration levels of Pb, Zn and Cu, but this association was weaker with soil Cd (Table 3). Table 3: Correlation matrix showing the relationships between concentration levels of heavy metals and physcio-chemical parameters in soil along the Highway
Soil pH and CEC levels had a very high significant effect on the amount of Pb content in the soil samples. The association between EC and Db with the heavy metal concentrations was weaker, despite being positive. Similar studies Electrical conductivity and Db despite being positively correlated to heavy metal content of soil indicate that the association is weaker. Similar studies elsewhere (Adriano, 2001 and McLaughlin and Singh, 1999) showed that high levels of pH and CEC tended to be negatively associated with concentrations of heavy metals in soil. Soil mineralogy and heavy metals contamination: Quartz was detected for all the samples scanned and was present in high proportions. Calcite and albite were the second most occurring minerals. Microcline occurred as a minor mineral, whereas anorthite, kaolinite and sanidine were observed in trace amounts. These minerals are abundant in the whole soil samples, because of their resistance to physical breakdown (Ngole, 2000). According to Kralik (1999) and Singh et al (1999) the dominance of quartz is mostly due to larger grain size. This is true as most samples from the particle size analysis were dominated largely by sand fractions. The presence of albite in a few of the samples scanned possibly indicates the abundance of Na+in the soil solution and this is likely to occur under conditions of increasing pH. Apart from these minerals the presence of calcite is an indication of poorly drained soils and confirms the presence of carbonate ions (Sparks, 1995). These findings are supported by the mild alkalinity of the soil samples. When these primary minerals undergo chemical alteration clay minerals are formed. The XRPD results for the whole and clay (<2.00 µm) samples varied remarkably. As was the case with the whole samples, quartz was dominant mineral together with kaolinite and montmorillonite. Beidellite, calcite, illite and halloysite occurred in minor quantities. Traces of biotite, goethite and hectorite occurred in a few of the samples. Tan (1998) describes silica minerals to occur extensively in nature and are frequently important constituents of clay fractions of soils. By virtue of their size (>2.0 µm) the fine silica particles can be classified as clays (Tan, 1998; Faure, 1998; Velde, 1992). The clay minerals create sites for isomorphous substitution of heavy metals in their structures (Ekosse, 2000). Also heavy metals can adhere to the surfaces of these clay minerals especially the 2.1 clays (Ekosse, 2001). Concentration of heavy metals with distance from the edge of the highway: The effects of horizontal distance of heavy metals concentrations to the road were highly significant on the concentration levels of all the heavy metals (Cd D.F=3; F=17.97; Pr.=<0.0001, Pb D.F.=3; F=14.35; Pr.=<0.0001, Cu D.F.=3; F=18.16; Pr.=<0.0001 and Zn D.F.=3; F=6.28; Pr.=0.0027) measured in the soil. An increase in horizontal distance showed a decrease in the deposition of Cd, Pb, Cu, and Zn (Table 4). Highly concentrated levels were recorded within 6m from the road’s edge, while lower concentration levels were at 100m (Table 4). There were no significant differences between the first three treatments (Table 4) for all the measured heavy metals. This probably showed that the impact of vehicular deposition of heavy metals extended beyond 6m from the road’s edge and yet less than 100m. The rapid decrease of the levels of heavy metals between 6m and 100m from the road is an indication that vehicular emission played a significant role in the deposition of heavy metals on surface soil. This deposition pattern is similar to results found elsewhere (Brady et al., 1996; Dilek et al., 2003; Fakayode and Owolabi, 2003; Fatoki, 1996; and Garcia et al., 1996). Overall, Pb concentration levels were the highest at all experimental sites, while Cd levels were the lowest, and the heavy metal concentration gradients with distance follow the order Pb>Zn>Cu>Cd. Table 4: Mean concentration levels of heavy metals in surface soil with distance from the edge of the Gaborone-Tlokweng Border Post Highway.
* Means in a single column followed by the same letter are not significantly different Speed zones and concentration of heavy metals: The relationship between the speed of traffic flow (60km/hr and 120km/hr zones) and heavy metal deposition in surface soil along the Gaborone-Tlokweng Border Post highway was investigated. Marked variations in the distribution of the selected heavy metals in soils in the two speed zones were recorded. Cadmium (F=3.57; D.F.=3; Pr.=0.0289) and Cu (F=6.19; D.F.=3; Pr.=0.0029) responded significantly to changes in speed , but there were no significant differences in the distribution of Pb and Zn (Table 5). Cadmium and Cu displayed opposite patterns in relation to speed zones. This was evident from high concentration levels of Cd found in the 120 km/hr speed zone (C=0.9375mg/kg; D=0.875mg/kg), while levels of Cu (A=11.838mg/kg; B=11.45mg/kg) were highest in the 60 km/hr speed zone (Table 5). Though concentration levels of Pb and Zn were not significantly different in terms of speed of traffic flow, slightly higher absolute concentrations were detected (Pb=37.06 mg/kg; Zn=24.92 mg/kg) in the 60 km/hr speed limit (Table 5). Table 5:Concentration levels of four heavy metals in surface soil at two speed zones along the Gaborone-Tlokweng Border Post Highway
* Means in a single column followed by the same letter are not significantly different. Vehicular flow in the lower speed zone would be slower and hence lengthier time spent by vehicles in that zone, which subsequently lead to more emissions of particles, especially from the exhausts. Potential soil contamination by heavy metals is therefore eminent in lower speed zones of congested highways. Fakayode and Owolabi (2003), Ho and Tai (1987), Olajire and Ayodele (1997) and Othman et al (1997), have observed in other parts of the world that heavy metal concentration increases with an increase in traffic density. However, besides the volume of traffic flow, heavy metals in road side soil and vegetation is also a function of the mode of operation of vehicle. High engine speed and rapid acceleration can lead to an increase in emission levels, probably as a result of the reactivation of particles on the exhaust system (Nriagu, 1984; EC, 2001). The foregoing could possibly explain why Cd concentration levels were higher in the 120km/hr speed zone than the 60 km/hr. Prevailing wind direction and concentration levels of heavy metals: A total of four plots were cut along the Highway (see Figure 1), two on either side (Plots A&D on the south and B&C on the north). Cadmium (D.F.=1; F=0.64; Pr.=0.4326), Lead (D.F.=1; F=1.16; Pr.=0.2915), Copper (D.F.=1; F=0.61; Pr.=0.4428) and Zinc (D.F.=1; F=0.01; Pr.=0.9051) concentration levels showed no significant differences on either side of the road/highway (Table 6). Although the differences in the concentration levels of the heavy metals were insignificant, comparatively higher concentration levels were observed on the southern side of the road (i.e. plots A and D). These insignificant variations were probably a result of the prevailing winds in the study area. On an annual basis, 36% of the wind blows from the north east direction at an average speed of 2.21 m/s (Met Services, 2003). These winds would generally blow across the Highway towards the south or south west, hence marginally higher concentration levels in plots A and D. Other factors cited as important in determining concentration levels of heavy metals include the slope; physico-chemical parameters such as pH, electrical conductivity, cation exchange capacity and others (Adriano, 2001; Alloway, 1995; Alloway and Ayres, 1997). The discussion on some of these factors (physico-chemical parameters) for the study area follows in the next section.
Table 6: Concentration levels of heavy metals in relation to the side of source of samples along the Gaborone-Tlokweng Border Post Highway
* Means in a single column followed by the same letter are not significantly different In concluding, the pH of most soil is considered a leading factor that controls mobility of heavy metals (Adriano, 2001; Alloway, 1995; Alloway and Ayres, 1996; Brady and Weil, 1996). The observed mild alkaline environment of the study area is probably a good indicator of the concentration of heavy metals evaluated in the soil. Alloway (1995) and Alloway and Ayres (1997) are of the view that acidic environments encourage the dissolution of many metal ions, making them susceptible to leaching to lower profiles. Speed influences the accumulation of some of the heavy metals in soils (Cd in 120 km/hr and Cu in 60 km/hr). The effect of horizontal distance is highly significant on the distribution of all the heavy metals (Cd, Pb, Cu and Zn) in soils. The concentration reduces considerably with an increase in horizontal distance. Highly concentrated areas lie within 6m of the road. Roadside sampling has no significant effect on the concentration levels of heavy metals, however marginally higher values were observed for plots A and D, as a result of wind direction. All the heavy metal (Cd, Pb, Cu, Zn) concentrations fell well below the normal ranges indicated in Table 7. However, levels were generally higher than what has been observed in other parts of the world (Belgium, Hong Kong and Nigeria). These elevated levels could probably be the result of low rainfall experienced in the study area. Belgium, Hong Kong and Nigeria are comparatively wetter than the study area, hence lower heavy metal concentrations due to leaching. In addition, the transition to unleaded fuel may have long been implemented in the latter areas relative to the study area. Table 7: Soil contamination status of soil along the Gaborone-Tlokweng Border Post Highway relative to other areas
A = Albasel & Cottenie (1985), b = Ho & Tai (1988), c = Ndiokwere (1984), d = Alloway (1995), e = mean concentration in soils, - = not detected Botswana has 25 different pieces of legislation that are concerned with health and environmental protection (Mbongwe, 2002). However, these legislations are fragmented both in substance and in terms of implementation mechanisms. Different legislation often fall under different Government departments and authorities, creating both gaps and overlaps in implementation. Botswana at this point in time does not have any policies that directly deal with control of vehicular emissions. It is for this reason roadside soils and vegetation will continuously receive emission from vehicles. REFERENCES
Copyright 2006 - Journal of Applied Sciences & Environmental Management The following images related to this document are available:Photo images[ja06038t5.jpg] [ja06038t4.jpg] [ja06038t2.jpg] [ja06038t3.jpg] [ja06038t7.jpg] [ja06038f1.jpg] [ja06038t1.jpg] [ja06038t6.jpg] | ||||||||||||||||||||||||||||||||||||||||||||||||||||||||||||||||||||||||||||||||||||||||||||||||||||||||||||||||||||||||||||||||||||||||||||||||||||||||||||||||||||||||||||||||||||||||||||||||||||||||||||||||||||||||||||||||||||||||||||||||||||||||||||||||||||||||||||||||||||||||||||||||||||||||||||||||||||||||||||||||||||||||||||||||||||||||||||||||||||||||||||||||||||||||||||||||||||||||||||||||||||||||||||||||||||||||||||||||||||||||||||||||||||||||||||||||||||||||||||||||||||||||||
| |||||||||
