 |
| About Bioline | All Journals | Testimonials | Membership | News |
|
||||||
|
||||||
Journal of Applied Sciences & Environmental Management, Vol. 10, No. 3, September, 2006, pp. 9-13 A new methodology for producing of risk maps of soil salinity, Case study: Payab Basin, Iran 1Masoud Masoudi; 2Patwardhan, A M; 3Gore, S D *1Department
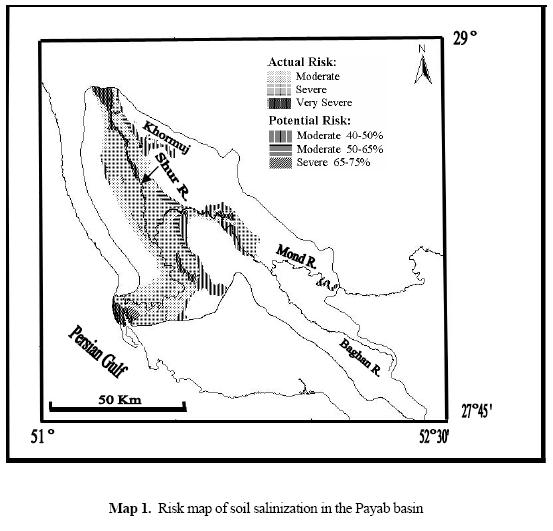
of Desert Zones Management, Agricultural College, ShirazUniversity, Shiraz, Iran. Code Number: ja06044 ABSTRACT: The entire land of Southern Iran, south of the Zagros belt, faces problems arising out of land degradation. For this purpose the Payab basin that is lower reaches of Mond basin has been chosen for detailed study. The data for this study have been gathered from the records and reports published by the different departments of the Ministries of Agriculture and Energy and the Meteorological Organization of Iran. The present paper deals only with the intensities of hazards of soil salinity as a parameter for assessing the land degradation. The present paper examines to find a model for risk analysis of soil salinization for the studied area using the Geographical Information System (GIS). The GIS analysis of various indicators considered proved useful for dividing areas with actual risk from those with potential risk. Results show areas under actual risk are much more than areas under potential risk of soil salinity indicating presence of degraded lands at present. Also the areas under severe risk are more extensive class among the severity classes in the plains indicating the worse conditions in the studied area. The worse conditions and presence of degraded lands in the area related more natural causes like arid climate and geological formations such as salt domes. @JASEM Salt-affected (saline) soils extend widely in regions like southern Iran with arid and semi arid climates. The main causes of soil degradation in the studied area are soil erosion (wind and water erosion) and in situ soil salinization. The present paper examines the risk of soil salinization in the Payab basin (lower reaches of MondBasin) using GIS analysis. The soils containing soluble salts in the root zone in quantities large enough to adversely affect plant growth are called salt affected. Visually they are recognised by the presence of a white or greyish-white efflorescence of salts on the surface during dry months. Commonly, they are devoid of good natural vegetation cover. The term saline refers to more than just the content of sodium or chloride. Other ions as magnesium, calcium, carbonate, bicarbonate, and sulfate also contribute to the soil salinity. If however the predominant ion is sodium, the soil is said to be sodic. Factors inhibiting crop growth in saline soils include, salinity-induced high osmotic pressure of soil waters, toxic effects of specific ions, nutritive disorders due to competitive uptake of ions and often poor quality of ground water. Soil salinization is a natural process that operates over a length of time, e.g. when surface water or superficial ground water runs down from higher altitudes or mountainous areas into a low dry land the dissolved salts get precipitated and concentrated due to evaporation affecting the upper layers of the soil. Of greater concern is the salinization caused by over irrigation or brackish water for agricultural purposes, as is the case in many areas of Iran (Siadat et. al., 1997) which enhances the salinization. Also, the intense evaporation precipitates and concentrates salts in the upper layers of the soil as the salts get transported upwards by ground water rise through capillary action. Material and methodsThe present paper examines to find a model for risk analysis of soil salinization for the studied area using GIS. The data obtained were of two types 1) numerical data and 2) thematic maps, but mainly in the map format useful for the GIS analysis. All such relevant data were obtained from the local and main offices and institutes of the Ministries of Agriculture, Energy and Meteorological Organization of Iran and processed thoroughly, using the GIS technique. Also some soil samples and their analysis were used to edit and produce better quality maps. In the present paper nine indicators as the causes of soil salinity have been used. These indicators have been tried individually or in groups, by several authors mentioned against each indicator (Table 1 see page 12) for assessing soil salinity. While fixing the thresholds of severity classes, the recommendations like by the FAO as well as the statistically suitable parameters for local conditions have also been considered. The GIS analysis by the present model permitted division of the basin into five classes of severity (ratings scores between 1 to 5) for each indicator. The hazard maps have been prepared in the GIS (Software of Arc View) for each indicator. In order that the final risk map projects the effect of all the indicators, the overlays of the individual hazard maps were analyzed simultaneously in the GIS. The following equation was used for this map in GIS model: A] Risk score for soil salinization = (Status of soil salinity × 2) + Efficacy of surface geology + Quality of irrigation water + Depth of water table + Ground water quality + Soil texture + Climate + Dry index + Slope. The risk score in each polygon incorporates the effect of all the nine indicators for fixing the five severity classes (Table 2). This facilitated the production of map (Map 1) that showed the different degrees of risk of soil salinization. It was possible to distinguish the areas under ‘actual risk’ from areas under ‘potential risk’ of soil salinization. Areas with potential risk have been recognized using the following criteria: B] Potential risk area = areas where the risk class determined > present class of soil salinity. These include areas that at present show a state of degradation lower than the classes that are predicted for the risk. For example areas under ‘severe’ potential risk, have at present only slight or moderate degradation (salinity with EC of 8-16 mmhos/cm). These areas have severe vulnerability for worsening of conditions. In equation ‘B’, the present class of soil salinity is determined by considering the attributes of the status of soil salinity (indicator 9, Table 1). For calculating the probability for potential risk, the final risk scores have been converted to percentage. The following equation was used for this purpose. C] %Probability of Risk in Potential Risk Areas = [(X -10)/ 40] × 100 where10: the least score (0% probability); 40: the numeric difference between the highest and the least scores; the score of 50 will be 100% probability. X: the risk score in each polygon. Table 2 The severity classes of Risk Maps produced in the GIS.
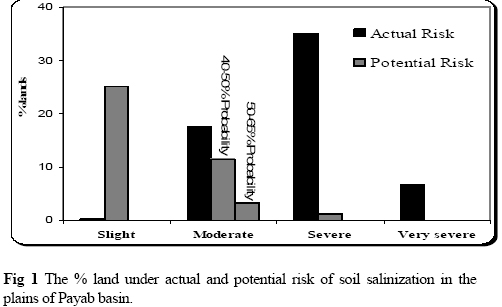
Actual risk areas include areas that at present show a state of degradation equal or bigger than the classes that are predicted for the risk. For example areas under ‘severe’ actual risk have at present severe degradation (salinity with EC of 16-32 mmhos/cm); showing less vulnerability compared to areas under potential risk. The indicators show that these already degraded areashave lesser chance of further degradation. Further degradation can be initiated only by enhanced human activity or by drastic climatic change. Results and Discussion Using the present model, Tables 3 and 4 show the areas under ‘potential risk’ with their probability levels and the areas under ‘actual risk’.The soil salinity of the basin is partly because of the drainage through the evaporite formations and the salt domes in this basin (Map 1). Also erosion through the salt domes and other evaporate formations out of the basin is another cause of salinity of MondRiver, which over a length of time has contributed to the salinity of the soil along the river. The EC of the MondRiver water reaches to about 14000 μmhos/cm (Research Institute of Planning and Agricultural Economics, 1998) which makes it unusable even for irrigation. The saline water of both Shur and Mond rivers percolating through the soil and underlying geological formations contaminates the ground water resources also and high evaporation and capillary action in these areas (with arid to very arid climate) rise dissolved salts of the ground water and increases the soil salinity further. From the map 1and Fig 1 a general conclusion can be derived that in the Payab basin a great proportion (43%) of plains is under ‘severe & very severe risk’ of soil salinization. The main part of these degraded lands in the Payab is the actual risk areas that form 42% of the total plains, where salt affected areas have led to severe & very severe condition. Adding also the areas under moderate actual risk, about 60% plains (141,000 ha) of the Payab basin could be termed as ‘saline soils’ with EC>8mmhos/cm. Areas under potential risk form a lower proportion (41%) of the Payab plains. The proportion of total land under moderate and severe ‘potential risk’ forms only 16% of the Payab plains (38,000 ha), but greater extent (25%) cover areas under slight risk where they are dominant in the southern parts of the basin. These estimates indicate that about 75% of Payab plains ( with arid to very arid climate) suffer from moderate to very severe risk (both actual and potential) of soil salinity. Table 3. Probability (in %) for areas under potential risk of soil salinization in the Payab basin.
Table 4. Areas under actual risk of soil salinization in the basin.
Table 1 The indicators used in the model of risk assessment for soil salinization. *((2 x salt dome area)+(evaporates area)+(0.5 x area of formations with less evaporate material) / area of other formations
Conclusion: Preparation of a Risk Map is seen as a prerequisite for agricultural and environmental planning. Reclaiming the Land in Southern Iran, highly threatened by salinization, is the need of the day. The present model is the first attempt of its kind for defining the risk of soil salinization and can be made applicable for other areas in Iran and elsewhere. The main results of the present paper are: 1. The hazard maps of nine indicators processed in the risk assessment model give a far better opportunity to distinguish the severity classes of risk of soil salinization. The indicators are related to water characteristics, soil characteristics, topography and geological characteristics, and climatic factors. 2.The model based on statistical parameters helps to define further the areas under actual and potential risk and the sub classes based on per cent probability. 3.The areas under ‘actual risk’ in the plains of basin are more extensive (59 % of the total plains) compared to those under ‘potential risk’, indicating presence of degraded lands at present. Acknowledgement: The data, maps and reports made available by the Government Offices of Iran, for this risk assessment work are gratefully acknowledged. The grant of scholarship to M. Masoudi by the Iranian Ministry of Science and Technology facilitated this work, completed at the Department of Environmental Sciences, University of Pune, Pune, India. References
Copyright 2006 - Journal of Applied Sciences & Environmental Management | |||||||||||||||||||||||||||||||||||||||||||||||||||||||||||||||||||||||||||||||||||||||||||||
