 |
| About Bioline | All Journals | Testimonials | Membership | News |
|
||||||
|
||||||
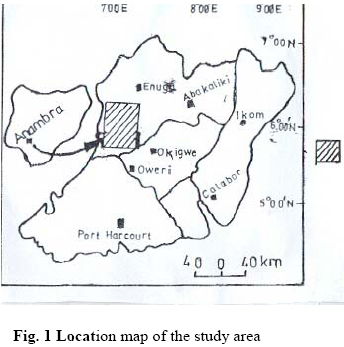
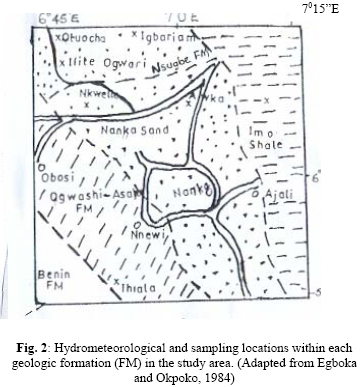
Journal of Applied Sciences & Environmental Management, Vol. 10, No. 3, September, 2006, pp. 27-30 Water Budget Analysis of Agulu Lake in Anambra State, Nigeria 1EGBOKA, BCE; 2NFOR, BN; 3BANLANJO, EW 1,3Department of Geological Sciences, Nnamdi Azikiwe University, Nigeria Code Number: ja06047 ABSTRACT: The elements of water budget equation were analyzed for the Agulu lake area and underlying aquifers. The water budget implications for soil and gully erosion were evaluated in relation to the geological formations and hydrogeotechnics. Results show that rainfall constitutes the main source of precipitation. It ranges from 1714.04mm to 1995.53mm annually. The potential groundwater aquifer volume is 1.5 X 10⁷m3. Discharge from aquifers contributes 7.4 X 10⁷m3 water annually. The amount of 1.72 X 10⁵m3 that is 60% of precipitation is lost to evaporation; 17 to 21% to infiltration. The quasi steady state of the lake water level and volume shows surface and groundwater continuity as explained by the small difference between total input and output values of the computed water budget of the lake and the aquifer. Flood studies indicate that 19.5% of the annual precipitation constitutes runoff, the main agent of gully and soil erosion, flooding and landslides. The other factors that control the distribution and location of gullies are lithologic and stratigraphical, while topography/geomorphology controls gully distribution within various geologic units. A typical gully is about 500m X 50m X 30m long, wide and deep respectively. The destruction to life and property by runoffs/floods demands joint and sustained efforts by the community dwellers, NGOs, Local Government Areas, State governments, Federal Government and the International Communities. @JASEM AguluLake lies within the AnambraBasin, where monstrous effects of flood, soil and gully erosion and landslides destroy lives and property. Soil/gully erosion and landslides within the basin are associated with weak, poorly consolidated sandy lithologic units of Nanka Sands, Ameki Formation, Ogwashi-Asaba Formation, the coastal plain sands and their weathered products. Gully vertical profiles consist of relatively uniform reddish brown non-indurated lateritic sandy soils and whitish unconsolidated sands in deeper zones. Thin bands of clay and feruginized materials occasionally occur. The study shows that gullies are mostly initiated by anthropogenic activities such as footpaths, cattle tracks, roadside drains and exacerbated by infrastructural development. The rate of growth of gullies ranges from 10m–50m annually. The growth is slowest in the dry season. This brings to focus the contributory effects of water in gully erosion studies and hence, the importance of water budget analysis in flood and gully erosion studies and control in Agulu-lake and its environs. The objectives of the present study are to investigate and carry out water budget analysis of AguluLake areas and the underlying aquifers and relate these to the gully erosion problems. MATERIALS AND METHODS Field and desk studies were used. Field studies involved identification of major erosion sites, gully dimension measurements, discussions with affected community dwellers. Physiographic studies, hydrometeorological data were collected from EnuguAirport and the Ministry of Agriculture, Awka. Drainage measurement were taken and quantitative definitions of the water input and output done by dividing the study area into geologic blocks viz; Nanka, Imo. Nsugbe and Ogwashi-Asaba Formations. Aquifer hydraulics and parameters were computed. Rainfall, temperature, relative humidity, wind speed and sunshine data for ten years (1987-1997) were used. Data on the destructive events of floods, soil and gully erosion and landslides that are endemic in AguluLake area were collected. The water budget and erosion data are correlated to understand the ecological problems in the area. Geology Of The AnambraBasin: The study area lies within latitudes 5015’-5055’N and longitudes 7015’-6055’E, in the AnambraBasin. (Fig. 1). Subsistence of the Anambra plate due to folding and uplift of the Abakaliki-Benue fold belt in the Santonian stage produces the AnambraBasin. The basin is dominantly filled with clastic sediments constituting several distinct lithostratigraphic units deposited from Upper Campanian to Recent. The lithostratigraphic units have a thickness of up to 2,500m. These include; Nkporo Shale, mamu Formation, Ajali Sandstone, Nsukka Formation, Imo Shale, Nanka/Ameki, Sands/Formation, Nsugbe Formation and Ogwashi-Asaba Formations. The sediments were derived from the uplands beyond the Benue Hinge Line, the Abakaliki Uplands and the Benue fold belt. The youngest sediments are loose and exceptionally prone to erosion. Sampling was carried out from representative geologic formations as shown in figure 2. Mathematical Analysis Of Water Budget And The Results:Water budget is an application of the principle of conservation of mass expressed as measurement of continuity of water flow in a continuity equation. The general water budget is defined as: Input – Output – Increase in Storage = 0 (1) Output elements include groundwater recharge (GWR), evapotranspiration (ET), interception loss (IL), depression storage (DS), and runoff (R). Inputs (I) into the hydrologic system are from groundwater discharge and/or precipitation, which is principally rainfall. The average annual rainfall over the area is 1,854.79mm. Potential evapotranspiration (PET)was calculated using Penmann’s Formula (1948) and corrected to actual value (AET) using the hydrologic aridity index and the results are presented in Table 1. The Penmann’s Formula is expressed mathematically as; PET = Ahn + EaY/A + Y……(2) Where; PET = daily potential evaporation in mm/day; A = slope of saturation vapour pressure Vs temperature curve at mean air; temperature in mmHg/0C; Hn = net radiation (mm) of evaporatable water per day; Y = psychometric constant (0.49mmHg/0C); Ea = parameter including wind velocity and saturation deficit Table 1: Average PET And AET Values For Various Formations In The Study Area
The correcting factor used for AET is 0.35. Results show that A.E.T of the AguluLake area ranges from 1018.2mm/yr. in Ogwashi-Asaba Formation to as high as 1095.5mm/yr. in the Nsugbe Formation. Wide range of precipitation values corresponds to wide temperature ranges (330C to 270C) as well as the variation of vegetation: from densely vegetated areas underlain by the Imo Shale to the sparse vegetation in the Ogwashi-Asaba Formation outcrops. The agricultural Aridity index or anomaly and the severity measure of hydrologic aridity index (AI), a percentage measure of drought is given in Table 2 Table 2: Aridity Index Measure And Its Description (Subramanya, 1994)
Infiltration in different lithologies was calculated using the formula; R=α (P-Po)B (3) Where; R = infiltration (groundwater recharge); α = coefficient, depending on soil types (0.2 for all formations 0.192 for lake; recharge); Po = infiltration index (0.10cm/hr.) at maximum flood, for design purposes. B = value approximately. Infiltration results, presented in Table 3 show that loose/permeable soils have high values unlike the layered impermeable shales/clays. Even the fractured shales failed impart an expected infiltration increase. Table 3: Average Groundwater Recharge In The Study Area
Runoff values were computed using Barlow’s coefficient/equation expressed mathematically as; R = KbP (4) Where, Kb = runoff coefficient, P = precipitation, R = runoff. Computed results (presented in Table 4), show that the highest percentage of runoff (26% of the average annual precipitation) occurs in areas where the Ogwashi-Asaba Formation outcrops. This could be associated with sparse vegetation and average annual temperatures (29.660C). Table 4: Average Yearly Runoff In The Study Area
Aquifer Groundwater Volume: The Nanka Sand (the main aquifer of the AguluLake hydrological system), measures 5000m x 100m x 30m (Ogbukagu, 1988), giving an aquifer potential of 1.5 x 10⁷m3. An annual average precipitation of 1,751.23mm represents an input volume of 8.755 x 10⁵m3 into the lake. Ogbukagu, (1988) also shows that the average annual groundwater discharge from bordering aquifers into the lake is 7.4 x 10⁷m3/yr. The distribution of these results for the input and output values within each geologic formation is summarized as a general water budget (shown in Table 5). Table 5: General Ground Water Budget For The Hydrologic System P = Precipitation; E = Evapotranspiration; GWR = Groundwater Recharge;
R = runoff; * =Volumes (M3); A summary of the summation of the input and output elements of the water budget equation from the various formations of the hydrologic system is given as follows; (a) Groundwater discharge = 7.4 X 10⁷m3. Precipitation = 7.9 X 10⁵m3 Groundwater recharge = 1.72 X 10⁵m3; Evapotranspiration = 5.29 X 10⁵m3 Volume of water maintained throughout the year = 1.5 X 10⁷m3 (f) Runoff = 5.91 X 10⁷m3. Implications Of Analysed Water Budget In Gully Erosion Studies/Design: Overflow (Runoff)flows over the soil surface as concentrates in micro drainage patterns. The later merge to form rills, gullies or streams that provide drainage paths for runoff water. Flood studies shows that only 19.5% of the annual precipitation constitutes runoff (Table 5). Yet runoff constitutes main agent of gully and soil erosion, flooding and landslides. The high energy possessed by runoffs is expended on obstacles along its path- loosening and picking them up. Overflows are mostly devastating in August, September and October (flood months, water being slightly subject to evaporation). Infiltration controls runoffs, soil moisture content, and the binding forces between grains and hence influences slumping in existing gullies. The other effects of infiltration include; dissolving minerals from soils, reducing capillary tension that binds soils together, increasing bulk density of materials and hence altering intra-mass stresses. It induces hydraulic pressure and hence stresses the particles resulting in “quick-conditions”. It causes seepages, internal erosion and reduces the support offered by soil layers to the overlying materials and hence slumping and sliding. Rainfall. The gullying effects of raindrops (of diameter 6mm and velocity 305mm/sec common in the study area) as they strike the soil with intense velocity are summarized as follows; Expends its kinetic energy on soil particles to detach and splash them, initiating turbulence, which in turn initiates flow and increases the sediment-carrying capacity of fluvial erosion. Causes flow, develops tractive forces, which detaches soil particles and initiates movement. Concentrated overland flow gives rise to gully erosion, while unconcentrated flow gives rise to sheet erosion. Rainfall causes infiltration especially in the loose, uncemented and unconsolidated sands. Infiltration is responsible for every rampant slumping and sliding especially around existing gully sites, with resultant loss to life and property. Conclusion: Computed results and experience have shown that rainfall is the principal cause of flooding and siltation of streams, rivers, agricultural lands, property and sometimes loss of lives. Flooding often results from poor/absence of drainage systems. Water budget analysis for the area has identified August, September and October as the months during which erosion is at its peak, the anthropogenic and natural causes of gully/soil erosion. Computed data and results obtained are very vital in the design of drainages for flood/erosion control. Acknowledgement: This paper is dedicated to memory of our beloved colleague, friend and co-author, late Mr. Banlanjo Ernest Wirba.. REFERENCES
Copyright 2006 - Journal of Applied Sciences & Environmental Management The following images related to this document are available:Photo images[ja06047f2.jpg] [ja06047f1.jpg] | ||||||||||||||||||||||||||||||||||||||||||||||||||||||||||||||||||||||||||||||||||||||||||||||||||||||||||||||||||||||||||||||||
| |||||||||
