 |
| About Bioline | All Journals | Testimonials | Membership | News |
|
||||||
|
||||||
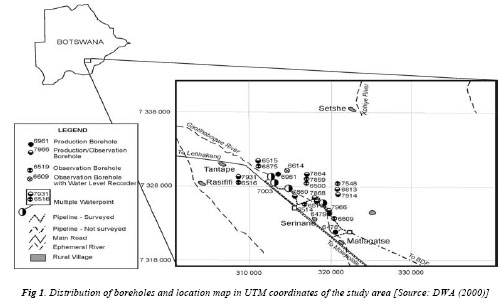
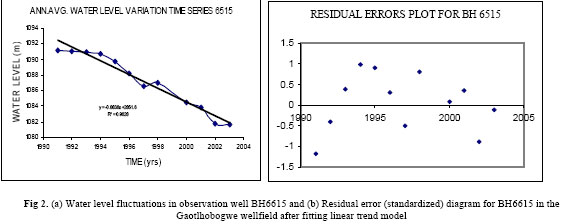
Journal of Applied Sciences & Environmental Management, Vol. 10, No. 3, September, 2006, pp. 59-65 Investigating the causes of water-well failure in the Gaotlhobogwe wellfield in southeast Botswana RON T. CHAOKA; *BERHANU F. ALEMAW; LOAGO MOLWALELFHE; OTENG M. MOREOMONGWE Faculty of Science, University of Botswana, Private Bag 0022, Gaborone, Botswana Code Number: ja06053 ABSTRACT: In the management of groundwater resources, identifying determinants of borehole failure is useful in planning borehole and wellfield remedial measures as well identifying appropriate water treatment mechanisms if deteriorating water quality prevails as a result of decline of borehole yield and water level. A continually declining well yield in the Gaotlhobogwe wellfield, in south eastern Botswana, triggered this investigation. The determinants of groundwater level decline, which reaches about 80% in the wellfield were identified and their contribution assessed through multivariate analysis. Even though there is a 50% of decline in the specific capacity of pumping wells within 8 years period from 1995- 2003, another 30% of the decline was found to be attributed to chemical determinants, namely as Mn, Mg, Fe NO3, HCO3, CO3 and SO4. The potential physical determinants are found to be pH, Ec and TDS. The geological and hydro-geological evidence of the possible causes of groundwater decline and the identified determinants is discussed in relation to borehole construction and completion guidelines for contractors and drillers. @JASEM Declining of borehole yield and groundwater quality is a common problem in wellfields in Botswana. An example of this phenomenon is found in the Gaotlhobogwe wellfield in south eastern Botswana. The location map for this wellfield and the distribution of boreholes in the wellfield are shown in Figure 1. The general objectives of the paper are: (1) to determine the trend and significance of groundwater level decline in the Gaotlhobogwe wellfield; (2) to determine the major causes of water well failure and declining yield in the wellfield; and (3) to identify the contributing variables for the decline of the water table. The study is based on hydro-geological and groundwater quality data that are collected from ten observation wells and six pumping wells that are part of the wellfield monitoring network. One way to determine the existence and significance of declining trend in groundwater levels would be to employ a linear trend model. This technique has been successfully applied to study variability of several types of hydrgeochemical variables such as for air and groundwater temperatures (Kazemi, 2004), air temperature (Comani, 1987), precipitation (Rodhe & Virji, 1976; Maheras & Kolyva-Mahera, 1990), lake levels (Marchand et al., 1988), annual river flows (Alemaw et al., 2001; Alemaw 2002; Giakoumakis & Baloutsos, 1997; Kite, 1993; Negum & Atha, 1992; and Srikanthan, et al., 1983).We also explore and report the factors that can cause aquifer depletion and borehole failure that relate to: (1) increase in water abstraction; (2) decline in recharge; and (3) decline in specific capacity. In another effort to investigate the possible determinants of groundwater level decline, we have used the statistical correlation analysis between the groundwater level and certain recorded hydrogeological variables recorded over the period 1995 - 2003 in the sixteen boreholes considered. The hypothesized determinants of groundwater yield decline considered are: hydrogeological variables (i.e. water abstraction, recharge, rainfall, specific capacity), physio-chemical variables (i.e. Mg, Fe, Ca, Na, NO3, HCO3, CO3, SO4, pH, Ec and TDS and microbiological indicators as typified by the presence of iron and sulphur reducing bacteria). Statistical correlation analysis has a wider range of applications in the earth sciences. Moore et al. (1998) used it to correlate well yield with geologic features in New Hampshire, England. It has also been used successfully to study factors that affect well yield in the fractured bedrock aquifer of New Hampshire (Moore et al., 2002) and in relating well yields to site characteristics of the same area (Moore et al., 2001). The geological and hydro-geological evidence of well failure by groundwater level decline are explored. The Study Area and Its Hydrogeology: The Gaotlhobogwe wellfield is located NW of Gaborone, Botswana’s capital, between UTM coordinates of grid references 300,000-340,000 Eastings and 7,318,000-7,348,000 North (Figure 1). It falls along the ephemeral GaotlhobogweRiver which runs sub-parallel to the Letlhakeng-Gaborone tarred road. The wellfield covers an area of approximately 160 km2 (DWA, 2000). Currently, this wellfield supplies water mainly to the villages of Molepolole, Thamaga and Thebephatshwa Air Base (DWA, 2000). Earlier works on this area show that most of the geological and lithological successions of the Gaotlhobogwe wellfield are made of the Karoo Supergroup rocksand the units of the Kalahari group overlie most of the study area. Gaotlhobogwe area is located on the southeastern fringe of the CentralKalahariKarooBasin in which the upper-most units are missing (DWA, 1995). This is where the lower Karoo wedges out into a pre-Karoo basement and also where an active groundwater system is assumed to exist (DWA, 1995). At a regional level the groundwater gradient is from the southeast to the northwest and tends more to the north as flow approaches the Zoetfontein Fault that is located 25 kilometers to the northwest of the study area (DWA, 1997). The gradient is steeper in the southeast which is expected as this is the recharge zone. The aquifer units exhibit confined conditions even in the absence of clear confining layers (DWA, 1997). This is due to the heterogeneous character of the units. Water strikes are generally shallow (50-60m below ground level) within the valley and 80-95m below ground level outside the valley. The water quality is potable in most of the wells. Salinity increases down gradient. METHODOLOGY The following techniques were employed in this study to investigate the prevalence of decline of groundwater level, specific yield and possible causes of decline: (1) Trend analysis, using two techniques namely the visualization technique and the statistical trend analysis, is used to quantify the water level decline in the Gaotlhobogwe wellfield. (2) Analysis of potential factors for aquifer depletion in the wellfield which can be related to (a) possible increase in water abstraction; (b) possible decline in recharge; (c) decline in specific capacity; (d) imbalance yield and pumping rate; and (e) possible groundwater quality deterioration. (3) Correlation analysis to identify the hydrogeo-chemical determinants of ground water level decline. Seasonal and annual changes in the chemical properties of the groundwater over the years are tracked. The results from the chemical analyses as well the biological and other parameters of the well were linked to the water level decline and the correlation between them and the water level analyzed. RESULTS AND DISCUSSIONEvidence of decline in groundwater yield: Results of the statistical significance of the trends obtained in the observation boreholes is summarized in Table I. From this table, the slope of the linear trend model is declining (negative slope), and all the negative slopes were found to be statistically significant in all the boreholes. The linear trend model seems to be an appropriate model to represent much of the variability in the historical ground water level fluctuations with very high coefficient of determination (R2) value except in one borehole (BH 6613). A plot of the annual variation of observed water level fitted with a trend line and the corresponding residual diagram of errors after the linear model fit for BH 6615 are shown in Figure 2. The visual plots and the results from the linear trend modeling reveal a significant decline of the groundwater table. The reported 40-60% decline in the specific capacity of the pumping wells in the wellfield from their time of installation in 1995 to 2003 can be partly explained by the significant drop in the groundwater table. Possible causes of aquifer depletion and groundwater failure:For an aquifer to maintain hydrologic balance and operate under sustainable conditions, the total output including abstraction must equal recharge. If the total output is more than the total input then the aquifer is said to be mined and is bound to depletion. This can cause a decline in the well yield. This problem persists in most of the wellfields in Botswana (DWA, 2000). Aquifer depletion can relate to the following few factors: (1) increase in water abstraction; (2) decline in recharge; and (3) decline in specific capacity. The detail account of each is provided below. Table I. Slope and the statistical significance of the declining trend of the observation boreholes in the study area
Increase in water abstraction:Increase in borehole water abstraction can contribute significantly to decline of ground water level. For this study, annual water abstraction data for the various boreholes in the wellfield was obtained from the Department of Water Affairs (DWA). The annual water abstraction which grows in proportion to the increasing population and water demand has a tendency of increasing trend from 1998 to 2003. Potential decline in rainfall and groundwater recharge: Decline in recharge can significantly affect ground water level. For the Gaotlhobogwe wellfield, annual recharge values were determined from the concurrent annual rainfall data using a model developed for Karoo aquifer systems by Sami (2003). The model was developed based on chloride mass balance and an integrated surface and a subsurface model. The groundwater recharge follows the rainfall pattern, which is found to have no clear trend in the period of analysis considered. Possible decline in Specific Capacity: There has been reported decline in specific capacity of production boreholes in the wellfield that virtually would attribute to the decline of ground water level. DWA (2003) conducted a study to document decline at four boreholes and the results are shown in Table II. Actual yield and pumping rate:Comparison has also been made between the actual yield of the production boreholes and their pumping rate over time. Table III summarizes this state of the boreholes in which it is evident that the boreholes are operated below their rated capacity as established from pump testing.Possible wellhead water quality determinants:Chemical and physical groundwater quality indicators viz., pH, EC, TDS, CO3, HCO3, SO4, Ca, Mg, Fe, and Mn, were collected for the period 1995-2003, besides concurrent data on water abstraction, specific capacity, recharge and rainfall. Analysis of the water quality indicators reported in DWA (2003) have been adopted for this study. Through statistical correlation analysis we determined the statistical significance these in relation to groundwater level decline. TABLE 2. The extent of the decline in the specific capacity of the pumping wells in the Gaotlhobogwe Wellfield (DWA, 2003).
Table 3. Comparison between the well yield, and the pumping rate which shows that the pumping rate does not exceed the well’s yield
Correlation analysis: Pearson correlation analysis was conducted between ground water level (in m bgl) and the various hydro-geochemical parameters. These include: (1) abstraction, (2) specific capacity, (3), recharge, (4) rainfall, (5) pH, (6) EC, (7) TDS, (8) CO3, (9) HCO3, (10) SO4, (11) Ca, (12) Mg, (13) Fe, and (14) Mn. Table IV shows the correlation coefficients (r) and their statistical significance for four pumping wells. The data were first normalized for quantitative assessment of correlation of the variables. In general, the values of r range between -1 and 1, where values close to -1 and 1 indicate a strong negative and positive correlation, respectively, with low values of significance level of the error unaccounted for by the correlation between the variables. While r values close to 0 signify weak correlation in which significant variation is not accounted for by the correlation. Table 4. Summary of correlation coefficients in terms of Pearson correlation ceofficent (r) and significance level (Sig.) (1-tailed) between groundwater level and various hydro-geochemical variables in the wellfield.
From Table IV, it can be observed that all of the variables used except four (iron, manganese, carbonate and TDS) manifest a weak positive association or no association at all with water level. Ca shows a weak positive association in boreholes 7860, 7864 and in borehole 7914 but a weak negative association with water level in borehole 7931. The association between the water level and the hydrogeological variables is weak and negative showing that when there is high rainfall there is high recharge hence the drop in water level is small. Also from the table there is a weak positive association between the water level and the abstraction indicating that an increase in abstraction leads to an increase in the water level drop. Conclusion: The following conclusions are drawn from this study in assessing the potential causes for the failure and decline of yield of the Gaotlhobogwe wellfield: (1) Evidence from the statistical trends analysis and the visual presentation of time series graphs show that the water table in the wells is declining. A consistent decline in the water level averaging 1.6m per annum is recorded. The coefficient of determination of a fitted declining trend model for the groundwater level reaches the range of 64% to 96%. (2) The results from statistical correlation analysis reveal that even though the correlation of groundwater level with recharge and specific capacity are negative but very weak. Among the hydro-chemical variables, a weak positive association exists between Ca and groundwater level. (3) CO3, TDS, Fe and Mn are the only components showing a strong association with water level. This association is positive in some wells and negative in others. Calcite was identified as the substance responsible for clogging some boreholes in the wellfield. In particular 7931 located in the western end of the valley, clogging is caused by the precipitation of calcite. This was identified using XRD analysis and thermodynamic data on calcite. (4) It can be concluded from the statistical correlation analysis that the decline in groundwater level is strongly influenced more by hydro-geochemical parameters than by the hydrogeological variables such as recharge and specific capacity. (5) The important physical parameters governing the state of each of the above cations and anions are pH, Ec and TDS. Of all the three the most important is the pH as it governs the solubility of minerals into the water system and their precipitation out of solution. (6) Calcium shows a strong positive association with the water level in all the boreholes. This maybe because it is capable of forming precipitates with anions like CO3 which can block the groundwater flow to wells. (7) The well performance is affected by a number of factors. Chief among these is the geology, which in turn affect the chemical constituents of the water. Other contributory factors include the way the well designed, constructed and the operated. Acknowledgments: The authors would like to thank the Departments of Water Affairs and Geological Surveys of Government of Botswana for providing the necessary assistance and hydrogeological data. The University of Botswana also appreciates the support graduate MSc students to take part in groundwater research in Botswana, which made this publication possible. REFERENCES
Copyright 2006 - Journal of Applied Sciences & Environmental Management The following images related to this document are available:Photo images[ja06053f2.jpg] [ja06053f1.jpg] | ||||||||||||||||||||||||||||||||||||||||||||||||||||||||||||||||||||||||||||||||||||||||||||||||||||||||||||||||||||||||||||||||||||||||||||||||||||||||||||||||||||||||||||||||||||||||||||||||||||||||||||||||||||||||||||||||||||||||||||||||||||||||||||||||||||||||||||||||||||||||||||
| |||||||||
