 |
| About Bioline | All Journals | Testimonials | Membership | News |
|
||||||
|
||||||
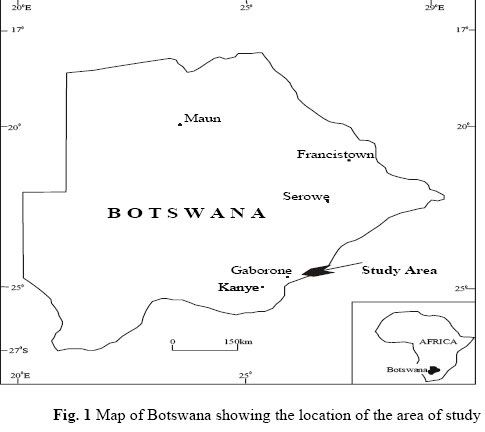
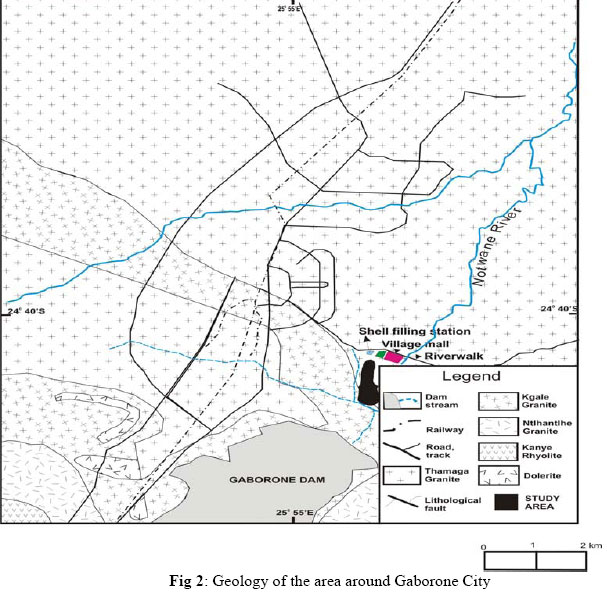
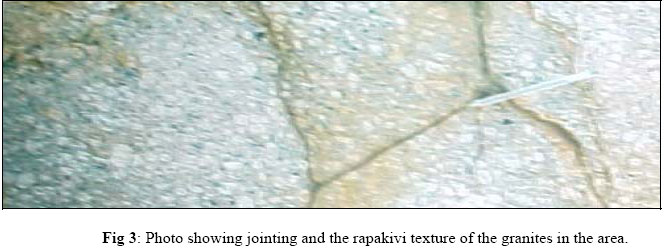
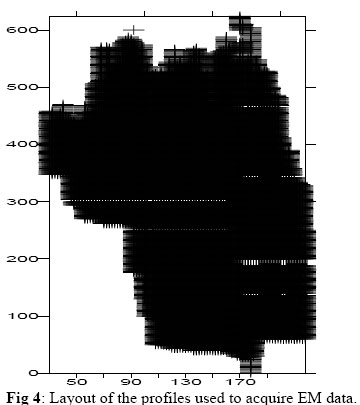
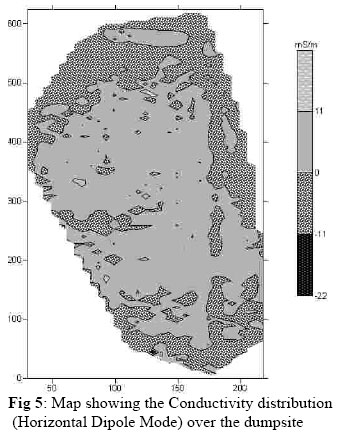
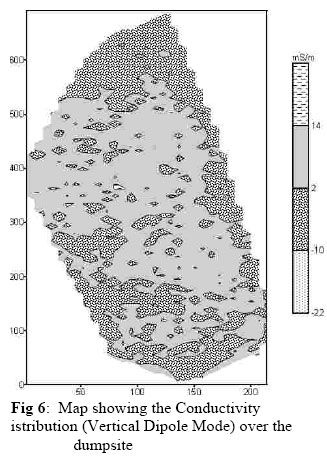
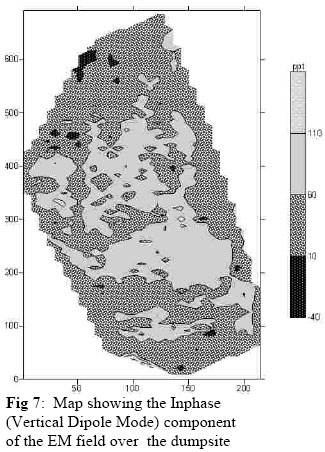
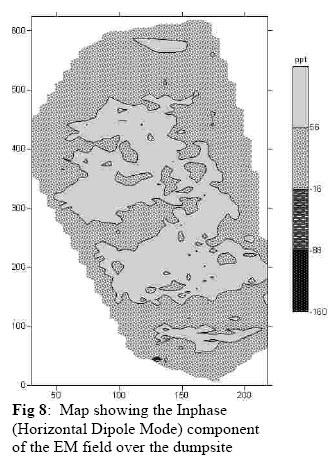
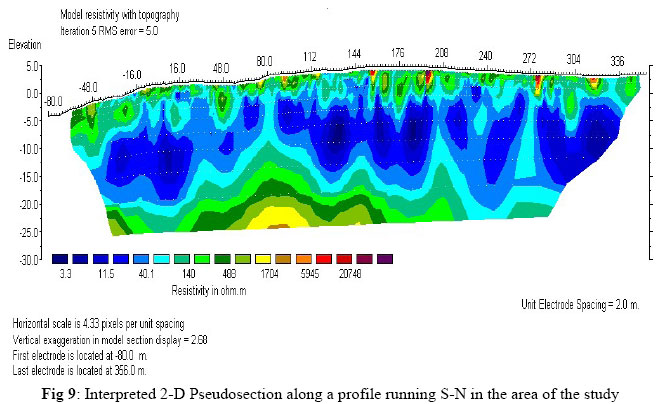
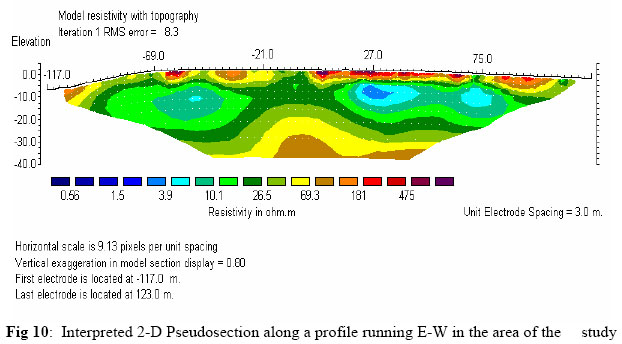
Journal of Applied Sciences & Environmental Management, Vol. 10, No. 3, September, 2006, pp. 87-92 Geophysical Investigation of the Old Gaborone Dumpsite, Botswana SHEMANG, E M; MOLWALEFHE, L; CHAOKA, TR; MOSWEU E; NONDO, M Department of Geology, University of Botswana, Private Bag, UB 00704 Gaborone, Botswana. Code Number: ja06057 ABSTRACT: A surface geophysical investigation consisting of electromagnetic (EM) and resistivity survey techniques was carried out on the Gaborone old dumpsite that was commissioned in 1982 and decommissioned in 1992. The aim of the study was to map the physical boundaries of the decommissioned dumpsite, map the distribution of waste and identify zones of leachate concentrations within the dumpsite The results of conductivity measurements using the EM technique show a wide distribution of conductive materials, which represents zone of active leaching. This zone is mostly concentrated in the centre of the old dumpsite. Inhase measurements also identified zones occupied by metallic waste that are less distributed over the dumpsite. Results of the resistivity survey indicate a three layer structure in the area. The top layer is a more resistive cover material (68 - 127 Ωm.) and varies in thickness from place to place. The second layer is a low resistivity zone (3-40 Ωm) and indicates a zone of high leachate activities. At the bottom is a more resistive layer (greater than 500 Ωm) which is likely to be basement rocks that underlie the old dumpsite. The resistivity survey results provide better information about the subsurface conditions in the old dumpsite. @JASEM In Botswana, a long-term waste management strategy has been developed with the objective of achieving a state of sustainable waste management. The aims of this waste management policy are to protect human health, the environment and natural resources. In order to achieve the set out waste management objectives, the Gaborone City Council (GCC) closed the old dumpsite (operated from 1982-1992) and opened a landfill, which is located in the vicinity of the old dumpsite, The Landfill is designed, constructed and operated so as to ensure minimal environmental impact in the surrounding areas. Groundwater in the vicinity of landfills can be contaminated by leachate from the waste deposited (Bernstone and Dahlin, 1996; Hensel and Dalton, 1995). Dumpsites do not have lined base layers and therefore the possibility of dumpsites polluting surface and groundwater in their vicinity is very high The old GCC dumpsite (located in Gaborone, Figure 1) was sited on the basement complex rocks (Figure 2). The rocks of the area are structurally stable, though a system of joints and fractures (Figure 3) exist in the area. These joints and fractures could serve as migration channels for leachates (pollution plumes) to establish contact with the environment. The dumpsite covers an area of 300 by 650 meters. It contains waste of up to 5m high relative to the ground surface. The long axis of the dumpsite or the length is oriented in the north – south direction. The ground around the dumpsite slopes towards the NotwaneRiver (Figure 2). On the western side of the dump site is a small stream which runs in the south east direction. Drainage in and around the dumpsite runs into the small stream which discharges its waters into the NotwaneRiver. The present study was therefore aimed at mapping the physical boundaries of the decommissioned GCC dumpsite, mapping the distribution of waste within the dumpsite and identifying zones of leachate concentrations within the old dumpsite To achieve this, non-invasive geophysical techniques (Conductivity and DC Resistivity methods) were applied to study the area. Conductivity geophysical techniques can be used to map out areas where conductive materials are concentrated while the resistivity geophysical techniques have the potential of not only mapping the extent of the closed dumpsites, but can also reveal potential pollution plumes and their direction of migration and therefore provide a basis for remediation if the environment is under threat. MATERIALS AND METHODS Data Acquisition: Profiles running from S-N were laid out in the area at 2 m spacing over the Old Gaborone Dumpsite. All together 110 profiles (Figure 4) were established and data collected along these profiles. For the conductivity measurements, the Geonics EM31-MK2 ground conductivity meter with the data logger was used to collect data at 2 m intervals along the pofiles. The equipment was operated in the horizontal and vertical dipole modes resulting in depth variation 3 m and 6 m. Inphase and quadrature components of the magnetic field were measured in the vertical and horizontal dipole modes. Resistivity Measurements:2-Dimensional Resistivity Imaging was carried out along 2 profiles (one running from S-N and the other from E-W) in the area using the ABEM Lund Imaging system and an electrode spacing of 2 m for the S-N profile and 3 m for the E-W profile. Data were measured as continuous vertical electrical soundings (CVES) roll-along (Dahlin, 1996; Dahlin and Bernstone, 1997) using the Schlumberger array. The measurement protocol is computer controlled (Griffiths et al., 1990) and provides 10 different spacing, from 2-48 meters resulting in a depth of penetration of about 40 m. Elevation surveying was carried out using a total station with the aim of obtaining the topography of each electrode point along the profile. Elevation data obtained from the topographic survey were used for topographic correction of the resistivity data. Data Processing and Interpretation: The EM data were transferred to a computer from the polycoder. The Microsoft Excel Spreadsheet software was used to create rows which contained the x and y locations of each station and the measured inphase and quadphase values at each station. Conductivity and inphase maps were then produced using Golden Software Surfer 8. Figures 5 and 6 show the map of the conductivity (horizontal and vertical dipole modes) whilst figures 7 and 8 show maps of inphase (horizontal and vertical dipole modes) in the area. The resistivity data were interpreted using 2.5D smoothness constrained inversion, employing a quasi-Newton technique to reduce calculations (Loke and Barker, 1996). A 2-D model is used by the inversion program, which consists of a number of rectangular blocks, with the arrangement of the blocks loosely tied to the distribution of the data in the pseudosection. A forward modelling subroutine is used to calculate the apparent resistivity values and a non-linear least-squares optimisation technique is used for the inversion routine (deGroot-Hedlin and Constable, 1990; Loke and Barker, 1996). RESULTS The inphase component (measured in units of parts per thousand of primary electromagnetic field of instrument) was primarily used for detection of metal objects. Negative values usually indicate that the instrument is oriented perpendicular to a highly conductive object and extremely high positive values of conductivity indicate that the object is aligned parallel to the orientation of instrument (Geonics, 1995). Figure 5 shows the conductivity map (horizontal dipole mode, with depth of penetration of 3 m). This map shows that over 98% of the area is underlain by materials with conductivities in the range of -11 to 11 mSm-1. The conductivity values of between -11 to 0 mSm-1 reflect conductivities the cover materials where the dump materials are probably buried deeper. Values of between 1-11 mSm-1 are reflecting the conductivities of the topmost part of the waste dump materials (leachates). Fig 6 is a map of conductivities (Vertical Dipole Mode) with a depth of up to 6 m. This map represents conductivities of waste materials. The average conductivities of (10 mSm-1) suggest the presence of conductive materials which are most likely leachates from the decomposing waste materials. Other parts of the map show low conductivities especially at the edges of the dumpsite, suggesting the presence of less waste materials and probably more cover materials in place. Figures 7 and 8 show the inphase components of the magnetic field in the dumpsite. Areas with high inphase values show where metallic objects (e.g. iron rods) exist in the area. The presence of iron rods within the dumpsite is common as some of these rods were seen on the surface in the dumpsite. 2-D Electrical Resistivity Imaging Results Pseudo-sections shown by figures 9 and 10 are the results of the inversion of the 2D-resistivity data obtained in the area. Figure 9 is the interpreted pseudosection of the 2-D profile running from S-N over a distance of 450 m in the dumpsite. The pseudosection shows three pronounced layers of different resistivities. The top layer which is about 2 m shows resistivities of between 68 and 127 Ωm. This represents the resistivity of the cover material. The cover of the dumpsite as seen from the interpretation is thinner in some parts of the dumpsite. The areas with thin cover coincide with the ones in figures 5and 6 where conductivities are seen to be high.The middle layer is represented by very low resistivity values (3-40 Ωm). The low resistivity areas are interpreted as trash cells areas where dump waste materials are located and leachates activities are high. From the cross-sections the thickness of the layer can be estimated to be up to ten meters. Some low resistivity areas penetrate the cover of the dumpsite. These are areas where the cover material of the dumpsite is very thin or even absent. The bottom layer seen on the interpreted 2-D section represents the basement rock of the dumpsite. This layer is represented by very high resistivity values of (greater than 500 Ωm). The average depth to fresh rock ranges between 12 and 15 m. Conclusion: From the results of the present study, areas of active waste decomposition and leaching were mapped out and were seen to be concentrated at the centre of the dumpsite and less at the margins. Metallic waste in the area is also seen to be more prominent at the centre of the dumpsite, hence prominent inphase anomalies are observed in those areas. Three layers of Resistivity have been mapped, and they indicate the three prominent zones in the dumpsite. The topmost layer is the cover material, made of rubbly materials and soils; the middle layer is a low resistivity zone of varying thickness. This zone is thought to be that of high leachate activities. The lower layer which is highly resistive is the basement rocks. The results of study indicates that electromagnetic and electrical resistivity can be used to effectively map areas of active decomposition that are characterized by anomalous conductivities and attendant low resistivities. It can also be used the map out the subsurface boundaries of different materials in a dumpsite of similar nature. REFERENCES
Copyright 2006 - Journal of Applied Sciences & Environmental Management |
