 |
| About Bioline | All Journals | Testimonials | Membership | News |
|
||||||
|
||||||
Journal of Applied Sciences & Environmental Management, Vol. 10, No. 3, September, 2006, pp. 147-150 Determination and estimation of Cadmium intake from Tarom rice 1*MOHAMAD ALI ZAZOLI; 2EDRIS BAZERAFSHAN, 3ASOUMEH.HAZRATI, 4ALI TAVAKKOLI *1Department of Environmental Health, School of Public
Health ,Tehran University of Medical Sciences, Tehran, Iran and Mazandaran
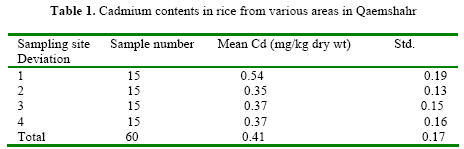
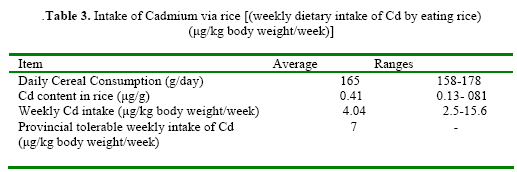
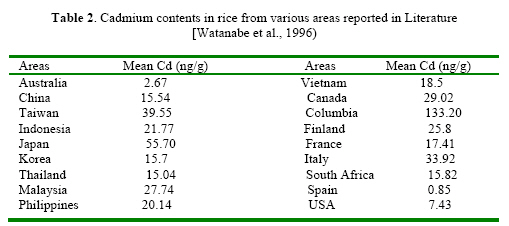
University of Medical Sciences, Sari, Iran Code Number: ja06067 ABSTRACT:Cadmium (Cd) is one of the most well-known environmental intoxicants to humans. Its entrance to food chain causes the serious damage in humans. One of the major sources of Cadmium intake is rice for rice eating countries such as Iran. Cadmium in rice comes from soil through plant roots. Thus, Rice may be the best indicator for the environment monitoring of Cadmium especially in rice eating countries. The aims of this study were to determine of Cd contents in tarom rice and to assess Cadmium intake from rice. A total of 60 samples were collected from four areas of Qaemshahr region in Mazandaran province (North of Iran). The samples were collected in during harvesting of rice in filed. Rice samples were digested by acid digestion method and analyzed by atomic absorption spectrometer. To assess the daily intake of Cd by rice, from daily consumption of rice was calculated. The results showed that average concentration of Cd in rice was 0.41±0.17 mg/kg dry wt. Notably the Cd content in the rice samples was found to be upper the FAO/WHO Guidelines. Also weekly intake of Cd from rice was upper than the maximum weekly intake recommended by WHO/FAO. @JASEM Cadmium (Cd) is one of the most well-known environmental intoxicants to humans (WHO., 1992) It is one of the elements that have no constructive purpose in the human body. In mammals, Cadmium is virtually absent at birth accumulates with time, especially in the liver and kidneys that can lead to health problems (WHO., 2004). Its presence in nature and entrance to human’s food chain, causes the serious damage in kidneys, lungs, bones and also anemia and sometime hypertension (Afshar et al.,2000). It is also known that people, especially those who take rice (Oryza Sativa) as staple food for daily energy, are inevitably exposed to significant amounts of Cadmium via rice, rice cropped even from non-polluted areas may contain Cadmium (Watanabe et al.,1996) because fertilizers that are used in farm, had amounts of Cd. Its entering to the environment is from both natural and anthropogenic sources (Lin et al., 2004). The most important anthropogenic sources of soil pollution to Cadmium are industrial sludge sewage discharging, applying super phosphate fertilizers burying the non-ferrous wastes in land and closing the agricultural fields to lead and Zinc mines or refining factories (Afshar et al.,2000). The major source of Cadmium intake is rice for rice eating countries. It was identified as the major source of cadmium intake among of Itai-Itai disease endemic in Jinzu river basin in Japan in the mid 20th century (Shimbo et al.,2001). Approximately 50% of the daily intake of Indonesian comes from rice and for the Japanese, about 40 to 60% (Rivai et al.,1990). Thus, heavy metals such as Cd contaminate source and accumulate in both agricultural products and sea food through water, air and soil pollution if waste discharge not properly treated. For example, Cadmium polluted rice in Taoywan Country resulted from the illegal discharge of wastewaters from chemical plants and metal recycling factories (Lin et al., 2004). Moreover, heavy metals can enter the food chain from aquatic and agricultural ecosystems and threaten human health indirectly (Watanabe et al.,1989). It is know that Cd content is much higher in rice bran than in polished rice grains (which essentially consist of albumen) (Zhang et al.,1998), only but unpolished (brown) rice is a combination of bran and albumen. The Joint FAO/WHO Expert Committee on Food Additives (JCEFA) has proposed a maximum level of 0.2 mg/kg Cadmium in rice but the community warned that "people who eat a lot of rice from regions containing the higher levels of Cadmium could be significantly exposed". JECFA has set the Provisional Tolerable Weekly Intake (PTWI) for the Cadmium of 7 μg/kg of body weight (WHO.,2004).The objectives of this study were to determine Cadmium content of raw rice (var: tarrom) in Qaemshahr region in Mazandaran province in the north of Iran and also and to assess Cadmium intake from rice based on weekly Cadmium intake from rice. MATERIALS AND METHODS Rice samples were collected in four areas in Qaemshahr region in Mazandaran province. The first step, samples were collected in rice farms when formers harvested their crops. Collections were made by chance.A total of 60 rice samples were sampled from four majors rice production areas that 15 samples took from any area. To determine Cd concentration in raw rice, a portion of rice grains cleaned and about 2 grams were taken and weighed, dried at 105°C for 48 hours, and weighed again to determine water content. Then , the sample was digested by a nitric-perchloric acid digestion method based on annual book of ASTM standards (ASTM.,2000). Each rice sample was refluxes in a premixed solution of concentrated nitric and perchloric (70%) acids (3+1) at the rate of 20ml per gram of sample. 2.5 ml of sulfuric acid (spg. 1.84) was added per gram of sample. Then, the mixture was swirled and allowed it to stand for 30 min. Then the beaker was covered with an acid-washed watch glass, places it on a hot plate and gradually increased the temperature until the mixture is boiling. The boiling was continued until evaporation had occurred and perchloric fumes were evolved. The heating was terminated when about less than 3 ml of a clear liquid obtained. Afterwards, deionized water was added to bring the digest to 25ml. The digested solution was analyzed for Cd content by flame atomic absorption spectrometer (Chemtech, Eng and Alpha-4). All of samples were digested as duplicate. Each sample was analyzed two or three times at a wave length of 229 nm.Concentrations were expressed in terms of mg/kg on a dry weight basis. Analysis was done by SPSS programe. Analysis of variance (ANOVA) followed by multiple comparison (Scheffe) were employed to detect significances between or among samples. Weekly or daily Cadmium intake from rice was calculated by Cadmium content in rice multiplied to weekly (daily) rice Consumption (Rivai et al.,1990; Nogawa and Ishizaki ., 1979). RESULTS AND DISCUSSION Cadmium content in rice: The results of cadmium contents in sixty samples of raw rice from four areas are shown in table 1. These results indicated that the mean value of Cd concentration in rice is 0.41 mg/kg on dry wt basis and range is 0.13 – 0.81 μg/kg dry wt. The food sanitary standard of Cd in rice on FAO/WHO codex was 0.2 μg/kg. Therefore, the average content of Cd in Iranian rice is over the maximum permitted level for rice. The results revealed that Less than 12% of rice samples had Cd content below 0.2 mg/kg and also the amount of Cd content in 88% samples were above 0.2 μg/kg level.ANOVA analysis showed that there was a significant difference in Cadmium contents in rice (P<0.003). Comparing the results in table 1 with Cd content of rice from other countries it appears that the obtained values were upper Cd content in Iranian rice. Table 3 presents the values of Cd that reported in literature (Watanabe et al.,1996). The mean Cadmium content values in rice reported to data ara 50 ng/g dry wt for Japan in 1998-2000 (Shimbo et al.,2001), 0.01 mg/kg dry wt to Taiwan in 2004 (Lin et al., 2004). When the present observation is compared with the values reported in previous studies in Iranian rice, it is appears that there has been changes in Cd contents and may have been increasing gradually additionally, the average Cd contents in the rice samples of this survey is lower than is a similar survey was done in years 1993 and 1998.Afshar and et al (1993) determined Cd content in Amol rice (a kind of Iranian rice) found that mean Cd concentration in Amol rice was 0.09 mg/kg (Afshar et al.,2000). The studies of Khani and et al (2000) showed that averaged Cd content in raw rice produced in north of Iran was 0.34 mg/kg and range was 0.25- 0.45 mg/kg, also showed that Cd content of soil was increasing gradually from 33 mg/kg in 1998 to 34 mg/kg in 1999 (Khani and Malekoti.,2000a; Khani and Malekoti.,2000b). Hence there has been a gradual increase in the Cd contents in Iran rice and also the situation, at this moment seem to pose a great threat, with increase in rice consumption this situation could easily change. There were a substantial difference in Cd contents among in consumed in various areas in Asia and elsewhere (Lin et al., 2004). In sum investigation of Cd content of rice from different countries revealed a range from 0.0008 to 0.13 mg/kg with the average being 0.03 mg/kg. the reasons for higher Cd contents in rice is complex, whereas Cd in rice grains is from soil and rice harvested from paddy fields rice in Cd trends to contain Cd at a high level (Watanabe et al.,1996; Nogawa and Ishizaki ., 1979), absorption of Cd from soil to the rice grain is extensively modified by the redox potential of the soil, which is affected the degree of water cover of the paddy (Watanabe et al.,1996; Valdares et al.,1983)solubility of metals is known to increase with a decrease in soil pH and hence plant metal uptake is higher in acidic soils than in calcareous soils .Metal uptake due to soil pH under the present state is limited in both soils , but any reduction in pH soil in these farms could raise metal availability and metal Uptake by plants , which also could increase health risk. It is also known that there is a linear relationship between metal availability and organic matter content (Basta and Tabatabai.,1992). (Table 2) Dietary intake of Cadmium: The intake of Cd was estimated by multiplication of daily consumption with Cd contents in rice (Shimbo et al.,2001; Zhang et al.,1998). The codex committee on food additives and contaminants of the joint FAO/WHO Food Standards, programe, has proposed draft levels for typical daily exposure and theoretical tolerable weekly intake (PTWI)for some of heavy metals in cereals such as rice. JECFA has set PTWI for the Cadmium at 7 μg/kg of body weight (WHO., 2004). According to the published papers, daily consumption of rice in Asia countries ranges between 158-178 g/person-day and the average is 165 g/person-day, and the average body weight is 60 kg/person(Rivai et al.,1990; Nogawa and Ishizaki ., 1979). The table 3 shows weekly intake of Cd from rice (Rivai et al.,1990; Nogawa and Ishizaki ., 1979). The weekly intake of Cd from rice in this study was 4.04 μg/kg body weight/week accounts for more than 57% of total dietary Cd intake. Table 3 reveals that weekly Cd intake from rice were below the maximum weekly intake recommended by WHO/FAO. But we do not forget other foods that contain Cd such as fish, wheat and vegetable consumption by community, the situation could worsen in the future Table 3 shows that the Cd intake via rice is the highest in this study compared to the studies in other countries (Watanabe et al.,1996; Lin et al., 2004;Shimbo et al.,2001). This high value is due to the facts that the large amount of fertilizer used in rice fields and these fertilizers had high values of Cd. As discussed, Iranian probably intake more than 57% in the total dietary intake through rice but this values are 7-32% in Japans people [Shimbo et al.,2001] and Taiwan people intake 3% of total dietary (Lin et al., 2004). Approximately 50% of the daily intake of Indonesian comes from rice (Rivai et al.,1990).Thus, health risk is maximum in Iran for Cd intake and also this risk will increase with consumption of vegetable, fish and etc in the future. Periodical monitoring of rate of contamination and consumption is thus necessary to assess the overall exposure level in Community. Treatment and remediation of polluted soils and environment, prevention of using of high fertilizer could reduce health risk. REFERENCES
Copyright 2006 - Journal of Applied Sciences & Environmental Management The following images related to this document are available:Photo images[ja06067t1.jpg] [ja06067t3.jpg] [ja06067t2.jpg] |
| |||||||||
