 |
| About Bioline | All Journals | Testimonials | Membership | News |
|
||||||
|
||||||
Journal of Applied Sciences and Environmental Management, Vol. 11, No. 4, 2007, pp. 41-46 Impact of effluent from gudu district sewage treatment plant on gudu stream in Abuja, Nigeria. †*DOUGHARI, JH. AND **DODO, JS *Department of Microbiology, Federal University of Technology, Yola; P.M.B.
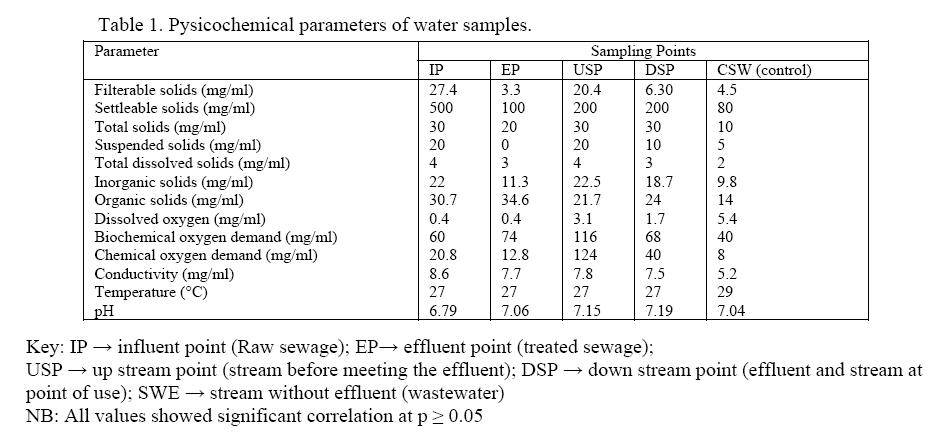
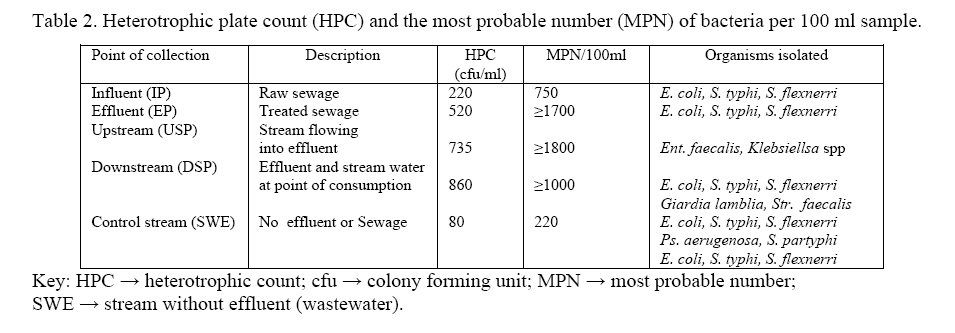
2076, Adamawa State, Nigeria. *Corresponding author: Doughari, JH. E-mail address - jameshamuel@yahoo.com Code Number: ja07091 ABSTRACT: Gudu stream, the major stream providing water for Durumi 1, Durumi 2 and Durumi 3 settlements of Gudu District in Abuja, Nigeria was studied for impact assessment of discharged effluent from the Gudu District wastewater treatment plant. Studies on the physicochemical properties of the stream revealed high concentration of contaminants at the point of effluent discharge (IP) and upstream (USP). The effluent had no effect on the temperature of the stream at all points sampled (27° C). Bacteriological analysis revealed the most probable number (MPN) to be highest at USP (=1800/100ml) and EP (=1700/100ml), followed by that of DSP (1000/100ml) and the least value was obtained at IP (750/100ml). Escherichi coli, Salmonella typhi, S. paratyphi, Shigella flexnerri Klebsiella spp and Pseudomonas aerugenosa. Escherichi coli, Salmonella typhi, S. paratyphi, Shigella flexnerri were the prevalent bacteria isolated at all the points sampled. Water is very essential to life. It making about 80% living protoplasm and, is required as medium for all metabolic reactions taking place in the cell (Brock and Madigan, 1991). As such no living thing, including man can survive without water. Human settlements are often established near water sources. Gudu district is one of those settlements, located South-West zone of the Federal Capital Territory (FCT) Abuja, Nigeria and has been in existence long before the inception of the capital city with an average population of about 12,966 mainly made up of the Gwari ethnic group, mainly farmers, fishermen, petty traders and beer hawkers. The District was carved out to be part of the FCT which is located between latitude 8.25 and 9.20 (7o 20') North of the Equator and longitude 6.45 and 7.39 (6o 45’ and 7o 39') East of the Greenwich Meridian, The annual total rainfall is in the range of 1100mm to 1600mm. The rainy season begins from April and ends in October with maximum and minimum temperature of 28 – 40 ºC on the Richter’s scale. The study was conducted on the Gudu stream of Gudu District. Three main communities, Durumi I, Durumi II, and Durumi III depend on this stream which runs through these three settlements as their major source of drinking water and for other domestic activities. The Gudu stream receives effluent from the Gudu District wastewater treatment plant as well as domestic wastewater from the surrounding settlements. Wastewater (sewage) is a serious source of water pollution due to its composition (Singleton, 1999). Pollution of water with sewage leads to the introduction chemical contaminants and pathogenic organisms such as bacteria, viruses, protozoa and helminthic worms (Osi, 2003). Chemical contamination of water has serious health implications. Contamination with mercury for instance, leads to its conversion to methyl mercury which is a lethal nerve toxin for humans. While the presence of pathogenic microorganisms on the other hand is the major cause of epidemics of diseases including gastroenteritis, dermatitis, poliomyelitis, enteric fever, bacillary and amoebic dysentery (Singleton, 1999; Prescott, et al., 2002). Because of the associated dangers of sewage this study was carried out to investigate the impact of the wastewater effluent discharged into the Gudu stream and their possible health implications. MATERIALS AND METHODS Sample collection 250 ml of each sample was collected at five different sites as follows: raw sewage (influent), just before it was discharged into the sewage treatment plant, the effluent (treated sewage) just before it was discharged into the stream, from upstream just before the effluent and the stream water mixes, and another sample about 30 m away from the mixed point (down stream) following the method of Binathen, (1993). A sterile sample bottle was dipped into the effluent source at right angles to allow the water to flow in to it and was immediately removed when the bottle was three quarters full and immediately covered and taken to the laboratory. Methods The samples were analyzed for the presence of settleable solids, total solids, filterable solids, suspended solids, organic and inorganic solids as described by Oni, (1997). Briefly, 2 liters of samples were collected in four clean sampling bottles and shaken well to mix. One liter each of the sample was transferred into a clean calibrated Imhoff cone and was allowed to stand for 60 min on a rack. The quantity of solid that settled (settleable solids) were estimated without decanting the supernatant. For total solids, four clean crucibles labeled 1, 2, 3 and 4 were weighed using an analytical balance. The crucibles were then heated for 1 h in an oven at 103 ºC, allowed to cool and then reweighed until constant weights were obtained; this was recorded as the initial weight, W1. 50ml each of the sample was introduced into the crucibles and evaporated using water bath. After evaporation the crucibles and the residue in them were dried in the oven for 2 h at 103 ºC then removed and cooled in a desicator and the weight, taken as final weight, W2. The total solid was estimated using the formula (Oni, 1997): W1 – W2 (gm)/ Total solids (ppm) = Volume (ml) of sample x 10 For determination of filterable solids, pre-weighed filter papers were used to filter 500 ml of water sample. The filter papers and the solids were dried in an oven at 103 ºC until constant weights of the residues were obtained and the difference between the original weight of the filter paper plus the residues was considered as the weight of the filterable solids. The same procedure was repeated for estimation of suspended solids using 500 ml of filtered water sample. Four crucibles were labeled 1, 2, 3 and 4 and weighed. 50 ml of the filtered samples were measured into correspondingly labeled crucibles and evaporated in a water bath. They were then dried at 103 ºC in an oven. The samples were cooled in a desiccator and their weight estimated using analytical balance. The procedure described above was repeated for the determination of organic and inorganic solids but this time using 200 ml of sample. After evaporation, the crucibles and their respective contents were weighed again. The differences in weight with the original individual crucibles without sample gave the quantity of organic solids plus inorganic solids. To determine the quantity of inorganic solids, the crucibles were further ignited at 55 ºC in a preset furnace for 2 h to burn off the organic particles leaving the inorganic particles. The samples were brought out and allowed to cool then weighed once again. The differences in weight with the earlier heated crucibles with the mixture of solids gave the estimate of inorganic solids present. Conductivity, Temperature, pH, and Total dissolved solids (TDS) determination The measurement of these parameters was carried out using the conductivity meter (Model 150 Hatch) that could also measure temperature, pH, and TDS using 100ml of water sample. Dissolved Oxygen (DO) The iodometric method and its azide modification as described by Prescott et al., (2002) was used. A clean 250 ml BOD bottle, previously sterilized and labeled was lowered at each sampling point such that the influent gently flowed into the bottle until it was filled up, avoiding air bubbles. 1ml of MnSO4 solution was added to each sample followed by 1ml Sodium-iodide-azide solution and the bottle was stoppered. The content was mixed by inverting the bottles for about 5 times. The brown precipitate of hydrated manganese hydroxide Mn(OH)2 was allowed to settle down. 1ml concentrated H2 SO4 was and the stopper was replaced and, the bottle was inverted again until the brown precipitate was completely dissolved leaving a golden yellow solution that was used for titration. 200 ml of each sample was titrated with 0.025 M Na2 S2 O3 solution until a pale straw colour was noticed. A few drops of 1% starch solution were added to the flask and the titration was continued until the blue-black coloration disappeared at the end point living a colorless solution in the flask. The volume of Na2 S2 O3 used for the titration was then recorded which was equal to the concentration of DO. The entire procedure was ensured to complete within about 2 h after MnSO4 solution, sodium-iodide-azide and concentrated H2SO4 were added. The initial DO (D1) was estimated by determining the differences between the final burette reading and the initial burette reading. Biochemical Oxygen Demand (BOD) Each water sample (4.25 ml) was diluted with 475 ml of distilled water to make a 5% solution in a labeled streile 800 ml beaker. 1 ml each of magnesium sulphate (22.5 g in 1000 ml distilled water), calcium chloride (27.5 g in 100 ml distilled water), and ferric chloride (0.25 g in 1000 ml distilled water), were added to the dilution. A blank sample was prepared using only 500 ml distilled water. BOD bottles earlier labeled 1- 4 were filled with dilutions of the sample. To all the samples including the blank were added 1ml of MnSO4 (480 g in 1000ml distilled water), and sodium iodide-solution (135 g in 1000 ml distilled water), and NaN3 (40 ml in 1000 ml distilled water). The mixtures were shaken by inverting the bottles 2-3 times and allowed to stand for 2- 3 min, and then 1 ml of concentrated H2SO4 was added to each of the samples. After the brown manganese hydroxide floc had settled, 200 ml each of the samples were titrated with 0.025 M in an Erlenmeyer flask using 10% starch solution, until a colour change of ‘colourless’ as end point was observed. The volume of the Na2 S2 O3 used was recorded accordingly. Another set of 250 ml BOD bottles were selected and labeled 1-5.Four of the bottles were sampled and the fifth with distilled water served as blank and were incubated at 20 ºC for 5 days. Reagents that were added to the samples to determine initial DO were also added to the incubated samples accordingly. 200 ml of each sample was titrated as during the D1 titration, so that final DO (D2) was estimated by determining the differences between the final burette reading and the initial burette reading. BOD was then calculated using the formular: BOD (mg/l) = D1 – D2 Where; D1=DO of diluted sample for Initial DO Chemical Oxygen Demand (COD) To analyze the samples for COD, 5 ml of 0.1N KmnO4 was added to the 50 ml of sample in a conical flask and heated on a COD water bath for 2 h. It was allowed to cool at room temperature. 5 ml of 10% KI and 10 ml of 4 N H2SO4 were added respectively. The mixture was titrated with 0.1 N Na2 S2 O3 using 1ml of 1% starch solution as indicator and results at end point recorded. The same procedure was repeated for all samples. A blank sample (distilled water), was also ran. The concentration of COD was calculated using the following formular: COD (mg/1) = ( a – b ) × N × 8 Where; a = volume of Na2 S2 O3 used for blank Bacteriological examination Coliforms were detected and enumerated using the multiple tube fermentation technique (Prescott et al., (2002) and the bacteria isolated were presumptively identified using standard biochemical tests Chessbrough, (2004). RESULTS AND DISCUSSION Table 1 shows the physicochemical parameters determined for the water samples collected at each sampling point. The result generally show a high degree of impurities in the raw sewage (in fluent point (IP)) compared to the treated sewage (effluent point (EP)) discharged from the plant, which flowed down stream (down stream point (DSP)) to the point of consumption by the inhabitants. There was higher concentration of filterable solids (FS) (27.4 mg/L) at IP, the point at which raw sewage is channeled into the treatment plant, followed by that of the upper stream point (USP) (20.4 mg/L) and a further lower value of 3.3 mg/L at EP, point at which treated wastewater exits the plant into the water body and a slight increase at down stream point (DSP) (6.3 mg/L), a point further away from plant. This shows a reduction in insoluble contaminants such (e.g. debris) due to the treatment process. The slight increase at DSP may be as a result of fresh supply of debris from upstream as the stream flows down as it mixes along with the treated sewage emanating from the plant at EP (significant correlation at p = 0.05 using correlation matrix). A similar trend was observed for the settleable solids where there was a reduction in concentration from 500 mg/L in the raw sewage (IP) to 200 mg/L. The amount of suspended solids at IP and USP were the same (20 mg/L) respectively) but at EP the amount dropped to 0 mg/L and later increased to 10 mg/L at DSP. The treatment process might have been responsible for the total absence of SS as the treated waste (EP) flows out of the plant, but the increase at DSP may be because of recontamination of the water body by the existing untreated and incoming flowing water upstream and, probably, due to agricultural soils from farming activities (Jamieson et al., 2002). The result also revealed no significant alteration in the amount of total solids (20 – 30 mg/L) and total dissolved solids (3 – 4 mg/L). It may be that the treatment process might not have had any effect on these parameters and the implication of this is that the amount of inorganic solids in the IP (22 mg/L) was relatively the same with that upstream (USP) (22.5 mg/L) but appears to decrease at effluent point (11.3 mg/L) and increase down stream (DSP) (18.7 mg/L). The similar concentration of inorganic solids in the raw sewage and upstream water may be that the water body may be highly polluted as a result of overflowing or rainfall since the study was conducted at the beginning of rainfall. Results of the investigation also revealed a low dissolved oxygen (DO) in the wastewater at IP and EP (4 mg/L respectively), but a remarkable increase at USP (3.1 mg/L) and a drop at DSP (1.7 mg/L). The increase in the amount of DO may be that the treatment process has reduced the amount of impurities present in the sewage. Higher DO is an index of better water quality (Prescott et al., 2002).The Biochemical oxygen demand (BOD) was seen to rise from 60 mg/L at IP to 74 mg/L at EP and 116 mg/L at USP and a further decrease to 68 mg/L as the water flows downstream (DSP) with the pH altering from a slightly acidic pH in the raw sewage at IP (pH 6.79) to almost neutral pH after treatment at EP (pH 7.06) to slightly alkaline pH of 7.15 as the sewage drifts upstream (USP) with the water currents to pH 7.19 as it flows downstream (DSP). The increase in BOD at EP is worrisome because it may be an indication that more impurities were added to influent while in the treatment plant which may be as a result of system failure or unhygienic conditions in the plant. High BOD value indicates higher organic material and hence an increase in microbial activity in the wastewater. It is also known that under appropriate nutrient conditions bacteria, especially Escherichia coli may increase in number (Chessbrough, 2004; Springthorpe, et al., 1997). The amount of total dissolved solids remained constant at IP and USP (4 mg/L respectively) and at EP and DSP (3 mg/L respectively).The conductivity measurements however showed a decrease from 8.6 mg/L at IP (raw sewage) to 7.7 mg/L at EP (treated sewage) and 7.8 mg/L at USP and a further decrease to 5mg/L at DSP with the temperature of the water remaining constant in all the samples (27 ºC). Results of the investigation revealed a fall in the chemical oxygen demand (COD) from 20.8 mg/L in the raw sewage to 12.8 mg/L in the treated sewage at EP, but there was an increase of the COD to 134 mg/L at USP and a drastic reduction in this amount to 40 mg/L as the water flows down stream at DSP. The sharp increase in COD upstream may be as a result of added chemicals from the inflowing water probably runoffs containing fertilizer since it was a farming season or possibly due to addition of chemicals to the water body by fishermen since it was a common practice while fishing in this parts of the country among the fishermen. Table 2 shows the heterotrophic count and the most probable number (MPN) of coliforms isolated. The result revealed an increase in coliforms from 220 cfu/ml in the inflowing waste water (IP) to 520 cfu/ml in the out flowing treated effluent (EP) and a further increase to 735 cfu/ml in the upstream water, but a slight drop in the number of the coliforms (360 cfu/ml) was seen in the down stream sample (DSP). The most probable number (MPN) was observed to be highest at USP (=1800/100 ml) and EP (=1700/100 ml), followed by that of DSP (1000/100 ml) and the least value was obtained at IP (750/100 ml). Ekundayo, (1977) also reported higher MPN values in water samples from Lagos Lagoon collected at the sewage discharge point. High coliform counts and MPN values are an indication of high faecal contamination (Charles, 1989; Chessbrough, 2004). This corroborates with the earlier reported increase in the BOD value as the waste water is channeled into the treatment plant, a confirmation of increased microbial activity, hence an evidence of the problem of poor disposal of human waste. Studies conducted on a control stream in which wastewater was not introduced however revealed lower values of all the parameters studied. The organisms isolated included Escherichi coli, Salmonella typhi, S. paratyphi, Shigella flexnerri Klebsiella spp and Pseudomonas aerugenosa, Streptococcus faecalis and enterobacter aerogenes and the protozoan Giardia lamblia was observed. Common bacteria encountered in water contamination include Escherichia coli, Salmonella typhi, S. paratyphi, Vibrio vulniformis, V. cholerae, V. parahaemolyticus, Shigella flexnerri, Enterobacter aerogenes, Cytrobacter spp., Klebsiella spp., Streptococcus faecalis, Ligionella among others. While, protozoa of world concern include, Giardia, Entamoeba histolytica, Cryptosporidium, Cyclospora and Naegleria fowleri (the cause of primary amebic minigoencephalitis (PAM)) (Singleton, 1999; Prescott, et al., 2002; Jamieson, et al., 2002; Adrian, et al., 2006). The presence of these microorganisms in the water is a further confirmation of the presence of organic matter, which provides nutrients for their growth. Escherichia coli, Salmonella typhi, S. paratyphi and Shigella flexnerri are associated with water borne diseases and reports from available health outposts in the areas in which this study was carried out revealed typhoid fever, dysentery, cholera and hepatitis to be the most prevalent. CONCLUSION It is evident from the study that the treatment plant is contributing to the pollution of the Gudu stream thus posing dangers to the health of the consumers. Results of this study revealed a serious departure from the World Health Organization for drinking water which states no sample counts should contain more than 10 coliform organisms per 100 ml. Gudu stream water is therefore unfit for human consumption. There is therefore the need for urgent steps to be taken for proper management and sanitation of the wastewater treatment plant because input of sewage or other organic rich wastewaters into the steam results in increase in organotropic bacteria, algae and cyanobacteria which not only bring about health implications but further complications for aquatic life. Sewage management regulations and constant monitoring of sewage treatment plants through the establishment of an authentic and reliable data base in order to maintain efficiency and high standard of sanitation and impact assessment of the process must be deliberately pursued. The choice and design of affordable and appropriate equipment and technology and adequate training of manpower for sewage treatment will further simplify the management requirements particularly for developing countries. Privatization and/or commercialization of sewage management and the promotion of polluter-pay-principle and the education of inhabitants on simple hygiene and the need to avoid further contamination of water bodies by the use of fish hooks instead of chemicals during fishing should be vigorously embarked upon. Enlightened individuals, non-governmental organizations and private companies must also play a role in this area in order to curb the problem of water pollution. REFERENCES
Copyright 2007 - Journal of Applied Sciences & Environmental Management The following images related to this document are available:Photo images[ja07091t2.jpg] [ja07091t1.jpg] |
| |||||||||
