 |
| About Bioline | All Journals | Testimonials | Membership | News |
|
||||||
|
||||||
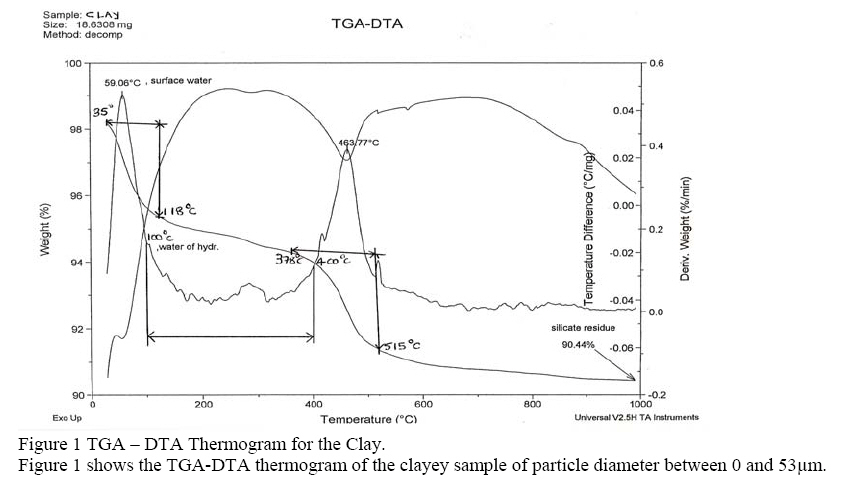
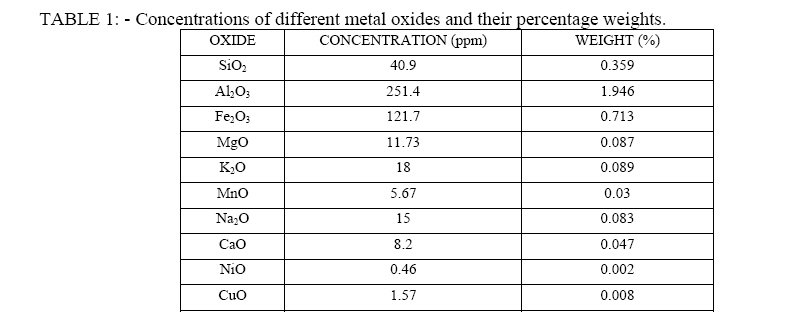
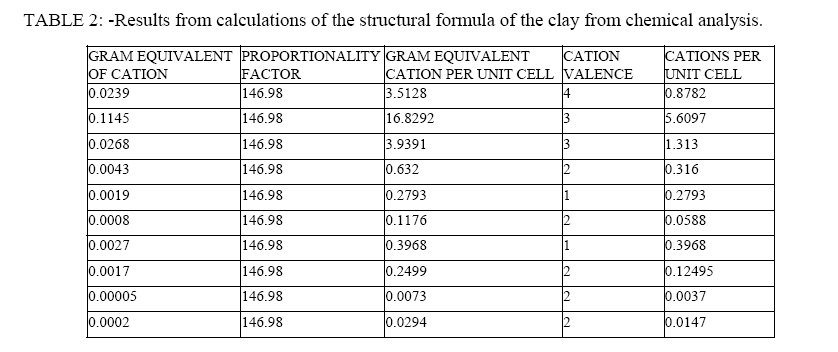
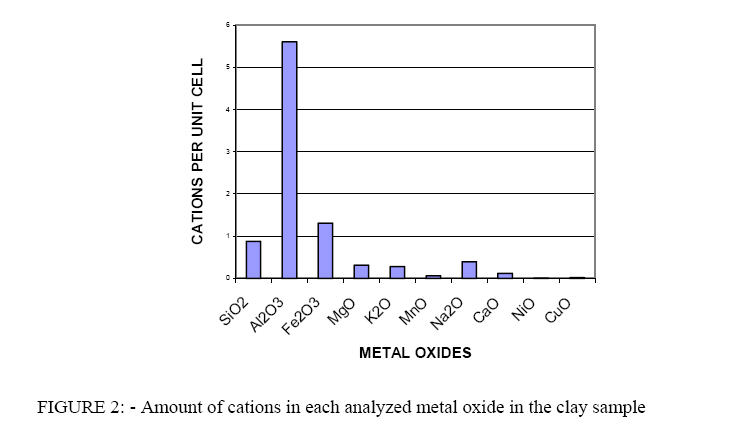
Journal of Applied Sciences and Environmental Management, Vol. 11, No. 4, 2007, pp. 77-80 Chemical and thermal characterization of a clayey material found near Gaborone Dam BONTLE MAIFALA, AND NADIYE-TABBIRUKA M.S. * Department of chemistry, University of Botswana, Private bag 00704, Gaborone nadiyemst@yahoo.com * Corresponding author: NADIYE-TABBIRUKA M.S. Code Number: ja07099 ABSTRACT: Mineralogical studies were carried out on clayey material found near the water dam in Gaborone city, in Botswana, in order to deduce its chemical composition. Samples of the material were subjected to chemical elemental, thermal and cation exchange capacity analyses. Traces of Kaolinite were found together with quartz and microcline. The chemical formula was found to be FeSiAl6 O10 (OH)6 . Large mass of clayey deposits near Gaborone dam have, for decades, been mined and used for pottery and to manufacture building bricks. Like most clayey materials, the current sample is pretty complex, probably consisting of several minerals. Clay materials may be differentiated by using their cation exchange capacity, CEC, adsorbed exchangeable ions at the surface (Chi Ma and Richard A. Eggleton, 1999). The most common in order of relative abundance are Ca+, Mg+, H+, K+, NH4+ and Na+ (Grim R. E., 1968). They are held on external surfaces of the mineral (Chi Ma and Richard A. Eggleton, 1999). Cation exchange capacity results from the presence of loosely bound cations of alkali and alkaline earths elements in the clay (Konstantinos P. Kitsopoulos (1999)) and are easily exchanged when clays are in contact with solution of “saturating” or indexing” ions. This reaction is given by; M1(C) + M2(S) → M1(S) + M2(C), where M1 is the cation present in the clay C, and M2 is the ion in solution S. Changes in chemical or physical properties of material as a function of temperature in a controlled atmosphere may be determined by thermal analysis, (Nadiye-Tabbiruka and Dandy 1975) which covers changes in energy, weight, crystal dimension and evolved volatiles. This enables clays to be classified according to their heating patterns. For this study, only differential thermal analysis (DTA, Mackenzie, R.C; (1970).) and thermogravimetric analysis (TGA) were used. Classification of clay minerals depended heavily on chemical data and on subdivision according to composition (Bain D.C et al) which ensures the determination of elements making up the clay and their distribution ratios (Gaspe, A. et al;(1994), Velde, B; 1992, Briggs, D.J; (1972)). In this study, atomic absorption spectrometry (AAS) and flame emission spectrometry (FES) were used as the techniques for deducing the chemical composition of the sample. In this study samples from Gaborone dam clay deposits are subjected to chemical, thermal and cation exchange capacity analyses to deduce the clay’s structure and composition with the hope that without or with surface modifications (Nadiye-Tabbiruka M S 2004) possible new applicatiosuch as chromatography, catalysis and pollutant removal from industrial waste water and air may emerge. MATERIALS AND METHODS Clay deposits around the dam were visited several times to sample at different times of the year and from various places. Lumps of the clay were collected from different location and different depths around the dam. To make laboratory-sized sample, the lumps were mixed and crushed together so that a representative sample can be used for analysis. The crashed clay was mixed with de-ionized double distilled water and stirred with a motorized stirrer at 1000 revolutions per minute over night to concentrate the clay particles. The suspension was left to settle for twenty four hours and the top layer was decanted, filtered and dried in an oven at about 373K for a day. The CEC was determined using centrifuging plus titration method. Magnesium sulphate was used as a solution of indexing ions in this study. The resultant solution was titrated with ethylene di-amine tetra-acetate (EDTA), so that CEC could be calculated. Thermal analysis of the sample was done by using Netsch DTA/TGA instrument (with Pt and Pt-Rh thermocouples) available in the chemistry Department at the University of Botswana. Calcined Al2O3 served as the inert standard. For AAS, measurements were made using spectr. AA-10 spectrometer, manufactured by Varian spectra. Air –acetylene flame was used for the analysis of each metal except for Si, Ca and Al, which required nitrous oxide-acetylene flame instead, with a flame temperature of 2250°C. The machine automatically controlled the ratio of the fuel and oxidant gas, and pure water used as the blank. For the analysis of Na and K (FES), a Corning flame photometer 410 was used. The oxidant (air) and fuel (propane) were allowed to flow through the reaction chamber a few seconds prior to ignition, and calibration was done using the highest concentrated solution of the relevant cation (100ppm) and the lowest one (0ppm). RESULTS AND ANALYSIS The method of Bascomb (1964) was used to obtain cation exchange capacity. The volume of EDTA used to titrate magnesium sulphate was obtained averaging titres from several close runs. The average cation exchange capacity for the clay sample was found to be = 19.24meq / 100 From the thermo gravimetrical curve, the sample exhibits a decomposition loss of 9.56% of weight. Thus, 90.44% was left undecomposed at 1000°C. The curve shows a peak between 35-118°C and between 378-515°C normally associated with loss of surface water and dehydroxylation of the clay material respectively.The differential thermal analysis curve shows two sharp exothermic peaks at 59.06°C and 463.77°C corresponding to the loss of surface water and to dehydroxylation of the clayey material. The small endothermic peaks between 100°C and 400°C are due to loss of water of hydration. The elements were extracted and analysed using standard known methods (Blakemore 1987). The analyzed elements are reported in the form of mass percentages of metal oxides as given in table 1. The results in table 1 are used for the calculation of the structural formula. The distribution of the ions is given in table 2 and figure 2 represents the cation distribution for each of the oxides per unit cell. From table 2 and the chart in figure 2 with anions obtained in earlier work (Nadiye-Tabbiruka, M.S., Ekosse, G., Maifala, B. (2005), Lanson Bruno; (1997).) the resultant structural formula is:-Si0.89Al5.51Fe1.31Mg0.32K0.28Mn0.06Na0.40Ca0.12Ni0.004Cu0.01O10(OH)6After correction to the nearest whole numbers the formula becomes: - Si1Al6Fe1O10(OH)6 DISCUSSION The data obtained from chemical analysis correlates with the mineralogical composition of kaolinite. Thus, the values of concentration for the contents of silica and alumina obtained agree with those of kaolinite and quartz with traces of microcline. High iron content is probably due to the presence of impurities in the sample since the sampling was done in a residential area near Gaborone dam, where there are many activities some of which are pollution-associated. Also the weight percentage of removed incorporated water (in the sample) was found to be 2.4%. Therefore, the percentage weights of the metal oxides were calculated from 2.4403g of the clay. The total percentage weight of the oxides fell outside the expected range of 99.01 to 100.05% probably because of the lost water. The resultant structural formula for the clay sample was deduced to be FeAl6SiO10(OH)6 and it account for crude kaolinite containing quartz and microcline. And according to Ekosse G (2001), pure kaolinite has a theoretical chemical composition of 46.55 wt.% SiO2, 39.49 wt.% Al2O3 and 13.96 wt.% H2O, and in nature it is hardly found in pure form. It is always associated with two types of impurities resulting from accessory minerals that adhere to the surface of kaolinite, and those resulting from isomorphous substitution of an element into the kaolinite structure. From the TGA-DTA thermogram, the TGA curve showed that the sample decomposed from 100% to 90.44%, which corresponds to a loss of weight ranging from 18.6303mg to 16.8497mg, hence losing about 9.66% of the total weight. This is ideal for kaolinite because its loss in weight from the literature is 14% (Newman; 1987). The difference in the experimental loss in weight compared to that in the literature may be due to the fact that the analyzed clay is not solely kaolinite but contains microcline and quartz as revealed by chemical analysis. From the DTA curve, two sharp exothermic peaks were observed at 59.06°C and 463.77°C corresponding to loss of physisorbed water and dehydroxylation of kaolinite respectively. This is whereby the structural OH is lost as water, as kaolinite is transformed to metakaolinite expressed as below:- Al2Si2O5(OH) Al2Si2O7 + 2H2O Dehydroxylation of kaolinite occurs in normal atmospheres at temperatures above 400°C (Newman: 1987). The experimental dehydroxylation of kaolinite occurred at 463.77°C, which is in reasonable agreement with the literature. Kaolinite is known to have water molecule intercalated between the layers. Thus, it contains structural water and in the DTA curve, loss of this water was observed between 100°C and 400°C and resulted in small endothermic peaks within that temperature range. The calculated cation exchange capacity of the clay was found to be 19.24meq / 100g. This is a little higher than the literature value for kaolinite, which ranges from 3 to 15meq / 100g. This could have been caused by the impurities in the clay as well as the clay components, quartz and microcline as other analysis techniques have deduced. Acknowledgements: The authors wish to acknowledge all those who made it possible for this research to be performed. This includes George Ekosse of the University of the North in South Africa for providing the clayey sample, Dr W Ddamba of the department of Chemistry, University of Botswana, for the help with the thermo gravimetric work, the technical staff in the department of Environmental Science, University of Botswana for their assistance with the work on cation exchange capacity. REFERENCES
Copyright 2007 - Journal of Applied Sciences & Environmental Management The following images related to this document are available:Photo images[ja07099f2.jpg] [ja07099f1.jpg] [ja07099t2.jpg] [ja07099t1.jpg] |
| |||||||||
