 |
| About Bioline | All Journals | Testimonials | Membership | News |
|
||||||
|
||||||
Journal of Applied Sciences and Environmental Management, Vol. 11, No. 4, 2007, pp. 95-100 Kinetic and thermodynamic studies of glucose oxidase catalysed oxidation reaction of glucose ODEBUNMI, E O; *OWALUDE, S O Chemistry Department, University of Ilorin, P. M. B. 1515, Ilorin, Nigeria.
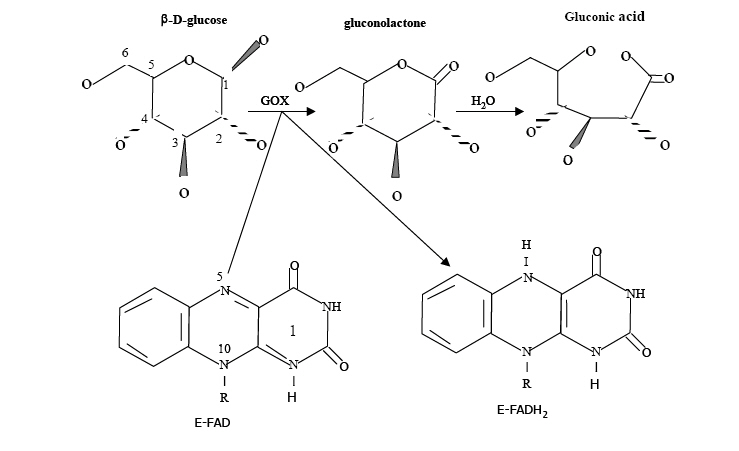
Telephone: 08066105199 * Corresponding author: Owalude, S O Code Number: ja07103 ABSTRACT : The kinetics of oxidation of D-glucose catalysed by the enzyme glucose oxidase has been studied over a wide range of experimental conditions. The reaction velocities increased with increase in the concentrations of the glucose oxidase and glucose, as well as increase in temperature and ionic strength of the solution. The reaction velocity initially increased with increase in pH, reaching a maximum at pH 6.5 and then decreased with further increase in pH. The reaction exhibited saturation kinetics and experimental data were analysed using the Michaelis-Menten equation. Arrhenius activation energy and thermodynamic activation parameters were measured and are reported. The large negative value of entropy of activation ?S¹, -148.8JK-1 mol-1 , and positive value of the enthalpy of activation ?H¹, 26.3kJmol-1, give further support to the proposed mechanism. The results are interpreted in terms of a mechanism involving both an oxidative half reaction and a reductive half reaction. Glucose oxidase is a flavo protein consisting of 2 moles of flavin adenine dinucleotide (FAD) per mole enzyme and catalyses the oxidation of b-D-glucose by molecular oxygen to D-glucose-1, 5-lactone and hydrogen peroxide (Kalisz, et al 1997). It has been isolated from various sources, however, only the enzyme from Aspergillus niger and Penicillium amagasakiense has been studied in detail (Schomburg et al 2000, Gibson and Bright 1967). Glucose oxidase is used in the food industry for the removal of glucose from powdered eggs, for gluconic acid production, and as a source of hydrogen peroxide in food preservation (Witt et al, 1998). Glucose oxidase is also used extensively for the quantitative determination of D-glucose in samples such as blood, food and fermentation products (Wilson and Turner, 1992). The overall oxidation reaction catalysed by glucose oxidase can be represented as follows:
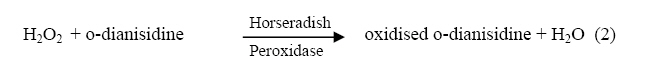
The hydrogen peroxide, H2O2, which is generated as a by-product in the above equation is a good oxidizing agent and in the presence of a reducing agent such as o-dianisidine, it is catalytically reduced to water by the enzyme Horseradish peroxidase.
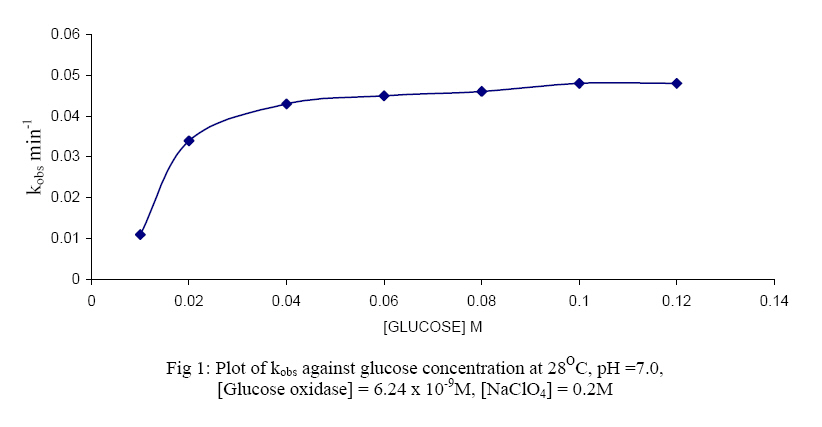
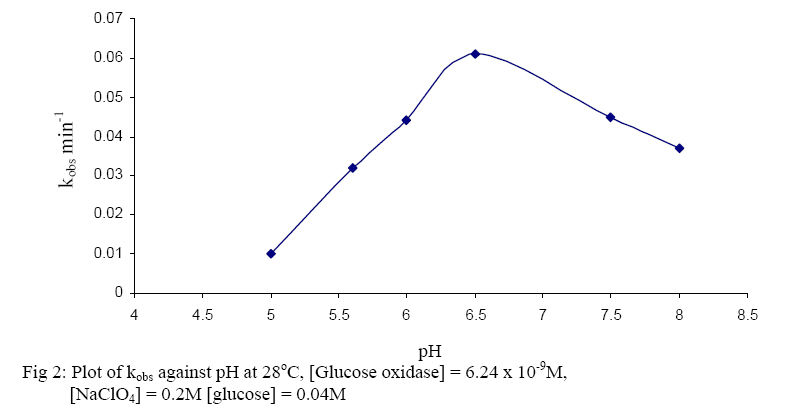
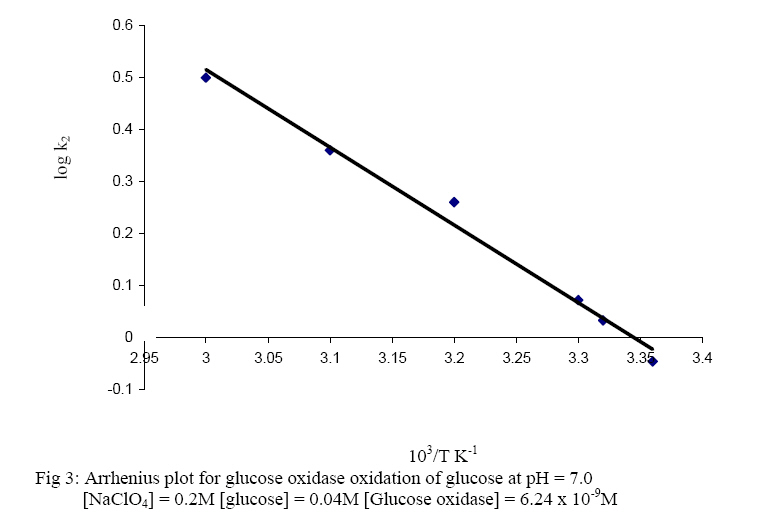
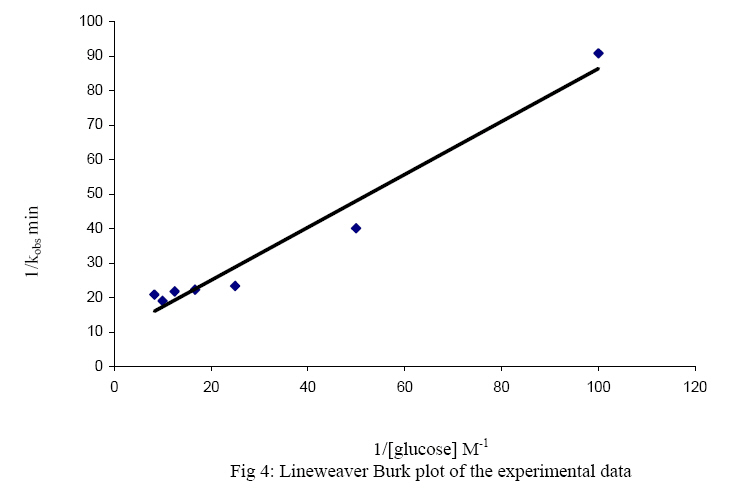
The oxidised form of o-dianisidine absorbs strongly at 430nm, thus, by monitoring the absorbance at 430nm, the kinetics of glucose oxidase catalysed oxidation of D-glucose can be readily studied. (Dulley and Holmes, 1975). The kinetics and mechanism of glucose oxidase reactions have been studied from a number of steady – state and transient state kinetic analysis, (Weibel and Bright, 1971; Madson and Feather, 1983; Ryabow and Firsova, 1997), and in our laboratory we have been investigating the kinetics and mechanism of oxidation of sugars by a variety of oxidising agents (Owalude, 2004; Odebunmi and Owalude, 2005; Odebunmi et al 2006). We now present the thermodynamic activation parameters in support of the earlier proposed glucose oxidase mechanism. MATERIALS AND METHODS Materials: All the chemicals were of analytical grade and were used without further purification. All the solutions were prepared using doubly distilled water. Kinetic Measurements: The kinetic procedure was adapted from that used by Dulley and Holmes, 1975. The method involved the coupling of the hydrogen peroxide produced from the oxidase reaction to the reduction of a chromogen, o-dianisidine dihydrochloride, by Horseradish peroxidase. The assays were carried out at 28° C and the reaction contained the followings in a final volume of 10ml: glucose (0.01M, pH=7.0); Horseradish peroxidase (4mg/ml, pH=7.0), glucose oxidase (0.025mg/ml, pH=7.0); o-dianisidine (0.156g/mg, pH=7.0). The reaction was initiated by the addition of the enzyme to the glucose solution and the progress of the reaction was followed by measuring at 1 minute interval, the increase in absorbance at 430nm with a Camspel M105 spectrophotometer. The average initial rates, kobs, over three independent measurements were determined by linear regression from the slope of the concentration versus time plots. The rate constants were averages of at least three measurements. Effect of reactants concentration: The dependence of the reaction rate on glucose concentration was measured by keeping constant the concentration of glucose oxidase, pH at 7.0, temperature at 28° C and the ionic strength at 0.2M. The kinetic procedure as described above was then followed and the pseudo-first-order rate constants, kobs, were estimated from the slopes of the log(absorbance) versus time plots. In another set of experiments, kinetic procedure as described above was followed keeping constant the concentration of the glucose, the pH at 7.0, ionic strength at 0.2M and the temperature at 28oC while varying the glucose oxidase concentration varied between 3.12 x 10⁻⁹M and 15.6 x 10⁻⁹M. First-order rate constants were estimated from the plots of log(absorbance) versus time plots. Effect of pH: The kinetic measurements were also carried out at different pH values from 5.0 to 8.0 using the NaOH and NaHPO4 solutions mixed in appropriate volume ratios as described in the literature(Weast, 1977) while maintaining constant the concentrations of the glucose, glucose oxidase, ionic strength and temperature. The average initial rates, kobs, were then estimated at different pH values from the slopes of the log(absorbance) versus time plots. Effect of ionic strength: The ionic strength of the reaction medium was always kept constant using sodium perchlorate of known strength. The ionic strength effect on the reaction rates was then carried out at different initial concentrations of sodium perchlorate while keeping constant the concentrations of the glucose at 0.04M, glucose oxidase at 6.24 x 10⁻⁹M, pH at 7.0 and temperature at 28° C. As above, the pseudo-first-order rate constants were estimated from the slopes of the plots of log(absorbance) versus time. Effect of temperature: The oxidation reactions were carried out at different temperatures between 25° C and 60° C while maintaining constant the glucose oxidase concentration, glucose concentration, pH and ionic strength at 0.2M.The pseudo-first-order rate constants at each temperature were then estimated from the slopes of the plots of log(absorbance) versus time. RESULTS AND DISCUSSION: Effect of reactant concentration: The reaction velocities, kobs, were measured at different initial concentrations of glucose oxidase but at constant glucose concentration, constant ionic strength, and temperature at 28° C and pH at 7.0. The results show that the rate increased as the concentration of the enzyme increased. In another set of experiments, the reaction velocities were determined at different initial concentrations of glucose while maintaining constant glucose oxidase concentration and temperature at 28° C. The reaction velocities increased as the glucose concentration increased. The plot of reaction velocities (kobs) against the glucose concentration in fig. 1 shows two regions of concentration dependence of reaction velocity. In the low concentration region, kobs increased almost linearly with concentration and a plot of logkobs versus log[glucose] is linear with a slope of 1,(Owalude, 2004) showing that the reaction rate is first order within this range. However in the high glucose concentration region, the rate of increase in kobs decreased progressively with concentration and it eventually levelled off to a constant value that is independent of further increase in glucose concentration. The reaction rate tends towards zeroth order in glucose in this high concentration range, an indication that the reaction obeyed saturation kinetics (Bright and Porter, 1975). Effect of pH: The reaction velocities, kobs , were determined at different pH values but at constant glucose concentration, glucose oxidase concentration, ionic strength and temperature at 28° C. The results show that the reaction rate increased with increase in pH of the medium but as the pH becomes large the rates started to decrease and showed a maximum at pH = 6.5 (fig 2.). A kinetic study at different pH values has established that as the pH of the reaction medium becomes large there is always a decrease in catalytic activity of glucose oxidase (Weibel and Bright, 1971). This has been attributed to the protonation of the active site histidine in the FAD molecule, i.e. the protonated histidine results in a reduction of the kinetic barrier for the electron transfer to the oxygen. Thus at low pH glucose oxidase provides a rigid and polar environment of low polarizability which reduces the intrinsic barrier of the charge transfer to oxygen (Gibson and Bright, 1967). Effect of ionic strength: The reaction rates were also measured at different initial concentrations of sodium perchlorate while maintaining constant the concentrations of glucose oxidase and glucose, pH at 7.0 and temperature at 28° C. The results show that the addition of sodium perchlorate has a positive effect on the reaction rate. This may be due to changes in the conformational state of the protein which tends to make the oxygen to be more accessible. Effect of temperature: The glucose oxidase catalysed oxidation reaction was studied at different temperatures from 25oC to 60oC. The reaction velocities increased with increase in temperature and the second-order rate constants, k2 , were estimated at different temperatures. The plots of log k2 against 1/T was linear(fig. 3) and the Arrhenius activation energy, Ea, calculated from the slope of the plot is 28.9 kJmol-1 .The other thermodynamic activation parameters were calculated as described elsewhere(Owalude, 2004) and the results are DH1 = 26.31 kJmol-1, DS1 = -148.77 Jmol-1 K-1and DG1 = -20.26 kJmol-1 Mechanism of the reaction: A general mechanism for the oxidation of glucose catalysed by glucose oxidase has been proposed to proceed in two half reactions, the reductive and the oxidative half reactions (Wolfahrt et al, 1999). In the reductive half reaction, two electrons and two protons are transferred from the glucose to the flavin. This can occur in two ways; the first involved a nucleophilic addition by the 1-OH group of the glucose to the C-4a position of FAD. This step is followed by proton abstraction from C-1 of the glucose and would be assisted by general base catalysis (Gibson et al 1964). The second is a hydride transfer from glucose C-1 to flavin N-5. This fact is supported by the negative value of entropy of activation DS¹ and the positive value of enthalpy of activation, DH¹, reported in our experimental data. This is because hydride transfer reactions are generally characterised by positive values of DH¹ and large negative values of DS¹ (Scott et al, 1992; Ewa et al, 2003). Thus there is a transfer of two electrons and two protons from the glucose to the FAD and the active site of the enzyme. In the oxidative half reaction, these two protons and two electrons are transferred from the enzyme to molecular oxygen producing hydrogen peroxide, H2O2, in the process. The rate equation: The reactions as reported elsewhere (Owalude, 2004) exhibited saturation kinetics and the data satisfied the following Michaelis-Menten equation originally developed for enzyme kinetics (Su and Klinman, 1999). Eox + glucose → Eox - glucose Ered + gluconolactone (3) Ered + O2 Eox + H2O2 (4) Where Eox is the resting enzyme with FAD in the oxidised form and Ered is the enzyme with FAD in the reduced form resulting from the reductive half reaction. The Michaelis- Menten constant (Km= 0.117M) as well as the maximum velocity (Ömax = 0.143min-1) were determined from the double reciprocal Lineweaver- Burk plot of the experimental data (Lineweaver and Burk, 1934), (figure 4 ) REFERENCES
Copyright 2007 - Journal of Applied Sciences & Environmental Management The following images related to this document are available:Photo images[ja07103f4.jpg] [ja07103f1.jpg] [ja07103f2.jpg] [ja07103f3.jpg] |
| |||||||||
