 |
| About Bioline | All Journals | Testimonials | Membership | News |
|
||||||
|
||||||
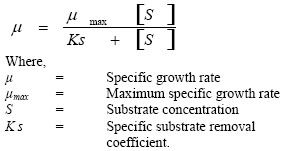
An investigation of oxygen limitation in microcosm models in the bioremediation of a typical Niger Delta soil ecosystem impacted with crude oil Gideon O. Abu*; Nancy D. Atu. Department of Microbiology, University of Port Harcourt, PMB 5323. Port Harcourt. Nigeria. Code Number: ja08002 ABSTRACT Oxygen was investigated as a limiting factor in the bioremediation of a typical Niger delta soil impacted with crude oil under laboratory simulation conditions. Temperature, pH, moisture content and nutrients (N.P.K. 15: 15: 15) were maintained at optimal levels. Surfactant (S400) was added to aid emulsification of oil. Addition of hydrogen peroxide every four days and tilling were effected in some setups for enhanced oxygen supply. Hydrogen pyrogallol was added to create an anoxic environment in one set-up (experiment 4). Neat soil was used in the control experiment to avoid exogenous carbon sources. The bioremediation process was monitored for 50 days by periodic (10 days) measurements of oil and grease (O&G) and total organic carbon (TOC) levels. Enumeration of total heterotrophic bacteria, total hydrocarbon-utilizing bacteria, sulphate reducing bacteria (SRB) and nitrate utilising bacteria was done. The highest percentage loss in oil and grease level (>80%) and total organic carbon level (>95%) were recorded in the set-up treated with hydrogen peroxide and tilling. This set-up also recorded the highest titre of hydrocarbon-utilizing bacteria. Sulphate reducing bacteria and nitrate utilising bacteria were enumerated in the anoxic experiment 4. Experiment 3 (treated only with crude oil) recorded 57.7% hydrocarbon loss. This was attributed to remediation by natural attenuation processes. Aerobic bioremediation was estimated to be about 30 percentage points above anaerobic bioremediation. Aerobic degradation was found to be at least 30% more effective than anaerobic degradation. A combination of all possible aeration techniques is recommended for enhanced bioremediation. @ JASEM Population and industrial growth have augmented dioxide. It is a controlled treatment technology the release of pollutants into the environment. where environment paraments are optimised to Every industrial activity entails a certain degree of achieve the fastest and most complete residual risk to man, nature and the environment. biodegradation of petroleum hydrocarbons present The risk of environmental pollution in the oil and in contaminated soils. The bacteria involved are gas sector cannot be completely eliminated. The called hydrocarbon oxidisers. The breakdown and most prominent of such risks is that of conversion process is known as mineralization contamination of soil and groundwater. There when there is the complete breakdown of organic exists a pressing demand for the introduction of materials to inorganic products and often occurs environmentally safe technologies for effective through the combined activities of microbial clean-up. Microbiology and biotechnology have consortia rather than through a single played important roles in the development of microorganism. alternative technologies to produce less waste and pollutants (Leisinger, 1983). One of such technologies is bioremediation. We define bioremediation as a technology based on the science of biodegradation. Bioremediation is a relatively recent addition to the battery of clean up strategies currently employed to restore and rehabilitate contaminated sites. Many techniques of dispersal, collection, removal, landfill disposal and incineration simply dilute or sequester the contaminants or transfer them to another environment (Bouwer, 1992). By contrast, however, bioremediation may be viewed as a unique, more effective and environmentally benign clean up technology since it results in partial or complete bioconversion of organic pollutants to microbial biomass and stable, non-toxic end– products (Baker and Herson, 1994). Thus, we can say bioremediation is concerned with the biological restoration of historically contaminated sites and with the clean up of areas contaminated in more recent times either accidentally or incidentally as a result of production, storage, transport and use of organic and inorganic chemicals (Hamer, 1993). Chianelli et al., (1991) defined bioremediation as a natural process in which bacteria consume petroleum and break it down to biomass and carbon dioxide. It is a controlled treatment technology where environment paraments are optimised to achieve the fastest and most complete biodegradation of petroleum hydrocarbons present in contaminated soils. The bacteria involved are called hydrocarbon oxidisers. The breakdown and conversion process is known as mineralization when there is the complete breakdown of organic materials to inorganic products and often occurs through the combined activities of microbial consortia rather than through a single microorganism. According to the standard guide for consideration of bioremediation as an oil spill response method on land (issued under the fixed designation F 1693, USEPA, 1991), bioremediation technologies attempt to accelerate the natural rate of biodegradation. Bioremediation performance depends on the efficiency of the indigenous petroleum hydrocarbon degrading microorganisms or bioaugmentation agents. General background information concerning approaches to bioremediation is presented in this guide. Some of such approaches include biostimulation which is the addition of nutrients, oxygen, heat, water or the combination thereof to stimulate indigenous microorganisms and bioaugmentation which is the addition of oil – degrading microorganisms which may be used in combination with biostimulation. The term “Remediation” has been used to describe a wide variety of approaches to the clean up of petrochemical spills. It is recommended that the term be used to separate those technologies with thrust to enhance biological degradation from those using chemical, thermal or phase change for remediation. Bioremediation can be used in a stand-alone mode or can be combined with other technological approaches to achieve remediation of contaminated sites. Bioremediation is a technology that results in the terminal destruction of hazardous materials to harmless end- products. Though not without its disadvantages, experience from various clean up projects has shown this technology to be the most economical and environmental friendly method for remediating several major environmental problems (Chianelli et al., 1991, Abu and Ogiji, 1996, Water Quality international 1997). Like any other technological approach, bioremediation has its own limiting factors. This is because all living organisms require a source of energy to develop and sustain their population. In biological treatments, the contaminant is one of the sources of food and energy for the microbes. Their activity is dependent on availability of water, oxygen, nutrients and a controlled temperature and pH. Oxygen levels must be high enough for the breakdown of hydrocarbons. Anaerobic bacteria are available when oxygen levels are low. Bioremediation is a rate limiting process. It is driven by nutrient limitation, and explained by Monod kinetics thus: Where, µ = Specific growth rate µmax = Maximum specific growth rate S = Substrate concentration K s = Specific substrate removal coefficient. Within saturated environments, oxygen transport is considered to be a rate-limiting step in aerobic bioremediation of contaminated lands when adequate nutrients are present. At the Travers city, Michigan, a site contaminated with jet fuel, an increase in the oxygen concentration in water through addition of hydrogen peroxide was observed to positively affect the rate of biodegradation of the jet fuel components benzene, xylene and toluene (U.S EPA, 1991). There are scarcely any reports detailing the effects of oxygen and oxygen carriers on bioremediation in a typical Niger delta ecosystem. This study was carried out to provide such information which can also be used in evaluation of the effect of natural attenuation processes in the Niger delta. MATERIALS AND METHODS Collection and Characterization of Soil Sample A soil sample was collected from a beach area interspersed with shrubs and grass vegetation in the Port Harcourt environment. Sieves of different sizes were used to characterize the soil. Experimental Design About 30 kg of soil was weighed out into each of seven black polythene bags (dimension: 46 by 46cm and 30cm depth, volume 49877.14cm 3). The soil was first mixed thoroughly with crude oil before packaging into each bag. Treatment Options The following treatment options were effected: i. Soil (30 kg) + Hydrocarbon (2000 ppm) + Surfactant + NPK + H2O2 + Tilling
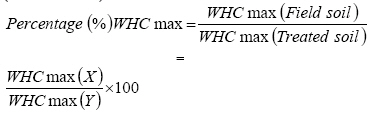
+ Surfactant Optimization of Environmental Conditions Prevailing conditions including pH, soil moisture content and nutrient availability were optimised using the procedure outlined in the General Guidelines for Bioremedition of Petroleum Hydrocarbon contaminated Soils (Huesemann, 1993). The soil pH A pH probe (Ionalyzer, model 407A, Orion research, USA) was calibrated and used to measure pH of each experiment every 10 days. Forty grams (40g) of soil collected from each experiment were weighed out in duplicates after drying in an oven (GallenKamp BS, 250, England). A slurry was prepared by addition of 40 ml distilled water and allowed to equilibrate for 15 minutes. The pH was then measured. This was done at day 0, 10, 20, 30, 40 and 50. Soil moisture content Soil in the control experiment (field soil X) was first irrigated to prevent dry-out. About 200g was removed and placed in a funnel lined with filter paper and covered with foil to prevent evaporation. It was left to stand overnight. An aliquot was weighed out the following day (M1) and placed in the oven (GallenKamp BS, 250, England) at 106 ºC for 24 h. After cooling, the new weight (M2) was taken. The maximum water holding capacity was determined as follows:
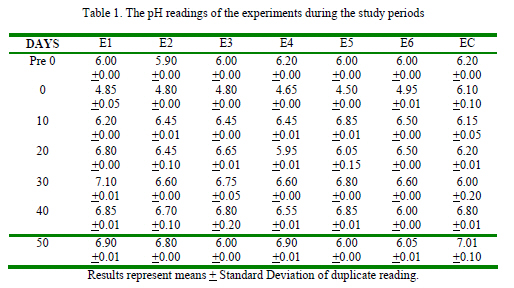
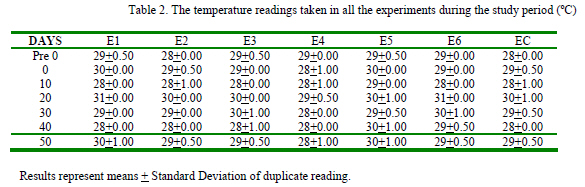
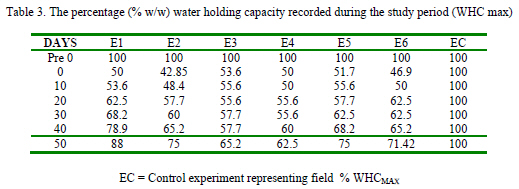
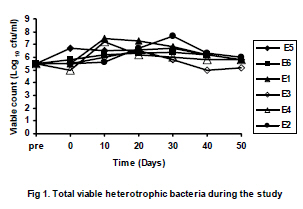
Next, about two hundred grams (200g) soil sample experiments and the same procedure followed as above. Adjustment of nutrients About 500g of NPK (15:15:15) was added to the experiments biweekly. This translates to 0.15g nitrogen and 0.066g phosphorus respectively per gram of soil (0.15 weight percent nitrogen and 0.066 weight percent phosphorus per gram N.P.K.) Soil Aeration, Oxygenation and Anoxia Tilling using a hand trowel was done every 4 days in Experiments 1 and 5. This was to increase aeration in the set up. Hydrogen peroxide (H2O2, 50% W/V) was first diluted 100 ml in 1 litre distilled water (0.05% W/V). About 200 ml of this solution was added to experiments 1 and 2 every 4 days (H2O2 has ½ life of 96 h). This translates into 188,000 mg of oxygen per 49.9m3 of soil. Hydrogen pyrogallol was added to create anoxic environment in Experiment 4. The suspension was prepared by weighing out 40g of the pyrogallol powder into 500 ml distilled water after which 200 ml was applied to the set up . Monitoring and Site Closure Substrate (hydrocarbon) removal was monitored by microbiological and physico-chemical analyses. Site was closed after 50 days of treatment. Soil sampling Each treatment option was divided into four. Composite sub-samples were made from the quadrants using core samplers. The sub-samples were labelled and transported and processed within six hours in the laboratory. Sampling was done on day 0, 10, 20, 30, 40 and 50. Microbiological Analysis of Soil in the Experimental Set-ups Enumeration of total heterotrophic bacteria The total heterotrophic bacterial count in each experiment was performed with Nutrient agar. The medium was prepared according to the manufacturer’s specifications. Aliquots (0.1ml) of serially diluted soil were plated out in duplicates on sterile nutrient agar plates using the spread plate procedure. Plates were inverted and incubated at 37ºC for 48 h after which the colonies counted were used to calculate the titre (colony forming units per gram, cfu/g) of the soil in the respective experimental set-up. Enumeration of total hydrocarbon utilizing bacteria The vapour – phase transfer method was adopted. Following serial dilutions of the soil in the respective experiments aliquots (0.1ml) of the dilutions were plated out in duplicates on sterile mineral salt (Mills et al., 1978) agar. Sterile Whatman No. 1 filter paper saturated with crude oil was placed on the inside covers of each Petri dishes. The Petri dishes were incubated with the agar side up. The filter paper supplied the microorganisms with the hydrocarbons by vapour – phase transfer to the inoculum. The plates were placed in the incubator (GallenKamp Duostat Incubator size 2, England) at 37ºC for 7days after which colonies were counted to determine the titre (viable counts per unit) of the soil. Enumeration of nitrate utilizing bacteria The Winogradsky medium was used. It was constituted as follows: NaNO2 1g, K2HPO4 0.5g, MgSO4 7H2O 0.3g, NaCl 0.5g, FeSO4 7H2O 0.49g, Agar 1g, Distilled water 1 litre. All glasswares were treated with dichromate solution and flushed with distilled water before use. The pour plate technique was used. The plates were placed in the incubator (GallenKamp Duostat Incubator size 2, England) at 27 ºC for 5 days after which colonies were counted to determine the titre (viable counts per unit) of the soil. Enumeration of Sulphate utilising bacteria The Waksman medium 1 was used. It comprised the following (NH4) 2 SO4 0.2g, MgSO4 7H2 O 0.5g, K2HPO4 0.3g, CaCl2 PO2 0.25g, Sulphur (powder) 10g, Agar 15g, Distilled water 1 litre. The pour plate technique was used. After inoculating and setting, the plates were transferred into an anaerobic jar (Oxoid, Basingstoke, Hampshire, England). A Gaspak (BBL Microbiology Systems, Becton Dickinson and Co., Cockeysville, MD 21030) was opened, a few drops of water were added into it and it placed in the jar. The jar was incubated at room temperature for 10 days. Determination of Physico-chemical Parameters of the Soil in the Experimental Set-ups Determination of oil and grease content. The method descried by Odu, (1977) was used. Cold extraction of the crude oil was carried out using chloroform as solvent. The samples were dried at room temperature (25ºC-29ºC) to constant weight. Ten (10) grams of each soil sample were placed in pre-weighed sterile conical flasks. Sixty (60ml) of chloroform was added, shaken and the residual crude oil extracted into the chloroform phase using a separatory funnel. This was done in duplicates. Each extract was filtered through cotton wool and left to volatilise. The flasks were weighed again to constant weight and the oil and grease content determined through weight difference. Determination of total organic carbon The rapid titrimetric method as described by Walkley-Black (APHA, 1985) was adopted. About 1g of sample was weighed out in duplicates and placed in a 250ml conical flask. This was followed by pipetting accurately 10ml of 1N potassium dichromate solution (K2Cr2O7) into each flask and swirled gently to disintegrate the soil. Using an automatic pipette (or 20 ml measuring cylinder), Biochemical Characterization and Identification of Bacteria Isolated in the Study For the biochemical characterization and identification of the bacterial isolates standard procedures as enunciated in the Bergey ’s Manual of Determinative Bacteriology (1993) were employed. The following tests were carried out and results obtained accordingly Gram staining, Spore staining, Catalase test, Citrate utilisation test, Motility test, Oxidase test, Indole test, Sugar fermentation tests, Methyl red test and Voges-Proskauer test RESULTS The soil contained about 70% silt particles (0.03mm) and 30% sand particles (2-0.05mm). The percentage porosity was estimated at 56% and bulk density 1.0g/cm3. The results showing the pattern of the pH during the course of the experiment are shown in Table 1. about 20ml concentrated tetraoxosulphate (VI) acid was added rapidly directing the stream into the suspension. The flask was immediately swirled gently until the soil and reagents were mixed and then swirled more vigorously for 1 minute. The beaker was rotated and allowed to stand on filter paper for 30mins. After 30 mins, 100ml of distilled water was added. This was followed by adding 3 drops of indicator (methyl red) and titrated with 0.5N ferrous solution. The solution turned greenish cast and then changed to dark green at the end point. At that point, the colour changed sharply from blue to red (maroon red) in reflected light against the white background. The total organic carbon was determined using the values of the titration. The pH values showed a rapid drop to acidic range after pre-treatment with calcium carbonate, the pH values rose toward neutrality with readings 7.10 in E1 at day 30. At day 50, pH readings ranged from 6.00-7.01. A mesophilic temperature range (28°C-31°C) was recorded during the study as shown in Table 2. The results of the maximum water holding capacity (WHCmax) are presented in Table 3. There was no considerable variation in WHCmax during the study. All experimental set ups except E1, on day 50, showed % WHCmax between 20-80%. The total heterotrophic count for the set-ups is shown in Fig 1. The lowest and highest values were less than 3 logs apart. E1 and E2 recorded the highest titres of 4.0 x 10⁷ and 1.83 x 10⁷ cfu/g respectively. These experiments received all the treatments except E2 was not tilled. E3 which received no treatment at all recorded the lowest count during the study period. Table 1. The pH readings of the experiments during the study periods
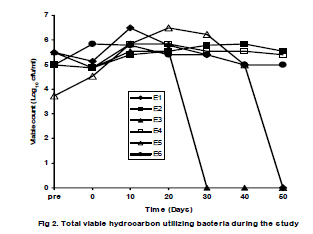
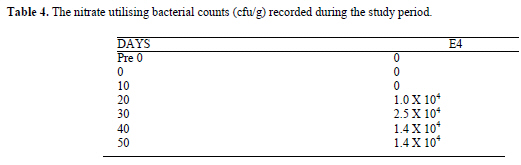
Results represent means + Standard Deviation of duplicate reading. The results in Fig 2 are for the total hydrocarbon utilizers. Overall, the counts are lower than obtained for the total heterotrophs. E1, E2, E5 and E6 showed increase in counts after day 10. E1 recorded the highest count of 3.3 x 10⁶ cfu/g. at day 10. Nitrate utilizing bacteria were enumerated in experiment 4 (anoxic conditions) during the course of the study (Table 4). In general the numbers were low and detectable only after 20 days. Table 2. The temperature readings taken in all the experiments during the study period (ºC)
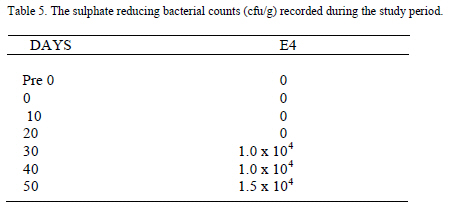
Results represent means + Standard Deviation of duplicate reading. The sulphate reducing bacteria were also days into the experiment (Table 5). The total counts enumerated in experiment 4 (anoxic conditions) 30 were comparable to those of nitrate utilizers. Table 3. The percentage (% w/w) water holding capacity recorded during the study period (WHC max)
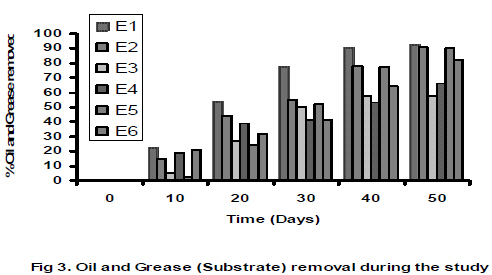
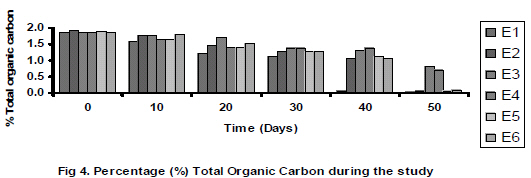
EC = Control experiment representing field % WHCMAX The effects of the treatments on total hydrocarbon content in all the experiments during the study (oil and grease) is shown in Fig 3. There was period (0-50 days). This is reflected in the increase general decrease in the level of hydrocarbon in the removal rate, Fig 3. The results follow the trend exhibited by the total heterotrophic counts and the total hydrocarbon utilizers. Rapid removal was recorded in E1, E2, E5, and E6. The control (no treatment, E3) and the anoxic conditions (E4) showed lower rates of removal (Fig 3). At the end of study, hydrocarbon loss recorded in all the setups indicated not less than 57.5%. The aerated and tilled set-ups recorded the highest percentage hydrocarbon loss of greater than eighty percent (>80%). The results of total organic carbon content are recorded in Fig 4. At day 0, the total organic carbon (TOC) level was 1.86% (E1), 1.90% (E2), 1.83% (E3), 1.86% (E4), 1.88% (E5) and 1.86% (E6). The total organic carbon level recorded on day 50 were 0.06% (E1), 0.08% (E2), 0.58% (E3), 0.70% (E4), 0.07% (E5), and 0.09% (E6). E3 (neat soil plus hydrocarbon only) had the highest total organic carbon level at day 50 while E1 (that received all the treatments) had the lowest total organic carbon level at day 50 i.e. residual organic carbon. E4 (the anoxic conditions) had less residual organic carbon than the control E3 indicating that organic carbon removal took place under anoxic conditions. Results represent mean number of colony count in From the biochemical and biophysical tests carried duplicate reading multiplied by the dilution factor. the results showed the following genera of bacterial isolates as hydrocarbon utilizers namely Acinetobacter, Alcaligenes, Bacillus, Actinomyces, Brevibacterium, Pseudomonas and Arthrobacter, Serratia, Corynebacterium, Flavobacterium. DISCUSSION There is an enormous task of cleaning up hydrocarbon contaminants, which have being accidentally or indiscriminately introduced into the Niger – Delta environment. Many of the standard techniques employed for the clean up task have not yet offered a permanent solution to the problem (Abu and Ogiji, 1996). Bioremediation, though a very cost effective and environmentally friendly technique, has been limited by various factors with oxygen being one of the most important factors. Inability to optimise and control all the prevailing conditions has impaired the effectiveness of this otherwise, very effective technique. Optimum environmental conditions and nutrient application rates generally have to be established in the laboratory/bench – scale studies and small field pilot tests. Treatment, therefore, generally consists of optimising such conditions as pH, temperature, soil moisture content, soil oxygen content and nutrient concentration. This is to stimulate growth of the organisms that will metabolise the particular contaminants present (Sims and Bass, 1984). These studies indicate that oxygen and nutrients are particularly essential to bacterial stimulation in contaminated sites. Hence, oxygen as a limiting factor in bioremediation was monitored for 50 days under varying aeration conditions and with comparisons with a set up that simulated oxygen limitation conditions. The parameters monitored during the study included changes in pH, temperature, changes in %moisture content, total heterotrophic counts, total hydrocarbon utilizers, sulphate reducing bacteria, nitrate oxidising bacteria, hydrocarbon (oil and grease) levels, total organic carbon and % substrate removal, in the different experimental set-ups. The pH values at pre-treatment were in acidic range (5.90-6.20). There was further drop to high acidity (4.50-6.10) after treatment with bonny light crude, surfactant, hydrogen pyrogallol and hydrogen peroxide. There was a shift towards neutrality at day 10 (5.45-6.45) after treatment with calcium carbonate (lime). The shift may be probably due to the addition of fertilizer (N.P.K.) and lime. Liming has been found to favour the biodegradation of oil (Bossert and Bartha, 1984). Rapid decomposition of wastes and residues is usually in the range of 6.5 – 8.5. Bacteria and actinomycetes have pH optima near 7.0. pH values of 6.80, 7.10, 6.85 and 6.90 were recorded in experiment 1 (E1) at days 20, 30, 40 and 50 respectively. The degradation of hydrocarbon was relatively rapid in this treatment indicating that the pH values recorded during the period of the study were suitable for biodegradation. Soil temperature is one of the most important factors controlling biodegradation (Sims and Bass, 1984; Baker and Herson, 1994). Generally mesophilic temperature ranges are best suited for the majority of microroganisms encountered. Tropical environments such as the ones we report here (25ºC to 33ºC) would hardly require further adjustments or modifications in temperature. Improved aeration and oxygenation was achieved by tilling and the application of 0.05% (500ppm) hydrogen peroxide. At the Traverse city, Michigan, bioremediation of a contaminated site was achieved by an increase in the oxygen concentration in water through addition of hydrogen peroxide and was observed to positively affect the rate of biodegradation (US EPA, 1991). Experiment 1 (E1) and experiment 2 (E2) which were both treated with 500ppm hydrogen peroxide showed a marked increase in microbial activity followed by a corresponding high removal of hydrocarbons. In a study carried out by Texas Research Institute, Inc., (1983), the maximum concentration of peroxide that could be tolerated was 0.05% (500ppm), although by gradual increase in concentration, the level of tolerance could be raised to 0.2% (2000ppm). Tilling can enhance aeration and lead to availability of more oxygen to the system (Odu,1987). An oxygen depleted environment was stimulated in E4 by treatment with 10% hydrogen pyrogallol solution. Results showed the presence of microbial activity. Nitrate utilizing bacteria and sulphate reducing bacteria were present in relatively large numbers (Tables 4 and 5). This is an indication that alternate electron acceptors such as SO42- and NO32- were utilised by organisms for biodegradation (Hutchins and Wilson, 1994). E4 was particularly water logged to further remove oxygen. The soil had little or no organic nutrient present. On the average, the TOC level of each experiment was stepped up by 90% following application of crude oil. All the carbon present at day 10 may be attributable to the crude oil carbon content only. There was a general decrease in TOC level by day 50. E1 and E2 recorded the lowest levels of TOC having 0.06% and 0.07% respectively (about 97% decrease) while E4 showed only 62.4% decrease at day 50. The results indicate that there was utilisation of carbon by the microorganisms with the highest rates recorded in E1 and E5. The drastic decrease in carbon level corresponded with decrease in microbial activity at days 20 and 40 showing that the microbial activity was linked to the availability of the organic carbon. The maximum water holding capacity (WHC) as shown in Table 3 indicates that the contaminated soil had between 20% -60% WHCmax of the uncontaminated soil. This range is optimum for biodegradation since values much lower than this would tend to desiccation while values much higher would tend to anoxic conditions (Bossert and Bartha, 1984; Huesemann, 1993). Hydrocarbon level (oil and grease) as shown in Fig 3 is explained by gradual substrate removal over time. At day 0, 2000ppm oil and grease level was recorded for the experiments. The degradation was at different rates in the different experiments depending on the treatment applied. The substrate removal rate was proportional to the microbial count. Higher residual hydrocarbon was recorded in E3 and E4 at day 50 with E3 (treatment with only hydrocarbon) showing 57.5% hydrocarbon removal. E4 (treatment with hydrocarbon, surfactant, N.P.K. and hydrogen pyrogallol) showed 65% hydrocarbon removal. E1, E2, E5 and E6 showed little or no residual hydrocarbon. By comparison, microbial activities in E1, E2, E5 and E6 were higher than E3 and E4.This is an indication that more favourable conditions existed in E1, E2, E5 and E6 for enhanced biodegradation. It also shows that there was activity in the anoxic conditions of E4. Microbial counts in the soil were rather moderate. There was initial decrease in count after treatment (day 0) recorded in some of the set-ups. Microbial numbers and activity may be depressed by even light hydrocarbon contamination (Odu, 1977). Although the counts of hydrocarbon utilisers were low compared to the total heterotrophic counts, their presence at all in pre-treatment soil samples further suggests that the number of hydrocarbon degrading organisms in a soil reflects the soil’s past exposure to hydrocarbon (Atlas, 1981). The generally moderate to low microbial counts recorded in both the total heterotrophic count and total hydrocarbon degraders could be due to low carbon content of soil at pre-treatment. Organic matter is very important to the microbial ecology and activity in soil (Sims and Bass, 1984). The substrate removal (Figs 3 and 4) shows that greater than 80% hydrocarbon content was utilised in E1 and E2. E3, E4 and E6 showed 57.5%, 65% and 80% removal respectively. E1 showed the most effective treatment. There was 22.5%, 52.5%, 77.5% and above 80% substrate removal at days 10, 20, 30, 40 and 50 respectively. By comparison with E4 (anoxic), E1 has about 30% enhanced degradation. This indicates that aerobic degradation may be about 30% more effective than anaerobic biodegradation. In general organic compounds are more effectively degraded in the presence of oxygen. The residual hydrocarbon in E4 at day 50 may have also been due to accumulation of organic products arising from incomplete degradation. Aerobic degradation is usually complete yielding water, carbon dioxide and biomass. Occurrences in E3 may be due to the absence of surfactant and fertiliser (N.P.K). Surfactants break down crude components into smaller particles for microbial assimilation. Emulsification of oil will aid in mobilising them through the soil (Vanloocke et al, 1979). Addition of nutrients can be supplied with common inorganic fertilisers (Abu and Ogiji, 1996). This supplementation is necessary to provide such major nutrients as nitrogen and phosphorus. Thus, the N.P.K. (15: 15: 15) was used as a nutrient supplement. From the results obtained the NPK formulation is suitable for bioremediation in the Niger delta. The micro organisms isolated and identified in the course of the study included Acinetobacter, Alcaligenes, Flavobacterium, Pseudomonas, Bacllus, Actinomyces, Arthrobacter, Serratia, Corynebacterium and Brevibacterium. Natural soil bacteria may be present in a dormant or slow growing state, but when stimulated by a specific set of environmental conditions may multiply rapidly and subsequently adapt to the new environment. Some of the more common genera of bacteria involved in bioremediation of hydrocarbon contaminated sites include Nocardia, Pseudomonas, Mycobactrium, Vibrio, Achromobacter, Acinetobacter, Flavobacterium, Brevibacterium, Micrococcus, Arthrobacter and Corybacterium (Kobayashi and Rittman, 1982, Soli, 1973; Abu and Moro, 2004). Other works (Atlas, 1997) have also revealed that cultures containing consortia of microorganisms appear to have greater hydrocarbon utilising capabilities than many of the individual culture isolates. Most of the organisms isolated are strict aerobes and a few facultative anaerobes. The overall result shows over 50% substrate removal in all the treatments. Since E3 which was treated with only hydrocarbon also recorded loss in hydrocarbon (57.5%), it may be concluded that the disappearance of crude from the soil samples may not be attributable solely to enhanced biodegradation. The behaviour of toxic pollutants in the environment also depends upon a variety of processes and properties including chemical processes (hydrolysis, photolysis, oxidation, reduction, hydration), physical processes (advection, dispersion and diffusion, sorption, volatilisation, solubilisation, viscosity, density, dilution) and biological processes (bioaccumulation, biotransformation, biodegradation, toxicity) (Ghisalba, 1983; Josephson, 1983; Abu and Ofurum, 2006). These processes are collectively referred to as natural attenuation so you have what is called remediation by natural attenuation. The extent to which oxygen can limit bioremediation was determined statistically (Nduka and Ogbonnaya, 1996) in our study using the Pearson product – moment correlation technique (r) and the table value (t) and the calculated value to determine the level of significance in correlation. The correlated experiments were E1 and E2; E1 and E4; E1 and E5; E3 and E6. In all, the result showed that they are significantly correlated. This means the rate of bioremediation was limited by various prevailing factors of aeration since other factors were optimised. In conclusion it is observed that the rate of biodegradation monitored during the study showed varied results dependent upon each treatment. The major findings could be summarised thus: holding all other prevailing conditions at an optimal level, oxygen levels acted as an enhancing parameter for degradation of contaminant hydrocarbons. Aerobic degradation was found to be not less than 30% more effective than anaerobic degradation. Experiments that involved application of different aeration and oxygenation techniques yielded better results than those applied singly. All experiments irrespective of treatment applied showed not less than 50% hydrocarbon degradation, which may be due to remediation by natural attenuation. One of the objectives of this study is to device a cost effective solution to the problems associated with bioremediation of oil impacted soil ecosystems in the Niger Delta (Water Quality International, 1997). This means proffering a cost effective and rapid solution to these problems. Based on this study, in order to achieve an effective bioremediation process, we recommend that a combination of different efficient aeration techniques be applied during bioremediation processes. REFERENCES
Copyright 2008 - Journal of Applied Science and Environmental Management The following images related to this document are available:Photo images[ja08002t2.jpg] [ja08002t1.jpg] [ja08002t4.jpg] [ja08002t5.jpg] [ja08002t3.jpg] [ja08002f1.jpg] [ja08002f2.jpg] [ja08002f3.jpg] [ja08002f4.jpg] |
| |||||||||
