 |
| About Bioline | All Journals | Testimonials | Membership | News |
|
||||||
|
||||||
Journal of Applied Science and Environmental Management, Vol. 12, No. 1, March, 2008, pp. 57-62 Determination of some Physico-chemical parameters of the Nairobi River, Kenya Dulo, Simeon Otieno Department of Civil Engineering, University of Nairobi, Box 6885, 00300, Ronald Ngala, Nairobi, Kenya. Tel -254 733 423 864. Email otienodulo@yahoo.co.uk,sodulo@uonbi.ac.ke Code Number: ja08009 ABSTRACT This paper discusses the results of a study carried out in 2003 on the water quality of Nairobi River on the basis of pollution parameters and water quality index. The study aimed at establishing whether the water meets the surface water quality criteria for water supply. The area of study in Nairobi River was within its entry and exit of Nairobi province. It was observed that human activities along the river with visible encroachment to the banks, contribute to the heavy level of pollution of the river. This is the section that industrial discharges and municipal sewerage are discharged into the river. The study was carried out through field surveys and laboratory tests on samples taken from the river. The results obtained from laboratory tests were analysed and compared to the established surface water quality criteria by A.S.C.E, W.H.O, Natural watercourses Standards of Kenya and classification of rivers by Royal Commission on Sewage Disposal. Human activities along the river course have severely impacted on the River water quality. The study area had average pH of 7.04; the average turbidity was 41.5N.T.U, the average suspended solids in the section was 116.43 mg/l, the average dissolved oxygen was 4.32mg/l. the average BOD was 182.5mg/l. The average COD for the reach studied was 49.5mg/l. The river was therefore classified as bad according to Klein 1966. The study concluded that the Nairobi River within Nairobi province was badly polluted as indicated by the water quality index analysis. The WQI gives a value of 49.27, fall between the numerical ranges of the classification of bad (26-50). @JASAEM Worldwide, pollution of rivers and streams has stream of the Nairobi River being adversely become one of the most crucial environmental affected. Also lack of environmental awareness and problems of the 20th century. Although some kinds law enforcement capacity, has left Nairobi of water pollution can occur through Natural residents with a deplorable situation impacting processes, it is mostly as a result of human adversely on all who live in, or indeed visit the activities. Pollution is defined as: to make foul or city. unclean, dirty. Water pollution occurs when a body of water is adversely affected due to the addition of To ascertain the extent of pollution in the river, a large amounts of materials to the water and When it study was undertaken by the University of Nairobi is unfit for its intended use, water is considered in 2003. The findings of this study form the main polluted (Klein. L, 1966). The International Joint discussion of this paper. The World Conservation Commission designated the St. Clair River as an Union (IUCN), together with the University of area of concern in 1985 (Patty, 2006). The Nairobi, the Network of Water and Sanitation, designation was due to several parameters of the other NGOs, UNEP, UNDP, UN HABITAT, river that are considered to be impaired. Primary relevant government agencies and the corporate among these are contaminated sediments, chemical sector, have since made a followup to implement a loadings, beach closures and habitat loss. Kenya’s four-year programme (Geoffrey, 2006), with scarce water resources are under threat from funding from various bilateral donors and the UN pollution with the major sources of pollution being system. The World Conservation Union (IUCN) domestic/municipal and industrial. Human and partners entered the third phase of the Nairobi settlements along the Nairobi River have increased River Basin Programme to restore the riverine dramatically due to the growth of the city and ecosystem to provide clean water for the city, for population increase. This has raised serious the environment and for the people of Nairobi – as concern for the environmentalists on the state of well as for the many users downstream. Nairobi Nairobi River for the last two decades. The River City, inland Capital of Kenya, is located almost at has seen a massive deterioration in quality with the the top of the watershed of the Athi River, the increase in population of the city. This increase in second largest in the country, which eventually the city’s population coupled with a sluggish flows into the Indian Ocean. A network of economy has led to the mushrooming of slums, tributaries, known as the Nairobi Rivers, run from which tend to reside next to the riverbanks of the eastern escarpment of the Great Rift Valley which sanitation facilities are non-existent. Since through the city of Nairobi with its residential, the communities are not served by amenities and business and industrial areas, as well as through public utilities, they have tended to discharge their forests, agricultural areas and scattered suburbs. It raw sewage into the streams next to them. This has is in this complex of urban, peri-urban and rural lead to the well being of communities living down settings that the Nairobi River Basin Programme (phase III) is set. The Union is assisting the partners to develop Environmental Management and Urban Plan for the Nairobi Rivers system, using experience gained in the crafting of many other more rural environmental management plans in the region. This programe builds on gradual work on the polluted Nairobi River system initiated by the Union in 1998 during discussions about the restoration of Nairobi Dam. The dam is a part of the river system originally designed as an emergency and industrial water storage – but which has become seriously polluted, infested with invasive water weeds and silted almost to the top of its dam wall. Phases I and II of the programme experimented with various community-based actions to improve the water quality and supply in the rivers as well as to gather data for this third expanded effort. The third phase aims to contribute to improvements in the river system, the waters and the environment of the Nairobi area. This is a new endeavour for IUCN, because it combines environmental planning principles with urban planning which also considers commerce, industry and urban agriculture in a city setting. The cohesive force is the resolution of the partners and stakeholders to improve the condition of the river system and its waters and, through that approach, improve the environment of the city and the well-being of its inhabitants. A particular challenge facing the project is the fact that the early city plans have been gradually abandoned leading to unplanned urban development encroaching on the former riverine areas – sometimes spanning the river channel and even submerging it under buildings. ANPPCAN Head Office (ANPPCAN, 2005), through its COT programme, is among other organizations involved in the implementation of activities of the project in the third phase. A UNEP initiative, the programme seeks to rehabilitate the Nairobi river basin and ecosystem as well as enhance sanitation levels of the communities that live along the river basin. Some of the preparatory activities already conducted in the third phase of the project include holding of steering committee meetings, consultation on NRBP funds and the official launch of the programme. The Belgian Government provides financial support to the programme through the United Nations Environmental Programme (UNEP). The main objective of the Nairobi River Basin Programme is to rehabilitate, restore and effectively manage the Nairobi River basin Ecosystem in order to provide recreation, industrial and emergency water supply, generate electricity and also enhance sanitation levels especially for communities living downstream. To achieve this goal the programme has five major output areas:
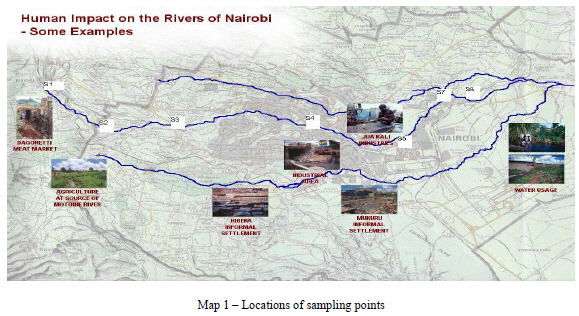
SAMPLING POINTS To give a reflection of the quality of water in Nairobi River as it traverses the built-up areas of the City, the study identified eight sampling points as indicated on the map 1. The sampling was done in accordance with the manual for water quality sampling (Esther De Lange, 1994). Sampling point l (S1) – Kikuyu, Kiambu District.
The source of the Nairobi River. DISCUSSION OF RESULTS
Sampling Point 6 (S6) – Dandora Bridge. pH The river was acidic upstream, with an average pH of 6.85 and moderately basic downstream (pH 7.14). The increase in pH can be attributed to organic pollution and the domestic waste discharge draining into the river system as it traverses the habited City. The average pH of the river was 7.04. Thus within the national watercourses standards by W.H.O for aesthetic quality i.e. 6.5 – 8.5 Turbidity The first sampling point had a turbidity of 8 (N.T.U). The value rose gradually along the sampling points to 57 (N.T.U). At S1 the water emanates from natural springs hence low turbidity. As the water flows to S2 the turbidity increases as it passes through farms in the uplands; this is attributable to sediments resulting from soil erosion from farming activities. At S2 the water nears the town center where it is characterized by lesser farms and thus less erosion, the turbidity thereby decreases as particles settle discretely due to the reduced velocity of the river up to the point S4. As water flows to S5 turbidity increases and this can be attributed to urban runoff pollution as the stream passes through the city. However the turbidity surges up at sampling point S7. This sampling point is the discharge from the Kariobangi effluent Treatment plant. It can therefore be noted that the river has the capacity to self-purity itself as witnessed between points S2 and S4. The average turbidity for the study area was 41.5 (N.T.U), thus the river is a poor source based on the W.H.O value. Suspended Solids The suspended solids for the study area ranged between a low of 4mg/l and a high of 320mg/l. The surge in suspended solids between S4 and S5 is increase in waste deposition in the river course especially at the globe cinema roundabout, Kariakor Bridge and as the river course passes the Gikomba market. The average suspended solid in the section was 116.43 mg/l. This value is higher than the 30mg/l set for national watercourses in Kenya. This is indicative of massive pollution entering the watercourse. Dissolved Solids The dissolved solids in the study area averaged 350 mg/l this value was obtained from the Nairobi city council offices for the study period. This value is okay as it meets the standards for natural watercourses in Kenya, which is a maximum of 1200 mg/l Dissolved Oxygen (D.O) From the tests carried out, the dissolved ranged between 9mg/l to 0.7mglL for the reach studied. The decrease in dissolved oxygen between S1 and S2 could be attributed to waste being discharged into the river from neighboring communities, which live next to the river. This suggests that most of the discharges are organic in nature and hence required oxygen for decomposition. Mostly these wastes are in the form of organic soaps, which are used to wash clothes along the riverside. Between points S2 and S4 oxygen increases and this is attributable to the water passing over a weirs just before point S3 and S4. The average dissolved oxygen was 4.32mg/l. This is less than that set by the natural water courses standards. Biochemical oxygen Demand For the study area, the BOD at the upstream was 2mg/l and 540mg/l at the downstream. Past point S4 the BOD increases sharply and steadily due to constant increase in effluent discharge to the stream and also organic waste. It increases sharply at point S8 due to discharge from the Kariobangi sewer treatment plant, organic waste deposit from the neighboring market, and the piggeries neighboring the watercourse at the market. The average BOD is 182.5mg/l. Thus according to Klein 1965 the river can be classified as bad. The BOD level exceeds that allowed by the public sewers standards in Kenya as set by the government and the Nairobi city council indicating massive pollution. Chemical Oxygen Demand The results from Nairobi River indicate a gradual then steady increase in the COD from S3 all the way to S8. The COD at S7 is highest which is from the Kariobangi sewage treatment plant, which is 102mg/l. This is way higher than that allowed by the natural water courses standard which allow a maximum of 50 mg/l. this means that the kariobangi sewerage treatment plant is polluting the Nairobi river by releasing higher concentrations of possible toxins into the river. The average COD for the reach studied was 49.5mg/l. The river can therefore be classified as bad according to Klein 1966 Table 1 but this is an acceptable value according to natural water courses standards set by the government of Kenya. Coliform Count For the study area the count was 3500/100ml this is way above that set given by natural water courses standard set by the government of Kenya which is 1000/100ml. Indicating massive pollution of the river. Conclusion The section of the Nairobi River within Nairobi province is badly polluted as indicated by the water quality index analysis. The WQI gives a value of 49.27, fall between the numerical ranges of the classification of bad (26-50).
Recommendations The following recommendations aimed at improving the quality of the river water and reducing pollution as made in this study.
REFERENCES
Copyright 2008 - Journal of Applied Science and Environmental Management The following images related to this document are available:Photo images[ja08009t1.jpg] [ja08009f1.jpg] [ja08009m1.jpg] |
| |||||||||
