 |
| About Bioline | All Journals | Testimonials | Membership | News |
|
||||||
|
||||||
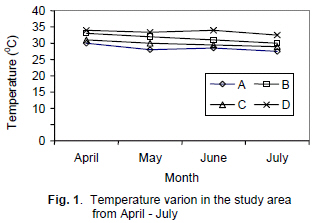
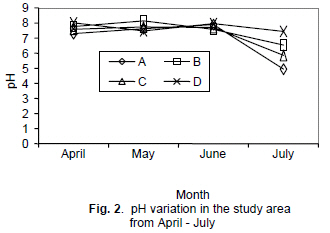
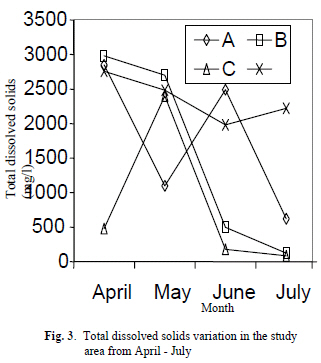
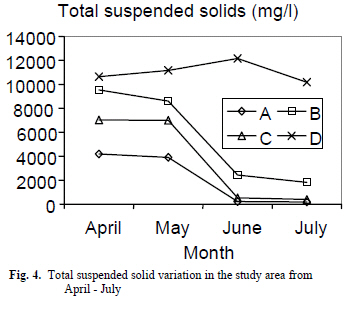
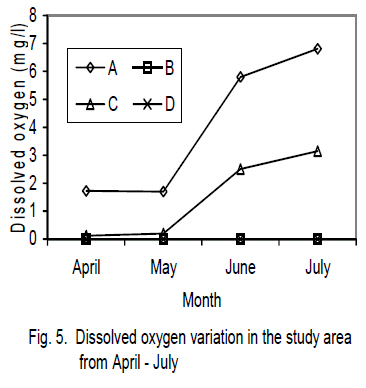
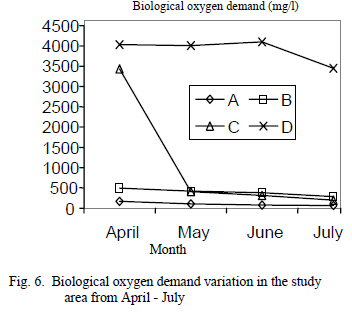
Journal of Applied Science and Environmental Management, Vol. 12, No. 1, March, 2008, pp. 73-77 Impact of abattoir effluents on surface waters of the Alamuyo stream in Ibadan Raheem N.K.; Morenikeji *0.A. *Parasitology / Environmental Biology Unit Department of Zoology, University of Ibadan, Nigeria. jumokemorenikeji@yahoo.co.uk jumoke.morenikeji@mail.ui.edu.ng Tel +234 8055275915 Code Number: ja08011 ABSTRACT Physico-chemical analysis were carried out on samples collected from four sampling stations located along a stream that receives effluent discharge from an Abattoir in Ibadan, Nigeria using standard methods. The data revealed that the effluent discharge had high temperature (33.48±0.354oC); H+(7.70±0.86); TDS(2363±166.46mg/l); TSS(11032±424.95mg/l); BOD(3898±150.78mg/l); COD(6738.5±204.43mg/l); total hardness v(448.25±33.51mg/l); SO42-(15.303±0.389mg/l); NO3-(24.13±0.593mg/l); PO43-(5.283±0.221mg/l); b NH3(76.14±0.938mg/l); Ca(63.33±2.4041mg/l); (375±33±5.175mg/l);Na(975±27.54mg/l); Fe(5.52±0.44mg/l); Mn(0.433±0.092mg/l) and Zn(0.307±0.020mg/l). DO was not detected in the effluents. Comparison of the water physico-chemical status and the abattoir effluent load indicates that, there seem to be pollutional stress of the stream. @ JASEM The meat slaughtering and meat processing industry consists of a number of small plants. The main wastes originate from killing, hide removal or dehairing, paunch handling, rendering, trimming, processing and clean up operations. The wastes contain blood, grease, inorganic and organic solids, and salts and chemical added during processing operations. The excessive production of organic matter leads to the build up of “sludge” and the mineralization process consumes all dissolved oxygen from a water column (Mason, 1991). The relatively high temperatures in tropical countries accelerate this process. Organic effluents also frequently contain large quantities of suspended solids which reduce the light available to photosynthetic organisms and on settling out, alter the characteristics of the river bed, rendering it an unsuitable habitat for many organisms. Ammonia is often present and this adds to toxicity (Mason, 1991). This paper investigates the physicochemical parameters of a stream which receives effluents from an abattoir, and the consequent effects of the discharge on the stream. MATERIALS AND METHODS Study area The abattoir under study is located behind a cattle ranch at Bodija market, in Ibadan North local Government Area of Oyo State, Nigeria. The abattoir has an open slaughtering slab; where cows, rams, goats and pigs are slaughtered; dehairing either with hot water or burning with fire is also done in the open. Close to the slaughtering slab is a heap where paunch materials are dumped and have accumulated over the years. On the average Bodija Abattoir produces about 121 heads of cattle per day (Treasury Department, Ibadan North Local Government, 2001). Butchering of slaughtered animals takes place all over, washing of viscera and meat are done freely into drains. The waste materials from the Abattoir are washed through a drainage, which links the Abattoir and the stream (Alamuyo stream which is some 500 meters away). The drainage transcends the Bodija goat market and Bodija saw mill. Alamuyo stream is a tributary to a river called Orogun. Methods The experimental work was divided into field sampling and laboratory experiments, for a period of four months (April, May, June and July, 2001). Samples were collected between 800 and 1200hours at four locations, A, cB, C and D. Station A (50 meters upstream from the point at which effluents enter the stream); B (point at which effluents enter the stream) and C (50 meters down stream of the point of effluent discharge), were located along the Alamuyo stream. Station D is the point of effluent discharge from the Abattoir. Temperature was measured with a mercury in-glass thermometer in the field, pH of the samples was determined by Electrometric method using a pH meter at room temperature and total hardness was determined using Ethylenediamine tetraacetic acid (EDTA) using tritrimetric method. Total Suspended Solids (TSS) and Total dissolved solids (TDS) were determined by gravimetric method at temperature of 103-105oC and 180oC respectively (APHA/AWWA/WEF 1992). Dissolved oxygen (DO), before and after incubation, was determined by the winklers tritrimetric method. Biochemical Oxygen Demand (BOD) was determined after incubation for 5 days at 20oC, using winklers tritrimetric method. Phosphate was determined using colorimetric method. The Chemical oxygen demand (COD) was determined by the open reflux method, sulphate by turbidmetric method, ammonia by tritrimetric method and nitrate by the ultraviolet spectrophotometric method, which measures the rate of absorbance of NO3 at 220mm. Samples for metals were digested by nitric acid digestion method. Magnesium, Manganese, Iron, Calcium and Zinc were determined using Atomic Absorption Spectrophotometry while sodium and potassium were determined by flame atomic emission spectrophotometry (APHA/AWWA/ WEF 1992). The mean of each physico-chemical parameter was determined for each sampling station and analysis of variance (ANOVA) and Duncan Multiple Range Test (DMRT) were used to determine statistical differences and similarities between the means of each parameter in the four stations. Correlation coefficient (r) was used to identify the relationship between pairs of limnological parameters. Values of correlation coefficient(r) equal to or greater than the tabulated values at 1% and 5% probability levels and corresponding degrees of freedom (d.f) were taken to be significant and any values below the levels were rejected. RESULTS AND DISCUSSION The highest mean value for temperature was recorded in station D (33.48 ±0.354oC) and the minimum in station A (28.5.±0.540oC) (Fig 1). There was statistical difference (P<0.05) in the mean temperature values for the four stations; and the most dissimilar stations were A and D, while station B and D had close temperature values (31.5.± 0.646oC and 33.48.± 0.354oC respectively). Temperature was most variable in station B, with minimum value of 30oC and maximum value of 33oC. Stations A and B showed the highest temperature variation. Hydrogen ion concentration (pH) values for the four stations tended towards alkalinity. Minimum mean value of 7.26 ± 0.381 and maximum mean value of 7.70 ± 0.086 were recorded for stations A and D respectively (Fig 2). Station A presented the highest variation in pH value among the four stations. Total dissolved solids (TDS) mean values ranged between 785.75 ± 544.00mg/l and 2363.5±166.46mg/l for stations C and D respectively. Analyses of variance results show that there was significant difference (6.39) in TDS values at P<0.05. DMRT revealed that stations and D were significantly different (Figure 3). Total Suspended Solids (TSS) mean values in the four stations varied between 2117±111.73mg/l and 11032±424.95mg/l for stations A and D respectively. There was a wide variation between TSS values for stations A and D throughout the study period (Figure 4). Station D presented a mean value of 0.000±0.000mg/l dissolved oxygen throughout the study period and the highest mean DO value of 4.01±1.342mg/l was recorded in station A. Stations A and D varied widely in DO concentrations through the study period (Figure 5). Station A had the lowest mean value of BOD (105.25±23.37mg/l) and station D had the highest mean value (3898.5±150.78mg/l) (Fig 6). Analysis of variance (ANOVA) showed a statistical difference, F-value (18.84) at p<0.05 in the four stations. Stations A, B and C were similar, while station D was significantly different from the other stations. Stations A and D varied widely in BOD values throughout the study period. COD mean values ranged between 165 ± 19.7mg/l and 6738.5±204.43mg/l for the four stations. Analysis of variance results revealed a significant statistical difference (858.26) in mean COD values for the four stations (at p<0.05). Stations A and D showed wide variation in COD values. Total Hardness mean values ranged between 139.33 ±13.38mg/l and 448.25 ±33.51mg/l for stations A and D respectively. Analysis of variance (F-value 23.92) showed that there was statistical difference at p<0.05 for all the stations. Duncan Multiple Range Test (DMRT) showed that the two most dissimilar stations were A and D. SO4 2- mean concentrations ranged between 2.333±0.75mg/l (station A) and 15.303 ±0.389mg/l (station D). F-value (24.09) showed that there was statistical difference (at p<0.05) among the mean values of sulphate in the four stations during the study period. Duncan Multiple Range Test showed that the difference was between stations A and D. There was a wide variation between stations A and D throughout the study period for sulphate. The lowest mean value for Nitrate (0.69±0.221mg/l) was recorded in station A and the highest value of 24.13 ±0.593mg/l was recorded in station D. F-value (17.61) showed that there was statistical difference (at p<0.05) in the mean values of Nitrate for the four stations; DMRT showed that stations A and D were significantly different in nitrate concentration. Mean phosphate concentration ranged between 0.037 ±0.027mg/l (station A) and 5.283 ±0.0221mg/l (station D). Fvalue (17.14) showed that there was significant difference (p<0.05) in the mean phosphate concentrations for the four stations. Stations A and B gave the highest difference in mean values. The lowest mean value of 8.88 ±1.204mg/l and highest mean value of 76.14 ±0.938mg/l for ammonia (NH3) was recorded in stations A and D respectively during the study period. Analysis of variance (ANOVA) result shows that there was significant difference among the stations (F-value = 148.99, at p<0.05). The mean concentration of Calcium (Ca) ranged between 37.33 ±2.906mg/1 and 63.33 ±2.404mg/l for all the stations. F-value (13.18) showed that there was significant difference (at p<0.05) in the mean of calcium in the four stations. DMRT revealed that the difference was between stations A and D. The lowest mean concentration for Potassium (K) was recorded in station A (87.67 ±41.43) and the highest mean at station D (375.33 ±5.17mg/l). DMRT showed that there was significant difference in the means of stations A and D for potassium. Station A had a mean value of 260.67 ±120.49mg/l and station D had a mean value of 975 ±27.54mg/l for Na. Duncan Multiple Range Test (DMRT) revealed that there was statistical difference in mean concentrations of sodium for stations A and D. Fe concentration ranged between 1.127 ±0.667mg/l and 5.52 ±0.442mg/l for stations A and D respectively. F-value (7.58) showed that there was statistical difference in the mean concentration of iron in the four stations. Stations B, C and D were not significantly different, while station A varied significantly from the three other stations. The concentration of Mn was relatively low in the four stations; its mean values ranged between 0.097 ±0.087mg/l and 0.433 ±0.092mg/l, for stations A and D respectively. Analysis of variance (ANOVA), F-value = 3.66 at p<0.01, showed there was statistical difference in manganese concentration in the four stations. The mean values of stations A and D were significantly different. The mean concentration for Zn in the four stations ranged between 0.077±0.067mg/l and 0.307±0.020mg/l in stations A and D respectively. Duncan Multiple Range Test (DMRT) revealed a statistical difference between stations A and D. In station A, TSS correlated inversely with DO (r=- 0.988 at p<0.05), COD (r=0.981 at p<0.05), SO4 (r=0.963 at p<0.05). DO correlated with K (r=0.997 at p<0.05). BOD correlated with SO4 (r=0.958 at p<0.05). COD showed correlation with NO3 (r=1.000), K (r=0.998) and Na (r=0.99a) all at P<0.05. SO4 correlated with Ca (r=1.000) at p<0.01. NO3 correlated with K (r=0.999) and Na (0.998) at p<0.05. NO3 correlated with K (r=0.999) and Na (0.998) at p<0.015. PO3 correlated with Fe (r=0.999) at p<0.05 and with Mn and Zn (both have r = 1.000) at p<0.01. Mn and Zn showed the same correlation values with other variables. In station B, Temp correlated with BOD (r=0.988), COD (r=0.970), PO3 (r=0.997) and Ca (r=0.997) at p<0.05. pH correlated with COD (r = 0.0950) and Na (r=0.999) at p<0.05. TDS correlated with TSS (r=0.999), SO4 (r=0.991) and NO3 (r=1.000) at p<0.05. DO gave zero correlation with other variables. BOD correlated with COD (r=0.984), NH3 (r=0.998) and Mn (r=1.00) at p<0.05. COD correlated with PO3 and Ca (r=0.998) at p<0.05. PO3 correlated strongly with Ca (r=1.000) at p<0.01. NH3 correlated with Mn (r= 1.000) at p<0.05. K correlated with Na (r=0.997) and Fe (r=0.999) at p<0.05. In station C, Temp correlated with TH (r=0.999) at p<0.05. TSS correlated with DO (r=0.987), COD (r=0.985), Ca (r=0.998) at p<0.05 and with NO3 (r=1.000) at p<0.01. DO correlated with COD (r=-1.000) at p<0.01 and Ca (r=1.00) at p<0.01 and p<0.05 respectively. BOD correlated with SO4 (r=0.999) at p<0.01. COD correlated with NO3 (r=0.000) at p<0.05 and Ca (r=1.000) at p<0.01. NO3 correlated with Ca (r= 0.999) at p<0.05. Fe correlated with Zn (r=0.999) at p<0.05. In station D, DO showed zero correlation with other variables. Temp correlated with Zn (r=0.999) at p<0.05. pH correlated with COD (r=0.968) at p<0.05. TDS correlated with TH (0.963) at p<0.05. The effluent discharge had a mean temperature value of 33.48 ± 0.354oC and this influenced the temperature values for stations B and C (31.5± 0.646°C and 29.88 ± 0.427°C respectively). The rise in temperature depends on the amount of heat discharge, the mode of release, the properties and quantity of receiving waters, climate and weather (Haslam, 1990). An increase in temperature will lead to an increase rate of chemical reactions and formation of dangerous complexes, it also shortens the life cycles of some invertebrates in a river below a heated discharge. In station A, the mean pH was 7.26 ± 0.381 but down-stream it was greatly influenced towards alkalinity because the urine of ruminants contains such compounds as potassium, calcium and manganese. The highest mean value (2363.5mg/l for station D) for total dissolved solids (TDS) was above the range reported for some rivers in Ibadan metropolis by Ikorukpo (1994) and Atobatele (2000). Station A recorded a mean value of 1765.75mg/l, this might not be unconnected with dissolution of organic and inorganic materials flowing into the stream through run-off. The reduction in mean values of TDS in stations B and C (1576 ± 736.7mg/l and 785.75± 544mg/l) respectively might be attributed to dilution along the stream. There was a gradual decrease in the mean values of TSS from stations D to B and B to C. This decrease could be as a result of sedimentation of some of the suspended substances in the effluents discharge as it moves down stream (Haslam, 1990). The values recorded for the four stations was higher than FEPA limit for TSS reported by Odiete (1999). The inverse correlation between TSS and DO at stations B and C suggested that with an increase value of TSS, DO value would decrease. The major components of the effluents are compounds of Ca, SO4, K, NO3 and oxidisable substances (Haslam, 1990). Dissolved oxygen concentration (DO), in natural waters depends on the physical, chemical and biochemical activities in the water body. Mean value of DO recorded for the four stations ranged from 0.000 ± 0.00mg/l and 4.01±1.342mg/l, lower than the FEPA limit of 5.0mg/l as reported by Odiete (1999) and fell within the range of 1.8– 4.6mg/l of DO reported for polluted waters. The zero value recorded for DO, in stations B and D, might be as a result of organic pollution and high temperature. This is because the rate of deoxygenation depends on dilution that occurs when effluents mixes with the stream, the BOD of the discharge, temperature of the discharge and the streams DO. BOD is frequently a measure of organic pollution. Haslam (1990) reported an approximated range of 650-2200mg/l for abattoir effluents however this study revealed a range of 3450-4102mg/l. The relative higher value for BOD at station D could be attributed to solid concentrations in the plant effluent. The high correlation between BOD and NH3 indicated organic pollution. Temperature is one of the main factors that influence BOD (Manson, 1991). This further confirms the very high correlation between Temp and BOD, in station B above. Chemical oxygen demand (COD) is a measure of the oxygen equivalent of the organic matter content of a sample that is susceptible toand D. The lowest mean concentration for Potassium (K) was recorded in station A (87.67 ±41.43) and the highest mean at station D (375.33 ±5.17mg/l). DMRT showed that there was significant difference in the means of stations A and D for potassium. Station A had a mean value of 260.67 ±120.49mg/l and station D had a mean value of 975 ±27.54mg/l for Na. Duncan Multiple Range Test (DMRT) revealed that there was statistical difference in mean concentrations of sodium for stations A and D. Fe concentration ranged between 1.127 ±0.667mg/l and 5.52 ±0.442mg/l for stations A and D respectively. F-value (7.58) showed that there was statistical difference in the mean concentration of iron in the four stations. Stations B, C and D were not significantly different, while station A varied significantly from the three other stations. The concentration of Mn was relatively low in the four stations; its mean values ranged between 0.097±0.087mg/l and 0.433 ±0.092mg/l, for stations A and D respectively. Analysis of variance (ANOVA), F-value = 3.66 at p<0.01, showed there was statistical difference in manganese concentration in the four stations. The mean values of stations A and D were significantly different. The mean concentration for Zn in the four stations ranged between 0.077±0.067mg/l and 0.307 ±0.020mg/l in stations A and D respectively. Duncan Multiple Range Test (DMRT) revealed a statistical difference between stations A and D. In station A, TSS correlated inversely with DO (r=0.988 at p<0.05), COD (r=0.981 at p<0.05), SO4 (r=0.963 at p<0.05). DO correlated with K (r=0.997 at p<0.05). BOD correlated with SO4 (r=0.958 at p<0.05). COD showed correlation with NO3 (r=1.000), K (r=0.998) and Na (r=0.99a) all at P<0.05. SO4 correlated with Ca (r=1.000) at p<0.01. NO3 correlated with K (r=0.999) and Na(0.998) at p<0.05. NO3 correlated with K (r=0.999) and Na (0.998) at p<0.015. PO3 correlated with Fe (r=0.999) at p<0.05 and with Mn and Zn (both have r = 1.000) at p<0.01. Mn and Zn showed the same correlation values with other variables. In station B, Temp correlated with BOD (r=0.988), COD (r=0.970), PO3 (r=0.997) and Ca (r=0.997) at p<0.05. pH correlated with COD (r = 0.0950) and Na (r=0.999) at p<0.05. TDS correlated with TSS (r=0.999), SO4 (r=0.991) and NO3 (r=1.000) at p<0.05. DO gave zero correlation with other variables. BOD correlated with COD (r=0.984), NH3 (r=0.998) and Mn (r=1.00) at p<0.05. COD correlated with PO3 and Ca (r=0.998) at p<0.05. PO3 correlated strongly with Ca (r=1.000) at p<0.01. NH3 correlated with Mn (r= 1.000) at p<0.05. K correlated with Na (r=0.997) and Fe (r=0.999) at p<0.05. In station C, Temp correlated with TH (r=0.999) at p<0.05. TSS correlated with DO (r=0.987), COD (r=0.985), Ca (r=0.998) at p<0.05 and with NO3 (r=1.000) at p<0.01. DO correlated with COD (r=-1.000) at p<0.01 and Ca (r=1.00) at p<0.01 and p<0.05 respectively. BOD correlated with SO4 (r=0.999) at p<0.01. COD correlated with NO3 (r=0.000) at p<0.05 and Ca (r=1.000) at p<0.01. NO3 correlated with Ca (r= 0.999) at p<0.05. Fe correlated with Zn (r=0.999) at p<0.05. In station D, DO showed zero correlation with other variables. Temp correlated with Zn (r=0.999) at p<0.05. pH correlated with COD (r=0.968) at p<0.05. TDS correlated with TH (0.963) at p<0.05. The effluent discharge had a mean temperature value of 33.48 ± 0.354oC and this influenced the temperature values for stations B and C (31.5 ± 0.646oC and 29.88 ± 0.427oC respectively). The rise in temperature depends on the amount of heat discharge, the mode of release, the properties and quantity of receiving waters, climate and weather (Haslam, 1990). An increase in temperature will lead to an increase rate of chemical reactions and formation of dangerous complexes, it also shortens the life cycles of some invertebrates in a river below a heated discharge. In station A, the mean pH was 7.26 ± 0.381 but down-stream it was greatly influenced towards alkalinity because the urine of ruminants contains such compounds as potassium, calcium and manganese. The highest mean value (2363.5mg/l for station D) for total dissolved solids (TDS) was above the range reported for some rivers in Ibadan metropolis by Ikorukpo (1994) and Atobatele (2000). Station A recorded a mean value of 1765.75mg/l, this might not be unconnected with dissolution of organic and inorganic materials flowing into the stream through run-off. The reduction in mean values of TDS in stations B and C (1576 ± 736.7mg/l and 785.75 ± 544mg/l) respectively might be attributed to dilution along the stream. There was a gradual decrease in the mean values of TSS from stations D to B and B to C. This decrease could be as a result of sedimentation of some of the suspended substances in the effluents discharge as it moves down stream (Haslam, 1990). The values recorded for the four stations was higher than FEPA limit for TSS reported by Odiete (1999). The inverse correlation between TSS and DO at stations B and C suggested that with an increase value of TSS, DO value would decrease. The major components of the effluents are compounds of Ca, SO4, K, NO3 and oxidisable substances (Haslam, 1990). Dissolved oxygen concentration (DO), in natural waters depends on the physical, chemical and biochemical activities in the water body. Mean value of DO recorded for the four stations ranged from 0.000 ± 0.00mg/l and 4.01±1.342mg/l, lower than the FEPA limit of 5.0mg/l as reported by Odiete (1999) and fell within the range of 1.8 – 4.6mg/l of DO reported for polluted waters. The zero value recorded for DO, in stations B and D, might be as a result of organic pollution and high temperature. This is because the rate of deoxygenation depends on dilution that occurs when effluents mixes with the stream, the BOD of the discharge, temperature of the discharge and the streams DO. BOD is frequently a measure of organic pollution. Haslam (1990) reported an approximated range of 650-2200mg/l for abattoir effluents however this study revealed a range of 3450-4102mg/l. The relative higher value for BOD at station D could be attributed to solid concentrations in the plant effluent. The high correlation between BOD and NH3 indicated organic pollution. Temperature is one of the main factors that influence BOD (Manson, 1991). This further confirms the very high correlation between Temp and BOD, in station B above. Chemical oxygen demand (COD) is a measure of the oxygen equivalent of the organic matter content of a sample that is susceptible to oxidation by a strong chemical oxidant (ALPHA/AWWA/WEF, 1992). The high COD values at stations B and C might be as a result of the effluent discharge from station D. Total Hardness (TH) is the sum of total of calcium and magnesium concentrations in water both expressed as CaCO3 in mg/l (Okonkwo, 2000). Duncan Multiple Range Test revealed statistical differences between stations A and D, for TH and Ca (308.97mg/l and 26mg/l respectively). The total hardness in the four sampling stations was above the FEPA range for soft water (0-75mg/l) as reported by Odiete (1999). The water from Alamuyo stream could be termed as hard water. The mean concentration of sulphate (SO42-) in this study ranged between 2.333 ± 0.751mg/l and 15.303 ± 0.389mg/l. This range is below that reported by Atobatele (2000) for Ogunpa River (13 – 59.5mg/l). Soluble nutrients are usually the compounds of nitrogren, phosphate and potassium (Haslam, 1990). Potassium was reported in the four sampling stations with mean values which ranged between 87.67 ± 41.43mg/l (station A) and 375.33 ± 5.175mg/ (station D). Nitrate is the most available form in which nitrogen exists for plants (Hynes, 1970). Mean concentration of nitrate ranged from 0.69 ± 0.221mg/l and 24.13±0.593mg/l (in stations A and D respectively). The decrease in mean concentration of nitrate from stations B to C might be due to dilution and self purification along the stream. At station A, NO3 correlated with CaCO3 (0.999) at p<0.05, these indicated that NO3 existed as compounds of Ca, K and Na in the stream. Agarwal (1991) reported that the concentration of phosphate above 0.5mg/l was an indication of pollution. Stations B and C with 3.69 ± 0.689mg/l and 2.37 ± 0.791mg/l mean concentrations respectively might be regarded as polluted. The difference in mean phosphate concentration in stations A and B could be attributed to discharge of effluents from station D. The mean Ammonia (NH3) concentration of the effluents discharge was 76.14 ± 0.938mg/l; this high concentration increased upstream (Station A, 8.88 ± 1.204mg/l) which was above the index of excellent and acceptable class of water (0.1 – 0.3mg/l). The effluent discharge contained a high concentration of sodium (975±27.54mg/l) and this greatly increased concentration of sodium in the stream because DMRT revealed similarity between stations B, C and D. The mean concentration of Iron (Fe) in the four stations during the study period ranged from 1.127 ± 0.667mg/l and 5.52 ± 0.442mg/l. Manganese (Mn) concentration ranged between 0.97± 0.087mg/l and 0.433 ± 0.092mg/l. This data fell within the range reported by Atobatele (2000) for Ogunpa River. The mean concentration of Zinc (Zn) was between 0.077 ± 0.067mg/l and 0.0307 ± 0.020mg/l at stations A and D respectively. This value is below the Zn concentration reported by Atobatele (2000) for Ogunpa River. The analyses of the effluent discharge and water samples, from the stream, showed that the Abattoir effluents, which were discharged untreated into the Alamuyo stream, have negative impact on the physico-chemical parameters of the stream, which would ultimately affect the distribution and diversity of Biota inhabiting the stream. To avert further harm to the aquatic ecosystem, research efforts should be aimed at by-product recovery and dry clean-up so as to reduce the amount of waste water and the actual volume of wastes released from the Abattoir. REFERENCES
Copyright 2008 - Journal of Applied Science and Environmental Management The following images related to this document are available:Photo images[ja08011f6.jpg] [ja08011f4.jpg] [ja08011f5.jpg] [ja08011f2.jpg] [ja08011f1.jpg] [ja08011f3.jpg] |
| |||||||||
