 |
| About Bioline | All Journals | Testimonials | Membership | News |
|
||||||
|
||||||
Journal of Applied Science and Environmental Management, Vol. 12, No. 1, March, 2008, pp. 87-91 Variability with depth of some physico-chemical and biological parameters of Atlantic Ocean water in part of the coastal area of Nigeria 1Puyate, Y. T.; 2Rim-Rukeh, A. 1Department of Chemical Engineering, Rivers State University of Science and Technology, Port Harcourt,
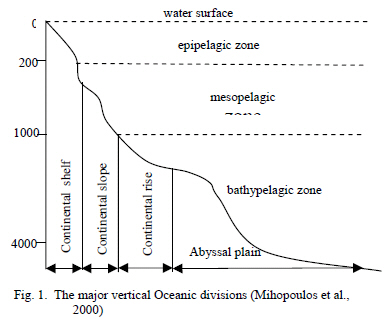
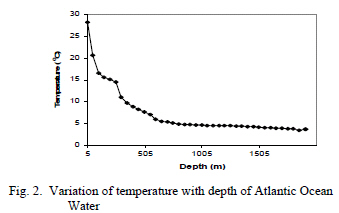
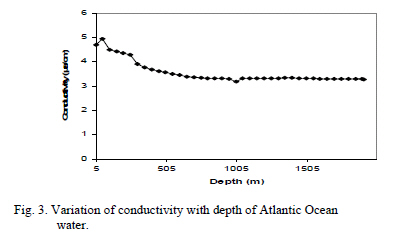
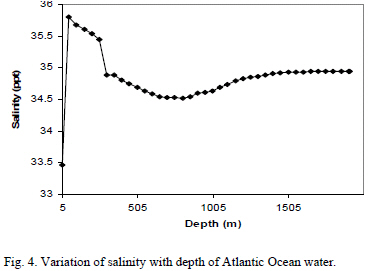
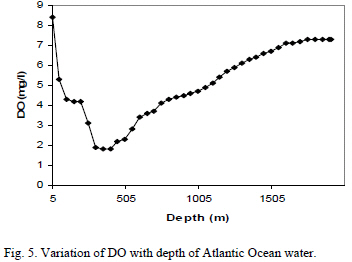
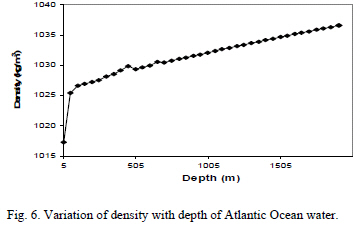
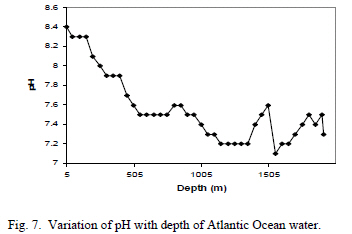
P. M. B. 5080, Port-Harcourt, Nigeria. Code Number: ja08013 ABSTRACT Results of in-situ measurements of some physico-chemical and biological parameters (temperature, electrical conductivity, density, dissolved oxygen, turbidity, pH, and salinity) of Atlantic Ocean water at various depths are presented. It is shown that temperature and dissolved oxygen vary significantly with depth, while variations of the other parameters with depth are minimal. Temperature, dissolved oxygen, electrical conductivity, density, pH, and salinity vary in the ranges: 3.6°C–28.32°C, 1.8mg/l–8.4mg/l, 3 . 29 µ s/cm –4.71 µ s/cm, 1017 .34 kg//m 3 –1036 .61 kg//m 3, 7.1–8.4, and 34.52ppt –35.8ppt respectively. Turbidity is less than 1.0NTU, indicating that the water is clear and transparent. @ JASEM An Ocean is a major continuous body of saline water that is customarily divided into several principal Oceans and smaller seas (Mihopoulos et al., 2000); it is a key component of the earth’s hydrosphere and is defined in part by the continent it is found, various archipelagos, and other criteria (Spilhaus, 1942). The major Oceans in the world are (in descending order of size) the Pacific Ocean, Atlantic Ocean, Indian Ocean, Southern Ocean (which is sometimes regarded as a sum of the southern portions of the Pacific, Atlantic, and Indian Oceans), and the Arctic Ocean which is sometimes considered a sea of the Atlantic (Spilhaus, 1942). Approximately 70% of the Earth’s surface (an area of about 361 million square kilometers) is covered by Ocean (NOS, 1997), with more than half of this area over 3,000m deep (Helmer, 1977). Average Oceanic salinity is around 35 parts per thousand (ppt); Oceans appear blue in colour partly because the sky is blue and primarily because of the ability of water molecules to absorb red photons from the incoming sunlight (Braun and Smirnov, 1993). The temperature of deep Ocean water and heat transfer through the Ocean water vary with latitude, seasons, and sea currents, as well as the mixing process of large water mass (Ocean Sciences, 1964). Oceans are divided conceptually into three main zones depending on their physical and biological characteristics as epipelagic (from the water surface to 200m deep), mesopelagic (from 200m to 1000m deep), and bathypelagic (from 1000m to 6000m deep) as illustrated in Fig 1. The epipelagic zone is the region where the process of photosynthesis most commonly occurs and therefore contains the largest biodiversity in the Ocean. In the mesopelagic zone, light from the surface (though very dim) may still be visible in the clearest of Oceanic water. The bathypelagic zone is beyond the reach of light. Vast populations of Oceanic organisms (fish, squid, shrimp, and benthos) are found within the mesopelagic and bathypelagic zones (Krom et al., 1992; Mihopoulos et al., 2000). The Ocean is a source of life and the major factor in maintaining the oxygen/carbon dioxide balance in the atmosphere; it maintains the stability of the earth's climate; it is a medium for recreational activities, and means of transport between continents. The United Nations designated 1998 as International Year of the Ocean (UN, 1998) with the aim of drawing attention of the world to the indiscriminate use of the Ocean as refuse dump for non-biodegradable substances, old chemical weapons and radioactive materials, and as depository for fertilizers washed off the land (Helmer, 1977; NOS, 1997). It is now globally accepted that Ocean dumping is seriously affecting the water quality of the Ocean (Waldman and Shevah, 1993). For example, climatic models reveal that Oceanic temperatures are increasing which will result to changes in Oceanic stratification, circulation, and convective overturning (Bopp, 1991). Such changes have the potential to affect all Ocean biogeochemical cycles, Ocean productivity, and the structure of the ecosystem (Garcon et al., 1991). There is, therefore, the need to carry out pysicochemical and biological studies of the Ocean water in order to assess its quality in relation to pollution practices and other environmental activities that are vulnerable to the Ocean ecology. In this study, we present data describing the variation with depth of some physico-chemical and biological parameters of the Atlantic Ocean water in part of the coastal area of Nigeria. STUDY AREA The study area within the Atlantic Ocean is located about 140km from the shoreline and is about 245km from Port Harcourt and 250km from Warri both by air. The area covers 1700km2 and lies within Nigerian’s 200 nautical mile of Exclusive Economic Zone (EEZ), and within the geographical coordinates 33396.01N – 365648.86N and 733987.54E – 787384.00E in the ultra deep offshore of the Western Niger Delta area of Nigeria (NAE, 2005). Adopting the Nigerian National Petroleum Corporation (NNPC) oil bloc classification of oil/gas reserves, the area is within the oil prospecting lease, OPL 244 (NAE, 2005). Experimental procedure The materials used in the study are Atlantic Ocean water, R/V Geoexplorer (a specialized research vessel), and differential global positioning system (DGPS). Four (4) sampling points were established within the study area of the Atlantic Ocean. A seacat water profiler (SWP) was used to carry out in-situ measurement of temperature, salinity, dissolved oxygen, density, electrical conductivity, turbidity, and pH, of the Ocean water at each sampling point. The seacat water profiler was programmed to first of all measure each parameter at a depth of 5m from the water surface, and thereafter at every 50m interval till the bottom of the Ocean (i.e. Ocean bed). On completion of profiling and uploading of the data obtained from a given sampling point, the data were erased from the computer internal memory before preparing the SWP for the next sampling point. Erasing measured data of a given sampling point from the computer memory is necessary to avoid mixing-up old data with new data from other sampling points. RESULTS AND DISCUSSION The hydrographic temperatures profile of the Atlantic Ocean water in the study area is shown in Fig 2, and the value 28.32oC obtained at a depth of 5m from the water surface lies within the range 28°C – 32°C for tropical surface Ocean waters (Wickstead, 1965). The Atlantic Ocean water is relatively warm between 5m and 50m depth with a temperature range from 20.63°C to 28.32°C. The temperature drops rapidly from 20.63°C at 50m depth to about 4.6oC at 1000m, and then maintained at an average value of 3.6oC till the Ocean bed. The observed temperature trend (region of rapid temperature decline and thermocline) is typical of Ocean waters and is also responsible for the stratification in the distribution of marine life as it affects the hydrological properties of seawater (Ocean Sciences, 1964; Kings, 1975). Atlantic Ocean water is relatively warm between 5m and 50m depth with a temperature range from 20.63°C to 28.32°C. The temperature drops rapidly from 20.63°C at 50m depth to about 4.6°C at 1000m, and then maintained at an average value of 3.6°C till the Ocean bed. The observed temperature trend (region of rapid temperature decline and thermocline) is typical of Ocean waters and is also responsible for the stratification in the distribution of marine life as it affects the hydrological properties of seawater (Ocean Sciences, 1964; Kings, 1975). Ocean waters, like all aquatic media, have the ability to carry electric current. This characteristics is a result of the presence of ions in Ocean water and depends on the temperature of water at the point of measurement, total concentration of ions, ionic mobility, and valence (Falkland and Woodroffe, 1997). Ocean water conductivity is, therefore, a measure of the ability of the water to carry electric current. The hydrographic profile for electrical conductivity of the Atlantic Ocean water in the study area is presented in Fig 3. It may be seen from Fig 3 that the conductivity of the Ocean water increases gradually from 4 .71 μ s/cm at 5m depth to 4 . 96 μ s/cm at 50m depth; thereafter, the conductivity decreases gradually with depth to about 3 . 34 μ s/cm at 750m, and then maintained at a fairly constant value of about 3 . 32 μ s/cm till the bottom of the Ocean. Salinity is a measure of the amount of dissolved salts in a liquid, which for Ocean water is expressed as a ratio of the amount of dissolved salts to the quantity of Ocean water considered. The importance of salinity in marine ecosystems is evident in the relative diversity and abundance of marine organisms in Ocean salt water compared to fresh water. In the open Ocean, salinity normally varies between 33ppt and 37 ppt with a mean value of 35 ppt (Strickland and Parsons, 1968). completion of profiling and uploading of the data obtained from a given sampling point, the data were erased from the computer internal memory before preparing the SWP for the next sampling point. Erasing measured data of a given sampling point from the computer memory is necessary to avoid mixing-up old data with new data from other sampling points. RESULTS AND DISCUSSION The hydrographic temperatures profile of the Atlantic Ocean water in the study area is shown in Fig 2, and the value 28.32oC obtained at a depth of 5m from the water surface lies within the range 28°C – 32°C for tropical surface Ocean waters (Wickstead, 1965). The Atlantic Ocean water is relatively warm between 5m and 50m depth with a temperature range from 20.63°C to 28.32°C. The temperature drops rapidly from 20.63°C at 50m depth to about 4.6°C at 1000m, and then maintained at an average value of 3.6°C till the Ocean bed. The observed temperature trend (region of rapid temperature decline and thermocline) is typical of Ocean waters and is also responsible for the stratification in the distribution of marine life as it affects the hydrological properties of seawater (Ocean Sciences, 1964; Kings, 1975). Ocean waters, like all aquatic media, have the ability to carry electric current. This characteristics is a result of the presence of ions in Ocean water and depends on the temperature of water at the point of measurement, total concentration of ions, ionic mobility, and valence (Falkland and Woodroffe, 1997). Ocean water conductivity is, therefore, a measure of the ability of the water to carry electric current. The hydrographic profile for electrical conductivity of the Atlantic Ocean water in the study area is presented in Fig 3. It may be seen from Fig 3 that the conductivity of the Ocean water increases gradually from 4 .71 μ s/cm at 5m depth to 4 . 96 μ s/cm at 50m depth; thereafter, the conductivity decreases gradually with depth to about 3 . 34 μ s/cm at 750m, and then maintained at a fairly constant value of about 3 . 32 μ s/cm till the bottom of the Ocean. Salinity is a measure of the amount of dissolved salts in a liquid, which for Ocean water is expressed as a ratio of the amount of dissolved salts to the quantity of Ocean water considered. The importance of salinity in marine ecosystems is evident in the relative diversity and abundance of marine organisms in Ocean salt water compared to fresh water. In the open Ocean, salinity normally varies between 33ppt and 37 ppt with a mean value of 35 ppt (Strickland and Parsons, 1968). Figure 4 shows the variation of salinity with depth of the Atlantic Ocean water in the study area, indicating that salinity increases rapidly from 33.47ppt at 5m depth to 35.8ppt at 50m depth, and then decreases with depth to a value of 34.52ppt at 800m. Thereafter, the salinity increases gradually with depth to a value of 34.93ppt at 1500m, beyond which the salinity is constant at 34.95ppt till the Ocean floor. The observed variation of salinity of the Atlantic Ocean water with depth (i.e. in the range 33.47ppt– 35.8ppt) is consistent with the literature (Kings, 1975; Strickland and Parsons, 1968). The amount of gaseous oxygen dissolved in water is referred to as its dissolved oxygen (DO) level. It is an important parameter in aquatic life as it is required for metabolism of aerobic organisms and also influences inorganic chemical reactions. Oxygen is naturally present in Ocean water but it is removed from the sub-surface water by respiration of sinking organic matter. An equilibrium exists in the gas-exchange process between near-surface water and the atmosphere, whereas sub-surface oxygen removal is balanced by transport of oxygen-rich surface water to the interior water body. The consequence is that subsurface oxygen concentration and the overall partitioning of oxygen between the atmosphere and the Ocean are sensitive to the rate of surface-to-deep Ocean circulation and mixing, biological production of oxygen, as well as temperature and salinity of the Ocean water (Emerson and Abell, 2001; Keller et al, 2002). The DO–depth profile of the Atlantic Ocean water in the study area is presented in Fig 5. It is obvious from Fig 5 that DO decreases with depth from a value of 8.4mg/L at 5m depth to 1.8mg/L at 350m depth. The high DO level near the water surface is due to the presence of phytoplanktons that release oxygen during photosynthesis (Carignan et al., 2000). The intensity of sunlight in a water body (like the Ocean) decreases with depth so that photosynthetic activities of phytoplanktons decrease with depth. This condition prevails between zero and about 350m depth as may be seen from Fig 5. Beyond 350m depth, the DO level increases gradually with depth until it reaches a value of 7.3mg/L at 1750m depth and remains constant at this value till the Ocean bed. The rise in oxygen level at greater depths was attributed by Wickstead (1965) to the input of cold dense oxygenated water sinking in Polar Regions. It is also suggested that the distribution process of gases at deeper levels of the sea is mainly by currents and turbulent mixing rather than by diffusion (Wickstead, 1965; UNEP, 1989; Schoonmaker et al., 1985). However, the overall DO trend observed in Fig 5 may be better explained by the variation of DO with temperature and pressure coupled with the activities of phytoplanktons as follows. Generally, DO level in water increases as the pressure in the water increases or as the temperature of the water decreases (Hach et al., 1992). Thus the DO level in Ocean water would increase with depth since the pressure in a water body increases with depth while the temperature of the water body decreases with depth. This theory is not obeyed between zero and about 350m depth, indicating that the activities of phytoplanktons dominate within 0– 350m depth where the quantity of oxygen generated by phytoplanktons is much greater than that due to DO–temperature–pressure relationship. At about 350m depth, equilibrium exists between the quantity of oxygen produced by phytoplanktons and the oxygen resulting from DO–temperature–pressure relationship. Beyond 350m depth, the contribution of phytoplanktons to the DO level in the Ocean water of the study area is minimal and the DO level between 350m and the Ocean bed is dominated by the dual effect of temperature and pressure of the water. The high DO level near the Ocean bed (which is close to that within 5m depth) is a natural necessity for sustenance of benthic/bottom-dwelling organisms in deep Ocean water (Krom et al., 1992), and also indicates the presence of great deal of life near the Ocean bed as it is near the water surface. Figure 6 shows the variation of density with depth of the Atlantic Ocean water in the study area. It may be seen from Figure 6 that the density of the Ocean water increases rapidly between 5m and 50m depth, and then increases steadily with depth until the Ocean bed. The density of Ocean water is higher than the density of pure water (1000kg/m3 ) due to the presence of salt in Ocean water. It is well known that the pressure in a liquid increases with depth. For gases that obey the Ideal Gas Law, pressure can be expressed in terms of density, and the density of the gas is inversely proportional to its temperature. The inverse relationship between density and temperature also applies to liquid but the effect is minimal since the volume of a liquid varies only slightly with temperature and pressure (Rajput, 2004). Thus, the steady increases in density of the Ocean water with depth may be attributed to the decrease in temperature of water with depth (see Figure 2). It is also obvious from Figure 6 that the variation of density of Atlantic Ocean water in the study area with depth is small (i.e. a maximum of about 4% increase), which is consistent with the minimal effect of temperature on the density of a liquid. The Ocean water can also be divided in terms of density into three zones as surface-mixed zone, transition zone, and deep zone, with the deep zone occupying about 80% of the entire Ocean depth (Craig, 1997). The range of depth for each zone depends on the water body considered and in the present analysis as may be seen from Figure 6, the surface-mixed zone corresponds to (0 – 100m depth), transition zone (100 – 500m depth), and deep zone (500 – 1900m depth). Ocean turbidity is a measure of the amount of cloudiness or haziness in the water body caused by particles that are too small to be seen without magnification. Turbidity in Ocean water results from waste discharge, as well as wave and current actions. Turbidity may interfere with light penetration and photosynthetic reactions (Canter and Hill, 1977). The turbidity level of the Atlantic Ocean water in the study area is below equipment detection limit of 1.00 NTU, indicating that the water is clear and permits maximum light penetration for photosynthetic activity in the euphotic (epipelagic) zone. Ocean water pH provides insight into its hydrogen ion activity and is used widely as indicator of the alkalinity and acidity of a medium. pH is critical in the aquatic ecosystem because it affects the functions of virtually all enzymes, hormones, and other proteins of the body that control metabolism. The pH of the Atlantic Ocean water in the study area ranges from 7.1 to 8.0 (see Figure 7), indicating an alkaline environment which is consistent with values for tropical Ocean water (Keily, 1998) and values obtained from similar environmental offshore studies in Nigeria (STAR, 2003; Conoco, 2004). The inflexions in sections of Figs 2 and 7 may be attributed to Ocean turbulence/mixing effect by wind (Appelo and Postma, 2005). Note that all values of the parameters in Figs 2 and 7 are measured with an error of ± 0 . 001 , and the value at a specified depth represents the mean of four different readings at the same depth. Conclusion Physico-chemical and biological analyses of the Atlantic Ocean water at various depths have been presented. It is shown that temperature of the water and dissolved oxygen vary significantly with depth, while variations of electrical conductivity, density, salinity, and pH, with depth are minimal. The turbidity of the Ocean water is less than 1.0NTU, indicating that the water is clear and transparent. REFERENCES
Copyright 2008 - Journal of Applied Science and Environmental Management The following images related to this document are available:Photo images[ja08013f1.jpg] [ja08013f7.jpg] [ja08013f6.jpg] [ja08013f4.jpg] [ja08013f3.jpg] [ja08013f2.jpg] [ja08013f5.jpg] |
| |||||||||
