 |
| About Bioline | All Journals | Testimonials | Membership | News |
|
||||||
|
||||||
Determination of vehicular pollution in the road tunnel of Vana (Haraz Road) in the North of Iran Mohammad Ali Zazouli. 2Abbass Nattaj Jolodar, 3M Hoseinei 1Department of Environmental Health, School of Public Health , Mazandaran University of Medical Sciences, Sari, Iran Code Number: ja08018 ABSTRACT The combustion of fuels (gasoline, LPG, diesel oil, and so on ...) in vehicle engines produces a lot of substances and gases. Depending on their concentration, their chemical stability and their adverse effects on environment and human being, the most relevant compounds in the exhaust gas are SO2, CO, NOx, H2S and O3. Traffic is the source of pollution in a road tunnel, It has a harmful impact on Human health .The aim of the study is to analyze the amount of atmospheric pollution emitted by vehicular traffic in the road tunnel of Vana which is situated between the provinces of Tehran and Mazandaran in Iran. The geometric characteristics of the tunnel are: the length (1500 m, the longest tunnel), the height (5.5 m) and the mean slope (3%). It is placed in Haraz road, a geographical situation by the length of 35° 56.6` 42.4`` and the width of 52° 15.28` 33.7``.Traffic is undoubtedly one of the important sources of environmental and air pollution. The concentration of pollutants was measured by Babucr A (a portable device with several sensors) in the nine stations in tunnel. Concentrations were measured after diesels and gasoline car traffic in moment , statistical and within a period of one hour and 8 hours .The results showed that SO2 , CO, NO, H2 S and O3 were 0.47, 57.13, 3.58, 1.2and 0.13 ppm respectively, within a period of 8 hours. And also the difference of monthly results was lower than 1.5%. @ JASEM Sources of air pollution are either man made or natural. Man-made sources are what we focus on because we may be able to affect some control of these sources. Both gaseous and particulate sources are troublesome. We have set standards for concentrations for both these materials in the atmosphere and in emission from chimneys for those sources we have recognized to be harmful. (Schnelle & Brown., 2002).one of the important sources of air pollution is vehicles or traffic, especially in road tunnels (Mohseni Bandpei et al., 2003). Traffic-related air pollution is associated with adverse respiratory effects. The road tunnel exposures included particulate matter, SO2, CO, NOx, H2S and O3 (Larsson et al., 2007). When these pollutants were mixed with our environment, have adverse effects on human health. For example, CO gas is mixed with blood Hemoglobin and causes problems in breathing and giving oxygen to tissues. Therefore ,their sources must control. The special places such as road tunnels aggravate the environment dangerous by exhaust gases. Traffic is the source of pollution in a road tunnel; it has a harmful impact on Human health. The most relevant compounds in the exhaust gas are SO2, CO, NOx, H2S and O3. Building road tunnels is today a manner of responding to the unavoidable problem of the ever increasing traffic volumes in densely populated areas and mountain roads. Besides the psychological and stress aspects, driving through tunnels adds new problems to the ones already created by traffic on open roads. The important problems concerned include air pollution with subsequent possible health hazards و reduced visibility that causes higher accident rates and etc .In the context of creating a healthy and safe environment in tunnels, one has to maintain a high standard air quality and reduce as much as possible all potential hazards by carefully designing the tunnel management system especially pollutants control. Larsson and et al investigated whether exposure to air pollution in a road tunnel causes airway inflammatory and blood coagulation responses. They showed that exposure of healthy subjects to traffic-related air pollution resulted in a lower airway inflammatory response with cell migration, together with signs of an initiated signal transduction in the bronchial epithelium (Larsson et al., 2007).and also Svartengren and et al assessed Short-term exposure to air pollution in a road tunnel enhances the asthmatic response to allergen and concluded that exposure to air pollution in road tunnels may significantly enhance asthmatic reactions to subsequently inhaled allergens(Svartengren et al.,2000). There are several methods for control these pollutants. Among the different process and methods of controlling and removing air pollutants, mechanical-natural and biological methods are considered. According to the experiment, the highest efficiency of gas removing (CO) of inside the tunnel is biological method such as trickling filter. Road tunnel of Vana is the longest tunnel in Haraz road which is situated between the provinces of Tehran and Mazandaran in Iran. The geometric characteristics of the tunnel are: the length (more than 1500 m), the height (5.5 m) and the mean slope (3%). It is placed in Haraz road, a geographical situation by the length of 35° 56.6` 42.4`` and the width of 52° 15.28` 33.7``.Therefore, the aim of the study is to analyze the amount of atmospheric pollution emitted by vehicular traffic in the road tunnel of Vana MATERIALS AND METHODS This study has been conducted in the environmental laboratory of civil faculty of Mazandaran University in early 2006. The sampling xperiment was carried out from 7:00 a.m. to 17:00 p.m. Each sampling that sampled the concentrations inside the tunnel lasted for 60 min. A portable devices, named Babucr model A, used for measuring the above mentioned pollutants .this device made in LSI-lastem with the technical characteristic as following:
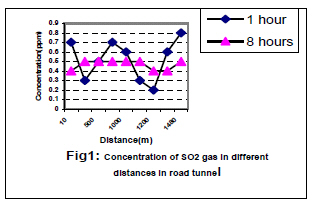
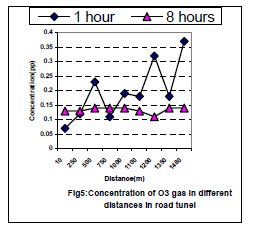
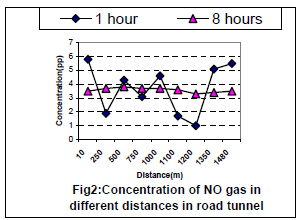
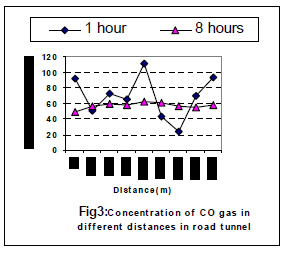
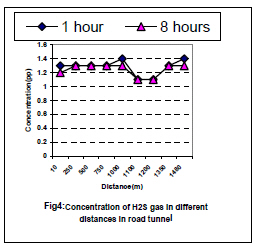
It had five sensors such as SO2, NO, CO, O3 and H2S sensors that can measure 0-20, 0-100, 0-1000, 0-3 and 0-50 ppm these pollutants respectively. At first.9 sampling stations chose in the suitable distances in road tunnel. After calibration of device, measurement of gases began .Calibration was done by using kits, pre-fabricated as capsules with pollutant gases. These kits classified in E, D, C, B, A, and F groups and was used each for special analysis. It is obvious that the environmental sensor has acceptable results after calibration we have the result of gas measuring in 9 stations in the related as tunnel follow. Concentrations were measured after diesels and gasoline car traffic in moment, statistical and within a period of one hour and 8 hours. Sampling was conducted three times. RESULTS AND DISCUSION Fig 1 to 5 present the results of concentration measurement of air pollutants in the nine stations in tunnel. As shown in Fig 1. ,the concentration of SO2 ranged from 0.2 to 0.8 ppm and 0.4 to 0.5ppm for within a period of 1 & 8 hours respectively. The results of Table 1 indicated that the average concentration of SO2 was 0.52 and 0.47 ppm for within a period of 1 & 8 hours respectively. As shown in Fig 2. ,the concentration of NO ranged from 1 to 5.8 ppm and 3.3 to 3.8 ppm for within a period of 1 & 8 hours respectively. The results of Table 1 indicated that the average concentration of NO was 3.67 and 3.58 ppm for within a period of 1 & 8 hours respectively. The data presented in Fig 3 show that the concentration of CO ranged from 23.6 to 111.4 ppm and from 48.5 to 62.7 ppm for within a period of 1 & 8 hours respectively. But the average concentration of CO was 68.96 and 57.13 ppm within a period of 1 & 8 hours respectively. As shown in Fig 4., the concentration of H2S ranged from 1.1 to 1.4 ppm and 1.1 to 1.3 ppm for one and eight hours respectively The results of Table 1 indicated that the average concentration of NO was 1.3 and 1.2 ppm for one and eight hours respectively. The concentration of O3 ranged from 0.07 to 0.37 ppm and 0.11 to 0.13 ppm for one and eight hours respectively (Fig 5) The results of Table 1 indicated that the average concentration of O3 was 0.2 and 0.13 ppm for one and eight hours respectively. Table 1: The average concentration of the pollutants in Vana tunnel
Unfortunately, there is not any standard of air quality for tunnel structures in Iran. So, the above results compared to the results of other studies that conducted in other country. The information obtained from this survey can be employed in the design of the control technique and management strategies for Air pollutants in road tunnels. It should be mentioned that further work should be conducted to monitor on the quantity and quality of air pollutants in this and other road tunnels. And also Tunnel ventilation systems must install for reducing of pollutants. Finally, Traffic is undoubtedly one of the important sources of environmental and air pollution. It does not only have a harmful impact on health but also indirectly debases quality of life by disturbing the eco-system, destroying our urbanistic and cultural inheritance, and so on. Despite all efforts and all kinds of recommendations to reduce, specially in large cities, both traffic flow and one of its first nuisances, i.e. the pollutant emissions, it may be expected for the next few decades that Traffic will remain an important source of pollution. Therefore a lot of money has been invested in installing monitoring equipment, developing data transmission networks and building supervision centers. Acknowledgements: We thank the Environmental Protection Administration of Mazandaran and Freeway Administration of Mazandaran for helping this study and experiment successfully. REFERENCES:
Copyright 2008 - Journal of Applied Science and Environmental Management The following images related to this document are available:Photo images[ja08018f5.jpg] [ja08018t1.jpg] [ja08018f1.jpg] [ja08018f3.jpg] [ja08018f4.jpg] [ja08018f2.jpg] |
| |||||||||
