 |
| About Bioline | All Journals | Testimonials | Membership | News |
|
||||||
|
||||||
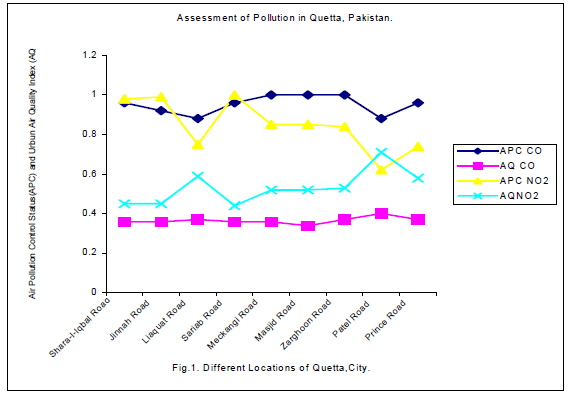
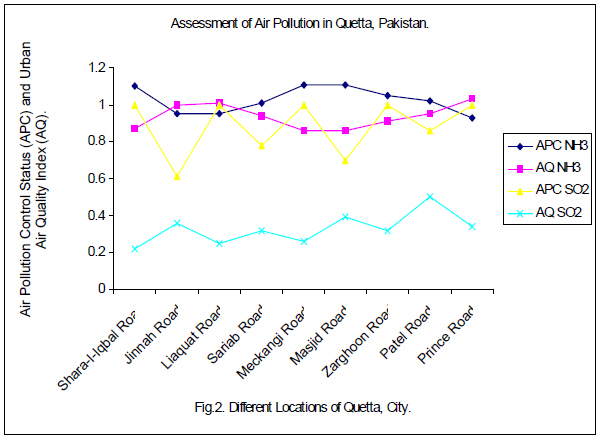
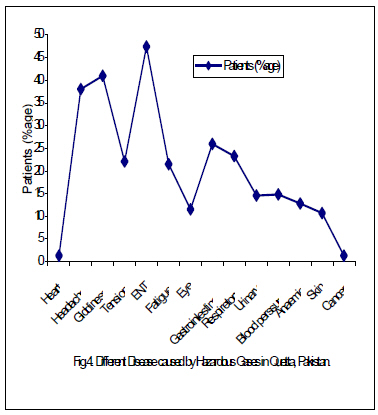
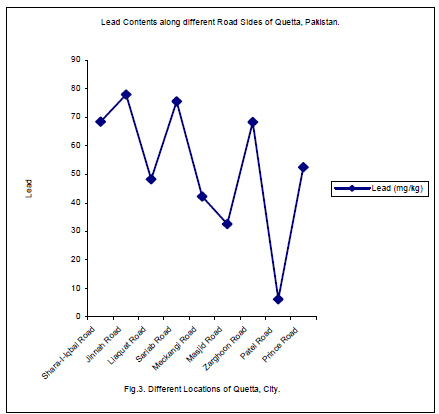
Air Pollution Problems and Diseases Caused by Hazardous Gases in Quetta, Pakistan *Syed Zafar Ilyas; Nasir, S M; Raza, S M Group of Renewable Energy and Environment, Department of Physics, University Of Balochistan, Quetta, Pakistan E-mail:szilyas@yahoo.com Email:szilyas@Hotmail.com Code Number: ja08019 ABSTRACT Nowadays air over major cities throughout the world has become over burdened with gases produced by automobiles. The death rate due to automobiles pollution is increasing rapidly in the metropolitan areas. With passage of time people realized that polluted air had serious effects on their health, climate and economics. Weather and climate have the integrated impact on human activities which are resulting in worldwide concentration of the particulate of environmental pollution viz. chloroflorocarbons (CFCs), carbon dioxide, methane, nitrogen oxide, lead and several other dust and gaseous particles. The present study is an attempt to exploit air problems and diseases caused by the lead, CO, NH3,NO2 and SO2 of the Quetta city. Data at different locations recorded for the pollutants,.i.e., CO, NH3,NO2, Pb and SO2 for a period of two months have been analyzed by two indices ,.i.e. air pollution control status index (APC-Status index) , urban air quality index (Urban AQ index) and the determination of Pb (lead) emitted from vehicle at roadside in Quetta city was analyzed for two months without any interval at nine different stations. We conclude from our results that blood pressure, ENT (eye, nose and throat), fatigue, gastrointestinal, diseases and cancer were highly correlated with lead distribution. We also conclude that the motor vehicles/ automobiles now constitute the main source of air pollution. The coal burning, kiln backing in furnaces and natural gas burning are the other sources of air pollution. @JASEM The continuous and rapid growth in population (Khan, 9-11 September, 1986 and Syed, 2005), urbanization, industrialization and transportation (Zaman, 1985) in the city of Quetta in recent years has caused tremendous damage to the environment. The most likely major sources of atmospheric lead pollution in the city are traffic emission and industrial (Quinn , 1985). Iron mill ( these use scrap iron from ships which is coated with lead), municipal wastes, contaminated food and the use of insecticides. Other sources include lead smelters, paints, solder, water pipes, storage batteries cause adverse effects and typesetting (Hutton and Symon ., 1986). The air quality index provides the actual degree of pollution (Abu ,1993). The air pollution control system index represents the monitoring capability in cities (Daniel, 1988). These indices of urban air pollution show a relative scale of assessing air pollutants. The composition of a clean atmosphere, in terms of parts per million (ppm) is categorized into three components (Murely. 1991)],.i.e., trace components (ammonia; 0.01 ppm, carbon monoxide: 0.12 ppm, nitrogen dioxide: 325 ppm, etc.) and major components and minor components (argon: 9340 ppm, carbon dioxide: 325 ppm, etc.) and major components (nitrogen: 78.09E+4 ppm, oxygen: 20.94E+4 ppm, water vapors: 1000-50,000 ppm, etc.). Moreover, the world health organization (WHO) recommended air quality in parts per million (World Health Organization, Nairobi, 1988, and Abdul Razzaque Memon, 1993) studied urban air pollution problems in metropolitan cities of the world. We followed in this manuscript, the same procedures of calculations (Abdul Razzaque Memor ,1993) but there are certain anomalies pertaining to population indices, i.e., population control growth index: PGX, population / area ratio index: APC andurban air quality index which are not considered perhaps due to inadequate data. For carbon monoxide CO, NH3,NO2 and SO2 , we considered 9 ppm as WHO ambient air quality standards. In general it has been found that the average of lead contents present over urban area is ten times greater than rural areas and that the degree of pollution increases with city size. These particles besides creating haze, may also act as condensation nuclei and thereby encourage fog and smog formation which is unpleasant and causes eye irritation , E.N.T. and respiratory problems (Goudie, 1993). In this study the deposited and absorbed lead is estimated on the roadside of Quetta city. METHODOLOGY Nine main roads of Quetta city were selected for the study which included, Shara – I- Iqbal Road, Jinnah Road, Liaquat Road, Sariab Road, Meckangi Road, Masjid Road, Zarghoon Road, Patel Road and Prince Road.. Five thousand peoples using these roads were randomly selected. They were asked to fill out a questionnaire about their health. The percentages of the number of patients of the diseases, anaemia, headache, blood pressure, cancer, E.N.T., eye fatigue, gastrointestinal, giddiness, heart, respiratory, skin and urinary disease were determined. RESULTS, DISCUSSIONS AND CONCLUSIONS Figures 1 and 3 represent APC and AQ indices for CO, NH3 ,NO2 and SO2 level concentration of ammonia and nitrogen dioxide pollutants in parts per million at various locations in Quetta city. Both these tables also indicate temperature ranges,.i.e., minimum and maximum in Celsius at various locations in Quetta. All the indices take the values between the minimum of zero to the maximum of one and are isodirectional. The values close to zero represent worst situations and the values near one represent the best situations. The fraction value of index multiplied by hundred gives the percentage of the effects and the remaining part in percentage to represents the extra attention and efforts needed for the improvement of the situation. This is very much true for both APC and AQ indices of CO, NH3, NO2 and SO2 levels. However, one can say from quantitative analysis that the pollutants of various kinds (World Health Organization, Nairobi ,1988) are affecting Quetta city badly (Fig 1). This reflects that the motor vehicles/ automobiles now constitute the main source of air pollution in Quetta city and home industries, power plants and biological contents in Quetta city are the dominant sources of air pollution (Fig 2). High concentration of lead was found on Jinnah these roads caused air pollution. Lead content found Road, Zarghoon Road Sariab Road and Shara-I-Iqbal, were lower than that reported by Healy and Aslam which are the busiest roads of Quetta City ( Figure-(Healy and Aslam ,1980) from roadsides dust i.e., 3), the highest beings 78mg/kg on Jinnah Road, 210mg/kg. The patients (%) of different diseases which confirms that maximum automobile traffic on caused by hazardous gases in Quetta Pakistan (Fig 4). The lead and sulphur dioxide pollutants in Quetta are pronounced as compared to other pollutants (Figs 2 and 3). The permissible limit as recommended by WHO leads to seriousness of polluted environment of the city in question and requires proper attention provided there is an adequate monitoring of data for each kind of pollutants and surveillance according to recommendation of EPA (Environmental Protection Agency) . Needless to mention, the ambient air quality standard for each pollutant can differ from WHO standard (World Health Organization regional publication 2000 and World Health Organization, Nairobi, 1988) from view point of weather and climatological changes occurring at various locations of world. The nitrogen cycle and the photosynthesis process responsible to maintain natural equilibrium could be severely affected in general by greenhouse effects, and in particular, by ozone. Acknowledgement: I am very much thankful to the Higher Education Commission, Islamabad, Pakistan, for providing me research funds. REFERENCES
Copyright 2008 - Journal of Applied Science and Environmental Management The following images related to this document are available:Photo images[ja08019f4.jpg] [ja08019f3.jpg] [ja08019f1.jpg] [ja08019f2.jpg] |
| |||||||||
