 |
| About Bioline | All Journals | Testimonials | Membership | News |
|
||||||
|
||||||
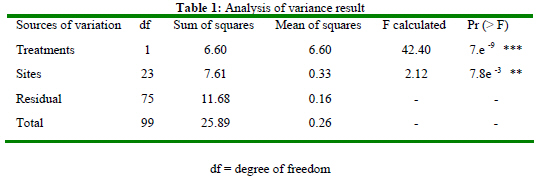
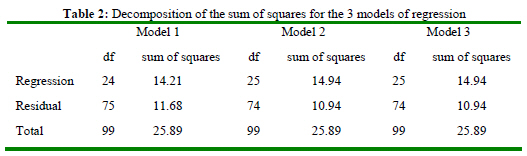
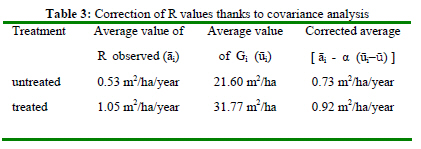
Journal of Applied Science and Environmental Management, Vol. 12, No. 1, March, 2008, pp. 127-131 The Use of Covariance Analysis to Improve a Forestry Experimentation Precision Zobi, I.C. Institut National Polytechnique Houphouët Boigny (INPHB), Département Eaux, Forêts et Environnement (FOREN), B.P. 2661, Yamoussoukro, Côte d'Ivoire. / iriezobi@yahoo.com Code Number: ja08020 ABSTRACT The effect of a thinning method on a tropical forest dynamics was examined using an experimental approach. This method is closed to forestry economy and it consists in eliminating non commercial species trees in order to increase the ingrowth rate of the whole commercial ones. This paper shows how a statistical technique, covariance analysis, can be used to cure an insufficiency of the experimental material. This insufficiency results here in inequality between initial total basal area of the treated quadrats and that of the untreated quadrats. The profit of precision is 1.054. It provided the following estimates of the increase rate in basal area of the commercial species: 0.73 and 0.92 m2/ha/year respectively for the treated quadrats and the untreated quadrats. When initial total basal area of the quadrats is not regarded as an auxiliary variable, the equivalent values are 0.53 and 1.05 m2/ha/year. @ JASEM Since sustainable thinning of tropical forest ecosystem became a main international subject and the environmental certification concept has been created, Ivorian’s researchers has sooner been testing new silvicultural techniques satisfying to industrial demands without damaging environment (Zobi, 2002). Then, researchers experimented with a thinning method (Balboa-Murias et al., 2006; Utsugi et al., 2006) closed to forestry economy because it consists in eliminating non commercial species trees in order to increase the ingrowth rate of the whole commercial ones. Thus, the assumption that thinning stimulates the dynamics of trees growth was proved via inventory in time and space (Blanco et al., 2006; Jaakkola et al., 2006; Kanninen et al., 2004; Chave, 2000). Since 1978, SODEFOR (Société de Développement des Forêts) decided to consolidate this assumption by the experiment through the creation of three permanent devices. The principal purpose of this experiment is to check if non commercial species (secondary species) elimination can draw a positive effect on commercial species (principal species) growth. The aim of this paper is to examine the possibility of a statistical method, covariance analysis (Dahdouh-Guebas and Koedam, 2006; Headley et al., 2005), to overcome the insufficiency of the experimental material resulting in a skew on the evaluation of a forestry treatment effect. MATERIALS AND METHODS EXPERIMENTAL MATERIAL AND DATA-GATHERING The experimental design of Mopri was installed in the classified forest of Mopri which covers a surface of 33000 ha. This field is located between 5°40 ' and 5°55 ' of northern- latitude, and 4°52 ' and 5°02 ' of western-longitude (Vennetier et Laclavere, 1983). It is characteristic of the semi-deciduous rainforest with a mean annual rainfall of 1138 mm. The soils are of ferralitic type and the relief, accidented, presents a weak slope directed from west to east (Roose, 1981). The experimental design is a 3000 m side square or a total surface of 900 ha. But the test is operated to the central square whose surface is 400 ha. This one was subdivided in 25 pieces of 16 ha each. Each piece includes two distinct parts: a buffer zone and a central part of 4 ha, consisted of 4 unit quadrats of 1ha. Among the design 25 pieces, 15 were chosen randomly, and were thinned out. The 10 others pieces have not been treated; they constitute the untreated quadrats. Only the large trees of secondary species were eliminated. The observations and measurements were made in the quadrats. Only the trees whose diameter at 1.30 m of the ground is superior or equal to 10 cm were taken into account. They were classified according to their economic importance: principal species, and secondary species. The diameter of principal species trees was measured. Their coordinates (x, y), and scientist and commercial names were determined. Contrary to the principal trees, the precision on the diameter of the secondary trees was approximate: they were simply grouped by class of diameter. Measurements were drawn every 2 years. The data analyzed in this paper are from the first years, 1978 to 1998. The proportion of basal area eliminated corresponds to the rate of thinning. This rate expresses the thinning intensity; and it represents the degree of stress undergone by the forest stand. One distinguished mean thinning T1 (25 to 35%) and higher thinning T2 (36 to 50%). For the untreated quadrats, total basal area before thinning (Gi) corresponds to total basal area after thinning (Gr). PRINCIPLE OF COVARIANCE ANALYSIS The principle of covariance analysis is based on the comparison of several regression models (Aznar and Guijarro, 2007; Inglot and Ledwina, 2006; Pines et al., 1992; Dagnélie, 1998; Mead, 1988). The goal of a regression model is to explain a quantitative variable (increase rate in principal species basal area – R) by means of qualitative variables (such as thinning, site), and (or) quantitative variable (such as initial total basal area – Gi). The models that covariance analysis compares are of three types: Model 1 explains the R by means of qualitative variables "treatment" and "site". It is a two-ways analysis of variance model. In mathematical form, it is stated as follows: aij = m + ti + bj + eij (1) aij = R of the quadrat having received treatment i on the site j m = R average run with the whole quadrats ti = Effect of treatment i (treated and untreated) bj = Effect of the site j (quadrat) eij = experimental error Model 2 explains R by means of two qualitative variables "treatment" and "site", and a quantitative variable Gi. It is a model of covariance analysis with only one covariable. It is expressed as follows: aij = m + ti + bj + α (uij –ū) + eij (2) uij = Gi of the quadrat having received treatment i on the site j ū = Gi average with the whole quadrats. α = Linear regression coefficient of R (aij ) in Gi (uij). Model 3 explains R by means of the qualitative variable "site" and the quantitative variable Gi. In mathematical form, it is written: aij = m + bj + α (uij –ū) + eij (3) RESULTS AND DISCUSSION RESULTS Firstly, a classical analysis of variance of data concerning increase in basal area in the treated and untreated quadrats was operated. The result is summarised in table 1. The F test (table 1) points out a highly significant effect of the site, and an effect very highly significant of the forestry treatment on the increase rate (R). This result implies that there is a significant difference between R values in the treated quadrats (1.05 m2/ha/year) and those of the untreated ones (0.53 m2/ha/year). The intensity of the treatments, T1 and T2, enables to formulate two independent comparisons (treated–untreated, and T1–T2) and to apply the contrasts method. We also establish that the difference observed between the treatments, is principally due to the difference between the treated quadrats and the untreated quadrats, and to a less degree, that the T2 treatment is superior to T1 one. However, the high value of the variation coefficient (100× 0.16 ÷ 0.84 = 47.6% ) draw some questions about the validity of these conclusions; because a high value of this variation coefficient indicates that some significant sources of variation between both groups of quadrats have not been taken into account in calculations. Therefore, it is interesting to take into account the site characteristics, their effect remains very significant in spite of the given condition for treatment: "site effect knowing the treatment". For this, Gi was considered because it is directly accessible; treated quadrats Gi (31.77 m²/ha) is significantly different from that of the untreated one (21.60 m²/ha). Gi was taken account via covariance analysis. The purpose of this statistical method is to eliminate the influence of R rate increase. It enables to eliminate the associated variability of R to Gi, and to compare both groups of quadrats as if mean Gi is identical. The decomposition of the sum of the squares error (SS) for each regression model (1, 2 and 3) is given in table 2. The result obtained shows that models (2) and (3) are equivalent because SS(2) = SS(3) and df(2) = df(3). However, in addition to all the sources of variation which were taken into account in model (3), the model (2) must express the effect of the forestry treatment (Ti) which is consequently null. Thus, the effect of the forestry treatment is not significant when Gi is considered identical in both types of quadrats (i.e. treated and untreated). By taking account Gi, R values were revaluated using mean correction technique that is associated to covariance analysis method. This correction or adjustment of R mean values aims to determine values that probably would be observed if both categories of quadrats had the same Gi. It is what explains the introduction of the quantity α (uij –ū) in the mathematical expression of models (2) and (3). This quantity represents the presumably linear relation between Gi and R. Let us call ūi the R mean value for quadrats having received treatment i. For this treatment i, the mean R observed value is corrected by subtracting the quantity α (uij –ū). The value of the regression coefficient α is 0.032, and the mean value of Gi for the whole quadrats (ū) is 27.68 m2/ha. The corrected mean values are determinated and summarised in table 3. The positive value of the regression coefficient α indicates that Gi tends to increase R values in the quadrats. The lower the Gi value is, higher is the R value. The difference between the corrected means (0.73 and 0.92 m2 /ha/year) is not significant, but R value of untreated quadrats remains lower than that of the treated quadrats. The comparison of models (1) and (2) enables to estimate the profit of precision obtained due to the introduction of variable Gi. The table 1 gives an estimate value of the error variance that is 11.68 ÷75 = 0.156 for model (1), and 10.94 ÷75 = 0.148 for model (2). The relationship between these two estimates ( 0.156 ÷ 0.148 = 1.054 ) shows that application of covariance analysis had the same effect on the experiment precision as the multiplication of the replicates number by 1.054. DISCUSSION In tropical forests, biological material precedes almost always the design and the installation of experimental plan. It is therefore difficult, even impossible, for the experimenter to constitute homogeneous blocs in a strict sense of the experimental statistics. The example of the permanent plan of Mopri is a perfect illustration of this reality. Although the assignment of the treatments was made randomly, both groups of quadrats, treated and untreated, differ from their initial total basal area. This is due to the diversity of environmental factors which effects are sometimes ignored by the experimenter. In the case of Mopri, the variable "initial basal area" that was neglected at the beginning of the experimentation appeared very determining thanks to covariance analysis. Although the precision increase appears low (1.054), it induces a non negligible correction in the estimate of the parameters of the commercial trees increase. It results in a productivity increase of 0.2 m2/ha/year in the untreated quadrats, and a fall of 0.13 m2/ha/year in the treated quadrats. These corrections are particularly significant on the scale of tropical forests whose surfaces are generally about several tens thousands of hectares. This example shows that in forestry, thanks to covariance analysis method it is possible to take into account certain determinant variables omitted in a study. This statistical technique should however not be used abusively, because questions about significance tests are few important compared to those of experimental organization and control (Atkinson and Donev, 1992; Goupy, 1999). The best solution for the forest experimenter is always to consult a biometrician. The latter could advise the experimenter to give up the test if its realization would be worthy. Indeed, what is the interest to perform an experimentation which has only few chances to highlight "interesting" differences? The biometrician will indicate the way in which the experiment must be performed in order to obtain the most effective control of the environmental heterogeneity. According to replicates number, he will calculate the expected precision (Foster, 2001; Guimarães and Guimarães, 2006; Snedecor and Cochran, 1989). CONCLUSION Covariance analysis constitutes a set of methods which are related at once to the analysis of the variance and the regression. Its use is justified in this paper by the fact that we study the influence of two classification factors, "treatment" and "site", on a quantitative variable, "rate of increase in basal area of commercial species". We proceed as in a traditional analysis of variance, while eliminating however by regression, the effect of the auxiliary variable "initial total basal area" observed on the same quadrats. More than analysis of variance, covariance analysis can be used only under relatively strict conditions, concerning particularly the distributions normality, the variances equality, the linearity of the relation between the considered variables and the regression coefficients equality related to these variables. These application conditions must have always be confirmed. This statistical technique should not be used systematically and it is always preferable to consult a biometrician during the experimental plan development. Acknowledgements: We thank SODEFOR and CIRAD-FORET for the installation of permanent sample plots in Côte d’Ivoire, and data-gathering. We also thank Drs KADIO A., PASCAL J.P., BERTAULT J.G., DHÔTE J.F., COUTERON P., and CHESSEL D. for their effective contribution and their councils in data analysis. We are very grateful with the French Mission of Cooperation and Cultural Action (MCAC) in Abidjan and with FORAFRI project which financed this study. REFERENCES
Copyright 2008 - Journal of Applied Science and Environmental Management The following images related to this document are available:Photo images[ja08020t2.jpg] [ja08020t3.jpg] [ja08020t1.jpg] |
| |||||||||
