 |
| About Bioline | All Journals | Testimonials | Membership | News |
|
||||||
|
||||||
Journal of Applied Sciences and Environmental Management, Vol. 12, No. 2, 2008, pp. 35-42 Bio-survey of Plankton as indicators of water quality for recreational activities in Calabar River, Nigeria EMMANUEL C UTTAH1; CHINASA UTTAH2; P A AKPAN1; E M IKPEME1; J OGBECHE1; L USIP3; J ASOR4. 1Department of Biological Sciences, Cross River University of Technology,
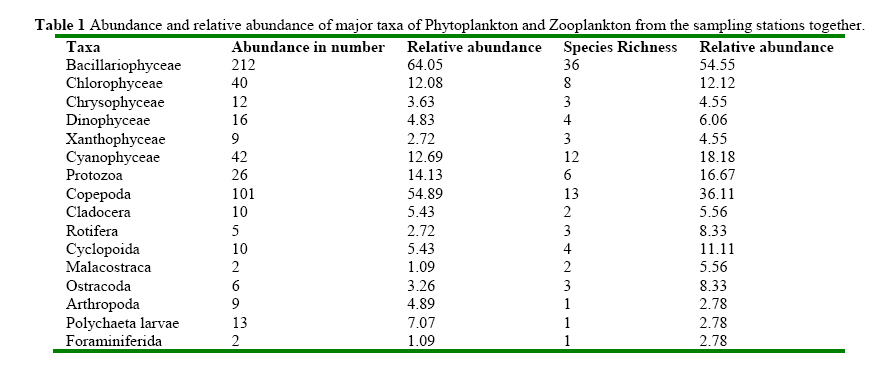
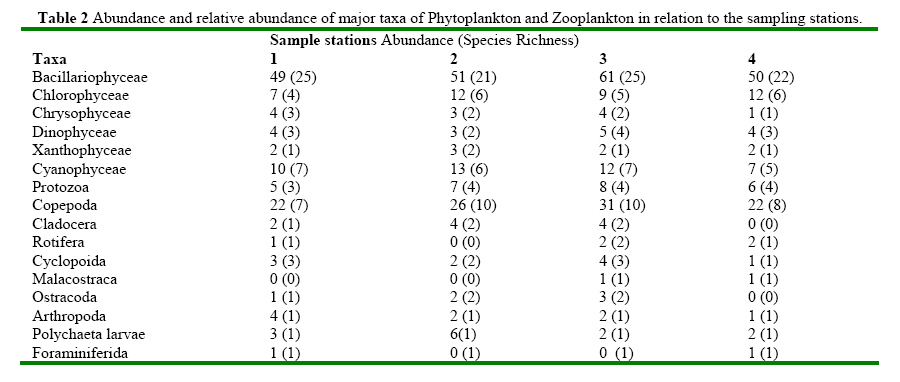
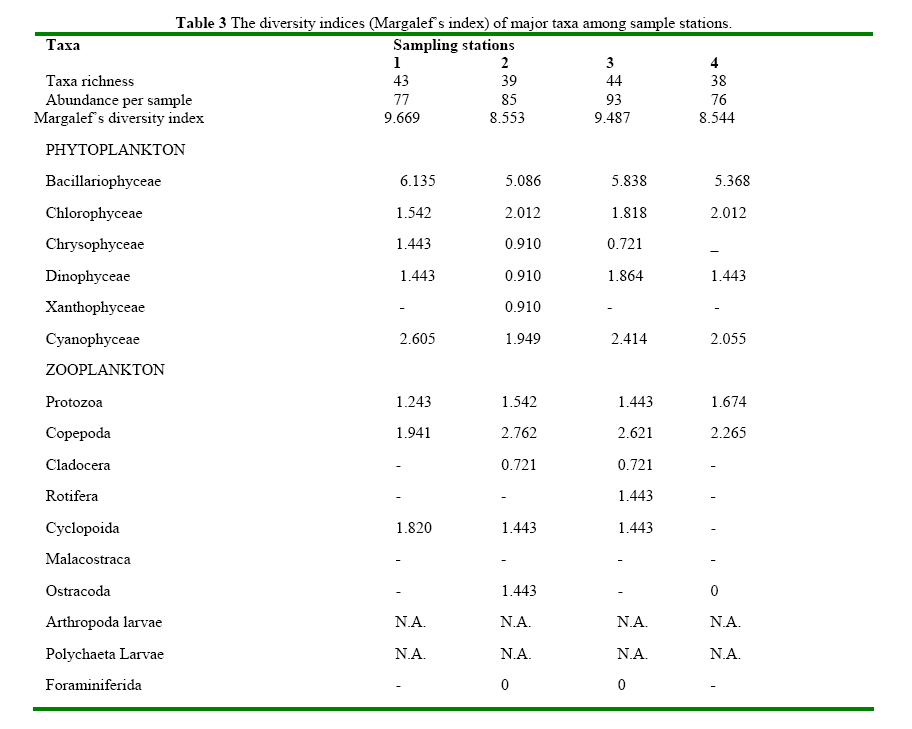
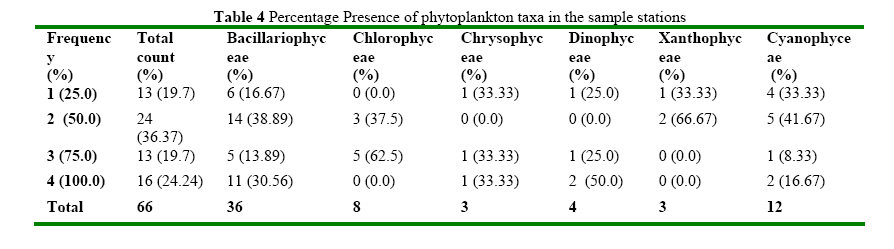
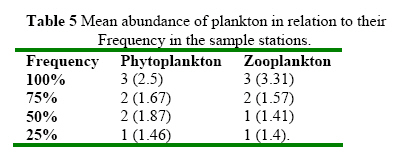
Calabar, Nigeria. Code Number: ja08026 ABSTRACT With the increasing recognition of Calabar as a global tourist destination, the suitability of Calabar River for recreational activities by tourists was investigated. The aim was to use phytoplankton and zooplankton characteristics to assess the water quality of the Calabar River. Phytoplankton and zooplankton samples were collected from four stations along the river and carried in plastic containers at 4oC to the laboratory for taxonomic and diversity index analyses. Water samples were also collected from the sampling stations for physico-chemical analysis. In total, 331 phytoplankton individuals were identified from sixty-six species in sixty genera and six taxonomic groups. The most abundant taxon was Bacillariophyceae 212 (64.05%), followed by Cyanophyceae 42 (12.69%), Chlorophyceae 40 (12.08%); Dinophyceae 16 (4.83%); Chrysophyceae 12 (3.63%) and Xanthophyceae 9 (2.72%). Similarly, the diatoms were highest in species richness (54.55%) followed by Cyanophyceae (18.18%), Chlorophyceae (12.12%), Dinophyceae (6.06%), Chrysophyceae (4.55%), and Xanthophyceae (4.55%). Among the zooplankton, the Copepods were the most abundant (54.89%). Others were Protozoa (14.13%), Polychaeta larvae (7.07%), Cyclopoida (5.43%), Cladocera (5.43%), Arthropoda (4.89%), Ostracoda (3.26%), Rotifera (2.72%), Malacostraca (1.09%), and Foraminiferida (1.09%). The copepods were highest in species richness (13), representing 36.11% of the total. The other zooplankton taxonomic groups were Protozoa (16.67%), Cyclopoida (11.11%), Ostracoda (8.33%), Rotifera (8.33%), Cladocera (5.56%), Malacostraca (5.56%), Arthropoda (2.78%), Polychaeta larvae (2.78%), and Foraminiferida (2.78%). We did not observe any preponderance of harmful phytoplankton or zooplankton in the Calabar River during the study. The river showed no evidence of stress beyond her carrying capacity, and there was no evidence of any harmful environmental conditions that is detrimental to recreational activities in the Calabar River. We assess Calabar River as being biologically suitable for contact recreational activities, from the point of view of her plankton characteristics. Calabar is increasingly being recognized as an international tourist destination. This informs the need to scrutinize available tourism facilities and resources to ensure that their qualities are of international standard. One of such resources of strategic tourist importance is the Calabar River. The river, if properly harnessed, will be expected to host recreational activities. Recreational uses of inland and marine waters are on the increase in many countries. These recreational uses of inland waters include total-immersion sports, such as swimming, surfing and slalom canoeing, and non-contact sports, such as fishing, walking, bird-watching and picnicking (WHO, 2001). In America, over 77 million people are reported to participate annually in recreational boating, and an estimated 20 million recreational boats were projected for the year 2000. About 80 million Americans participate in outdoor (non-pool) swimming, while beachgoers spent $74 billion in just seven states (Cicin-Sain and Knecht, 1999). It is a basic requirement that Water systems used for recreational activities must be clean and healthy. Failure to meet this requirement could affect tourism negatively (Cicin-Sain and Knecht, 2001). Reports show that provision of recreational-water standards in some places, have succeeded in driving water quality improvements, increasing public awareness, contributing to informed personal choice and contributing to public health benefit in those places. These successes are difficult to quantify, but the need to control and minimize adverse health effects has been the principal concern of regulation (WHO, 2006, 2001). Several methods have been employed to ascertain the safety status of recreational water bodies. These include Escherichia coli (DWAF, 1995). Enterococci /faecal streptococci, Thermotolerant coliforms (e.g., Klebsiella from pulp and paper mill effluents), total coliforms, Salmonellae, and Enteroviruses (APHA, 1998). E. coli is intrinsically suitable for fresh waters but not marine water; there are currently insufficient data to develop a Guideline Value with this parameter in fresh water (WHO, 2001). In 1986, the United States Environmental Protection Agency (USEPA) recommended to states that they should no longer use fecal coliform as an indicator of the bacterial health of water. Based on studies conducted by USEPA, it was recommended that states both use E. coli or Enterococci for their bacterial indicator criteria in freshwaters, and use only Enterococci in marine waters (Hicks, 2002). No work has been reported on the use of planktons as indicator organisms to assess the status of recreational water bodies. Planktons (phytoplankton and zooplankton) are essentially non-motile organisms relative to the water mass, but drift with it, and are therefore susceptible to pollutants in the water. The zooplankton of the surface waters is composed of two types of organisms: firstly the permanent members with their whole life-cycle spent in the plankton (holoplankton), and secondly, the egg and larval stages of organisms whose adults are benthic (meroplankton) (Dicks, 1976). The use of living organisms to determine the presence, amounts, changes in and effects of physical, chemical, and biotic factors in the environment is termed Biological monitoring (Baker, 1976). Different types of invertebrates have different tolerances to pollution and are also affected by quality of their habitat. This means that we can tell how good the water and habitat quality is by the types and numbers of invertebrates living in the river (Environment Waikato, 2006). An important aspect of biological monitoring is the use of species diversity. Species diversity is a reliable parameter in biology to determine how healthy an environment is (Ogbeibu and Edutie, 2002). This work was aimed at using phytoplankton and zooplankton characteristics to assess the water quality of the Calabar River for recreational activities. MATERIALS AND METHODS SAMPLING METHODS For both the phytoplankton and zooplankton studies, plankton net of 55 µm mesh-size was used to collect samples. The plankton nets were towed horizontally at surface for five minutes at 2 knots for phytoplankton collection. When retrieved back onto the deck, the collected phytoplankton samples were preserved in 250 ml polyethylene bottles and fixed with Lugol’s iodine. For zooplankton, the plankton nets were towed vertically from depth subjective to the depth of the sampled station. The zooplankton samples were preserved in 250 ml polyethylene bottles and with 10% formalin. The samples were then transported to the laboratory for identification and counting. As much as possible, identification was made up to species level or genus level. PHYSICOCHEMICAL PARAMETERS A single unit Teflon-lined PVC Nishkin bottle triggered with a messenger was used to collect water samples. These water samples were later sub-sampled into 2.0 litre plastic containers and stored cool at 4°C until they were analyzed in the laboratory. The physicochemical parameters (Temperature, pH and Dissolved oxygen) were measured using tabletop meters. LABORATORY ANALYSIS The phytoplankton samples brought from the field were allowed to settle at least overnight. The laboratory method followed a modification of (de Vlaming et al, 2006). Each sample was first homogenized, then using a Hensen Stempel pipette; 1 mL aliquots were removed and placed onto a counting chamber. Using a dissecting microscope, the plankton were counted and placed into a vial containing 10% formalin solution for zooplankton, and Lugol’s iodine for phytoplankton. This was repeated for 10 times and the mean was used to determine sample abundance, which was then used to determine the plankton density. The second phase of sample processing was taxonomic identification. Each sample vial was emptied onto the Ward counting wheel, with each taxon being enumerated and recorded on a data sheet. As much as possible, the phytoplankton/ zooplankton were identified down to species level or genus level. To identify specimen to genus or species levels, individuals were removed and slide mounted for observation under a phase contrast compound microscope. DIVERSITY INDEX The Margalef’s Diversity Index (MDI) which was used to measure diversity index. The formula for Margalef’s index is MDI = n – 1/ ln N where n is the number of species, and N is the Total Abundance. RESULTS AND DISCUSSION ABUNDANCE A total of 331 phytoplankton individuals were collected in the study. Of these, the most abundant taxon was Bacillariophyceae (212 or 64.05%), which was distantly followed by Cyanophyceae (42 or 12.69%). The relative abundance of the major taxa of phytoplankton are presented in Table 1 alongside that of zooplankton. Other phytoplankton taxa present in the study area were Chlorophyceae (40 or 12.08%); Dinophyceae (16 or 4.83%); Chrysophyceae (12 or 3.63%) and lastly Xanthophyceae (9 or 2.72%). The abundance values and the number species of the major taxa of phytoplankton in the various sample stations confirms the predominance of diatoms in all the sections of the River Cross (see Table 2). The river showed perhaps some evidence of a level of homogeneity in relative abundance of phytoplankton species in all the sample stations. The predominance of diatoms (the Bacillariophyceae) is common feature of open, lotic waters with fast flowing currents such as the Calabar River system. There was no preponderance of harmful phytoplankton species found in the system. This is very important in determining the suitability of the Calabar River for recreational activities such as swimming, etc. Further analysis of the abundance at the Genera level shows that three most abundant phytoplankton genera in this study had a cumulative abundance that represented 31.42% of the total phytoplankton abundance. They are Biddulphia; Coscinodiscus; and Melosira with relative abundance of 16.31%, 11.48% and 3.63 respectively. Furthermore, six least abundant genera had a cumulative relative abundance of 1.81%. They are Cyclotella, Isocrysis, Lithodesmium, Strauroneis, Mallomonas, and Netrium; and each of these had relative abundance of 0.3%. Biddulphia is one of the most abundant diatom species in shallow inshore waters (Newell and Newell, 1963). The genus Coscinodiscus is known to be a prominent and abundant diatom in river ecological systems. On the other hand, five least-abundant genera: Cyclotella; Isocrysis; Lithodesmium, Strauroneis; Mallomonas; and Netrium had a cumulative abundance that represented only 1.8% of the total phytoplankton abundance. Many species of freshwater algae may proliferate quite intensively in eutrophic (i.e., nutrient-rich) waters. However, they do not form dense surface scums or “blooms,” as do some cyanobacteria. Toxins they may contain therefore are not accumulated to potentially hazardous concentrations. For this reason, most adverse health impacts from recreational use of fresh waters have been associated with cyanobacteria rather than with freshwater algae (Lewis et al, 1995). According to the World Health Organization, allergic or irritative dermal reactions of varying severity have been reported from a number of freshwater cyanobacterial genera (Anabaena, Aphanizomenon, Nodularia, Oscillatoria, Gloeotrichia) after recreational exposure. In contrast to dermal contact, uptake of cyanobacteria though ingestion or aspiration involves a risk of intoxication by cyanotoxins. Most documented cases of human injury through cyanotoxins involved exposure through drinking-water, and they demonstrate that humans have become ill through ingestion or aspiration of toxic cyanobacteria. Symptoms reported include abdominal pain, nausea, vomiting, diarrhoea, sore throat, dry cough, headache, blistering of the mouth, atypical pneumonia and elevated liver enzymes in the serum, as well as hay fever symptoms, dizziness, fatigue, and skin and eye irritations (WHO, 2003). Although at the time of this study, dangerous species of dinoflagellates, diatoms, nanoflagellates and cyanobacteria (blue-green algae) that occur in the marine environment were not found in the estuarine end of the Calabar River, there must be bioassessment protocols on ground to ensure safety forecasts during recreational activities. This is necessary because several human diseases have been reported in association with these toxic species (WHO, 2003). Marine algal toxins become a problem primarily because they concentrate in shellfish and fish that are subsequently eaten by humans, causing shellfish poisoning (not dealt with in this volume). Marine cyanobacterial dermatitis (“swimmers’ itch” or “seaweed dermatitis”) is a severe contact dermatitis that may occur after swimming in seas containing blooms of certain species of marine cyanobacteria. The symptoms are itching and burning within a few minutes to a few hours after swimming in the sea where the cyanobacteria are suspended. Among the zooplankton, the Copepods were the most abundant zooplankton taxon constituting more than half (54.89%) of the zooplankton abundance. Following distantly was the taxon Protozoa which constituted just 14.13% of the total zooplankton abundance. The relative abundance of the other zooplankton taxa was as follows (see Table 1): Polychaeta larvae (7.07%); Cyclopoida (5.43%); Cladocera (5.43%); Arthropoda (4.89%); Ostracoda (3.26%); Rotifera (2.72%); Malacostraca (1.09%); and Foraminiferida (1.09%). The Copepods have been known to be most abundant zooplanktons in river systems. In this study they were most abundant in all the sample stations (as shown also in Table 2). Copepods dominate most aquatic ecosystems because of their resilience and adaptability to changing environmental conditions and ability to withstand varying environmental stresses (Barnes et al, 1988). As observed in the phytoplankton studies, there was perhaps some evidence of a level of homogeneity in relative abundance of zooplankton species in all the sample stations. In the zooplankton studies, the four most abundant zooplankton species had a cumulative abundance representing 38.59% of the total zooplankton abundance. These are Calanus, Isaias, Paracalanus, and larval polychaetes had relative abundance of 19.02%, 6.52%, 5.98%, and 7.07% respectively. The six least abundant genera contributed only 3.26 of total zooplankton abundance. They Pyrocysis, Anomalocera, Brochionus, Conochilus, Anchialina, and Concoecia; and each had a relative abundance of 0.54%. Paracalanus parvus exists in all tropical and temperate waters but absent in arctic and Antarctic waters. But the least abundant zooplankton genera (which made up 16.67% of the zooplankton genera) had a cumulative abundance that represents only 3.26% of the total zooplankton abundance. Investigations of freshwater zooplankton community structure have significant potential for assessing aquatic ecosystem condition/health. Stressed communities are rather easily identified (de Vlaming et al, 2006). Our findings showed that the Calabar River is not predominated by dangerous invertebrates. Invertebrates that possess some kind of venomous apparatus belong to one of five large phyla, namely Porifera (sponges), Cnidarians (sea anemones, hydroids, corals and jellyfish), Mollusca (marine snails and octopi), Annelida (bristleworms) and Echinodermata (sea urchins and sea stars) (WHO, 2003). The effects of invertebrate venoms on humans range from mild irritation to sudden death. The WHO report proffered preventive measures to include wearing suitable footwear when exploring the intertidal area or wading in shallow water, avoiding handling sponges, cnidarians, cone shells, blue-ringed octopus, bristleworms or the flower sea urchin, avoiding brushing against hydroids, true corals and anemones, and avoiding bathing in waters where Portuguese man-of-war are concentrated. DIVERSITY INDICES The diversity of a community depends on the Species Richness and Species Evenness. Species Richness is the aspect of diversity that bothers on the number of species present in the community; whereas Species Evenness as the name explains, bothers on the evenness with which the individuals are apportioned among the species. A total of sixty-six species of phytoplankton in sixty genera and six taxonomic groups were collected (see Table 1 also for both Phytoplankton and zooplankton species richness). Of this total, the diatoms presented with the highest amount of species richness, which constituted 54.55% of the total zooplankton species richness. Other taxonomic groups were represented as follows: Cyanophyceae (18.18%); Chlorophyceae (12.12%); Dinophyceae (6.06%); Chrysophyceae (4.55%); and Xanthophyceae (4.55%). The species diversity observed in this study was impressive. This could mean that there is no excessive nutrient input which normally causes decline in species diversity (Boaden and Seed, 1985). It is a measure of availability of various ecological niches to be occupied by various species of organisms within an ecosystem (Yakub, 2004). The scenario was same for zooplankton. For the latter, a total of thirty-six species in thirty-four genera and nine taxonomic groups were collected. The copepods had the highest species richness (13), which represents 36.11% of the total. The other zooplankton taxonomic groups were represented as follows: Protozoa (16.67%); Cyclopoida (11.11%); Ostracoda (8.33%); Rotifera (8.33%); Cladocera (5.56%); Malacostraca (5.56%); Arthropoda (2.78%); Polychaeta larvae (2.78%); and Foraminiferida (2.78%). The impressive species diversity observed for both phytoplankton and zooplankton agree with the aphorism that the status of phytoplankton species diversity influences the status of species diversity of organisms of higher trophic levels such as zooplankton, macroinvertebrates and vertebrates (Yakub, 2004). The Margalef's diversity index (MDI) of the phytoplankton among the sample stations (see Table 3) showed that phytoplankton diversity was highest in Station 1 (9.669). The next was station 3 (9.487). The least MDI was 8.553 recorded at station 2. For the zooplankton studies the highest index figure (6.431) recorded in station 3; followed by station 2 (5.652), Station 1 (4.816), and station 4 (4.744). It must be stressed that the diversity of plankton communities is essentially related to the number and longevity of simultaneously coexistent exploitable niches. In the ecosystem, there are always in existence temporary niches in which growth conditions differ from that elsewhere. Such niches are, however, frequently obliterated and reconstituted at random. The small size of the niches permits high between-niche diversity, directly favoring the maintenance of several species (Reynolds, 1984). Sometimes faunistic changes indicate arrival of a different water mass of a particular type. FREQUENCY, DISTRIBUTION AND FIDELITY Distribution of animals and plants depends partly upon the environment, their requirements and their range of tolerance. The organisms with many requirements and a limited range of tolerance are very narrowly distributed and usually rare (Phillips, 1988). This may explain disparities in Frequency and Fidelity among Phytoplankton and zooplankton species as observed in the Calabar River system during the study. Among the phytoplanktons, 13 species (19.7%) occurred in only one sample station (25% frequency), 24 species (36.37%) occurred in two sample stations (50% frequency), 13 species (19.7%) occurred in three sample stations (75% frequency), 16 species (24.24%) occurred in all the sample stations (100% frequency) (See Table 4). The various phytoplankton taxa presented different presence performances: most species in the Bacillariophyceae class showed presence in two of the four sample stations (50% frequency); the same with the Xanthophytes and the Cyanophytes. Majority of Chlorophytes were present in 75% of the sample stations. Chrysophytes and Dinophytes were too few for a categorical conclusion. RELATIONSHIP BETWEEN FREQUENCY AND RELATIVE ABUNDANCE Among the phytoplanktons, 7 species representing 10.61% of total number of phytoplankton species, contributed 31.42% of the total phytoplankton abundance. All of these 7 species had 100% Frequency in the sample stations. The same was true for the Zooplankton. Seven zooplankton species (10.61% of total species) accounted for 53.26% of the total zooplankton abundance. As shown in Table 5, the plankton species with relatively higher frequency in the sample stations contributed relatively higher to total abundance. This result may be indicative of the fact that no plankton species had a sporadic and focalized/localized bloom in any of the sample stations. A closer look at the both the phytoplankton and zooplankton data showed that most of the species that showed low Presence and high fidelity had very low abundance. It may be inferred that abundance of a species in an ecosystem may be precursory to her Presence and Fidelity characteristics in that ecosystem. It is known that the chance of encountering low-abundant species during sampling improves with repeated sampling. In other word, the more the sampling is repeated, the more the chance of encountering low-abundant species, all things being equal. DOMINANCE A study of dominance among the phytoplankton taxa shows that the diatoms, followed by the Cyanophytes were dominant in the Calabar River system, similarly, among the zooplankton taxa, the copepods were dominant. However we believe that the habitat suffers frequent variability, and according to Reynolds (1984), conditions are not ideal for any one competing species and the competitive advantage swings from one species to another before the latter has had the opportunity to replace the former. PHYTOPLANKTON-ZOOPLANKTON INTERACTION The proportion of phytoplankton to zooplankton was approximately similar in all the sample stations. The least proportion is 1.6 to 1 (approximately 2: 1) in station 3, which is technically the same as with the greatest proportion 2.1 to 1 (approximately 2:1) recorded in station 4. It is an established fact that the phytoplankton abundance should be higher than those of zooplankton being in the lower trophic level than the latter. The Phytoplankton-zooplankton abundance balance depends on a large scale on the presence and absence of active and on-going grazing. The abundance of zooplankton grows while that of phytoplankton, which acts as food for the latter diminishes relatively, until the population of phytoplankton is unable to support the zooplankton population. Perhaps, successional trend may be an important factor also. Successional trend may be interrupted at any time by externally imposed (allogenic) perturbations, which significantly alter the physical structure of the environment (Reynolds, 1984). The most important of these are wind-induced mixing episodes, especially where these both randomize the vertical distributions of the existing and recharge the surface waters with nutrients. Potentially they are conducive to the eclipse of existing populations by species better adapted to well-mixed columns in which light is likely to be the most serious limiting factor. If the perturbation is sustained, the earlier succession cannot be followed and isn’t supplanted by a new line of development. Its 'progress' is likely to be soon arrested, as either nutrients or light become limiting at a stage equivalent to a lagioclimax (Reynolds, 1980). Advancing succession is typically characterized throughout by increasing species diversity and increasing production per unit area but declining productivity (i.e. production: biomass ratio) (Reynolds, 1984).PHYSICO-CHEMICALCHARACTERISTICS (a) Temperature: Results of temperature measurements in all sampling stations showed a range of 28.7° C to 28.9° C. Temperature is an important characteristic that can vary widely and is influenced by a number of variables including geographic location, shading, water source, thermal discharges, water body size and depth. It is important because it has a great influence in determining what organisms can survive in a water body; and it can directly affect the amount of oxygen that can be dissolved in water; the rate of photosynthesis by algae and larger aquatic plants; the metabolic rates of aquatic organisms; and the sensitivity of organisms to toxic wastes, parasites and diseases (www. boquetriver.org). (b) pH: The pH of a river could be affected by its age, geology and the chemicals discharged into it by communities and industries (http://www.boquetriver.org). The pH of the Sample stations were 6.54, 6.85, 6.82, and 6.70 for Stations 1, 2, 3, and 4 respectively which were close to neutral level. Most aquatic organisms survive best within a limited pH range. Even small changes in pH are harmful to pH sensitive species. Most fish can tolerate pH values of about 5.0 to 9.0. pH values outside that range can create problems for reproduction and survival (http://www.boquetriver.org). Furthermore, pH has a direct impact on the recreational uses of water only at very low or very high pH values. Under these circumstances, it may contribute to irritation of the skin and eyes (WHO, 2003). (c) Dissolved Oxygen (DO): DO is a measure of the amount of oxygen freely available in the water. Its presence is crucial to the survival of most aquatic organisms. Variations occur due to temperature changes (colder water can hold more oxygen), flow rates (fast moving streams have more dissolved oxygen) and photosynthetic activities (Water Quality Testing, 1998). In the Sample stations, the recorded DO was 4.10 mg/l, 4.42 mg/l, 4.40 mg/l, and 4.24 mg/l (=ppm) for stations 1, 2, 3, and 4 respectively. The differences are minimal and therefore insignificant and tend to suggest that the DO levels in the sample stations were approximately similar. These figures indicate that the oxygen levels are relatively satisfactory. It must be borne in mind that these figures are slightly lower than 5 mg/l (=ppm) oxygen concentration, which is the benchmark for Cool trout, and salmon waters (trout and salmon streams are normally of best quality: cool and well oxygenated). CONCLUSION There were no harmful phytoplankton observed in Calabar River, and there was no evidence of any harmful environmental conditions that is detrimental to recreational activities in the system. It can therefore be concluded from evidence available from plankton studies that Calabar River is suitable for contact and non-contact recreational and tourist-relaxation activities. REFERENCES
Copyright 2008 - Journal of Applied Science and Environmental Management The following images related to this document are available:Photo images[ja08026t1.jpg] [ja08026t3.jpg] [ja08026t5.jpg] [ja08026t2.jpg] [ja08026t4.jpg] |
| |||||||||
