 |
| About Bioline | All Journals | Testimonials | Membership | News |
|
||||||
|
||||||
Journal of Applied Sciences and Environmental Management, Vol. 12, No. 2, 2008, pp. 43-46 A remote sensing evaluation for agronomic land use mapping in Tehran Province, Iran *EHSAN GOLMEHR Geo community Staff (Canada), Department of Geography (Mumbai University)Flat
No, 12 -Fourth Floor -No, 32 -Shahamati Street -After Valiasr Square -Tehran-Iran.
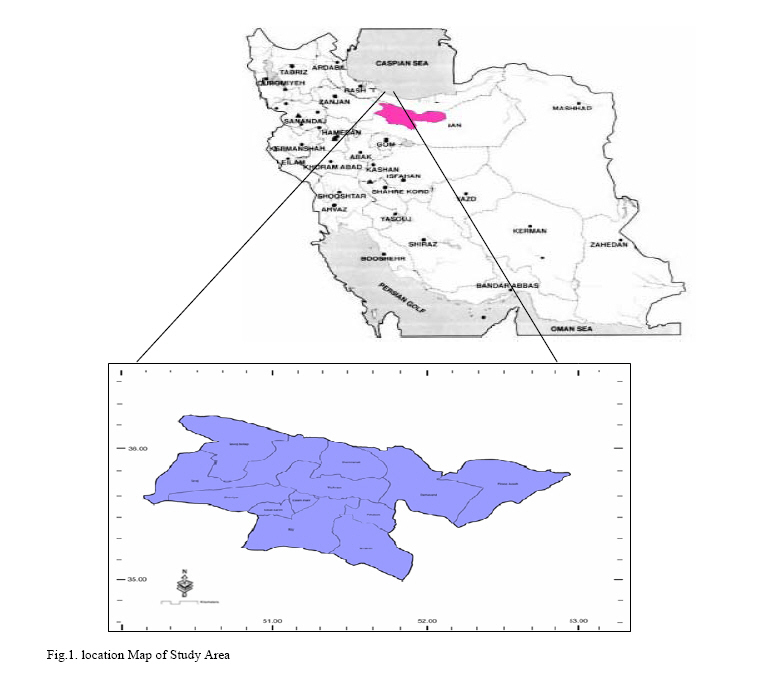
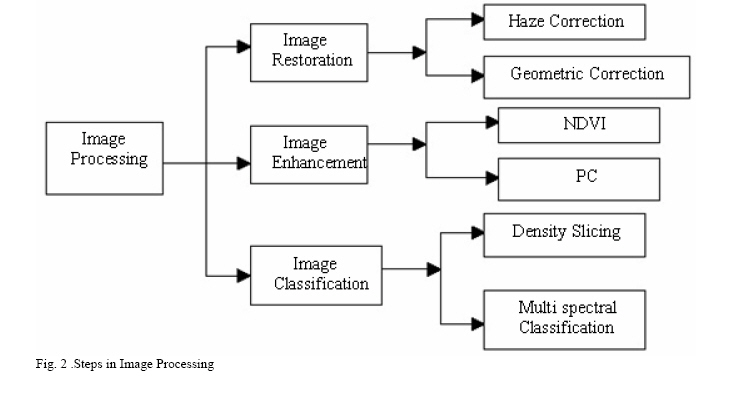
*Email:ehsan.golmehr@gmail.com Code Number: ja08027 ABSTRACT It has become essential to prepare land use maps because these are recognized as necessary tools for the preparation of land capability, land classification and land suitability maps which in turn provide guidelines for the regional planning, development and future orientation of agriculture in the regional system. The principal objective of this study is to identify, demarcate and map agricultural land use categories of Tehran province on basis of remote sensing survey technique. In this research, Landsat ETM images of July 2006 were used to expose the use of remote sensing technique in order to produce current land use map of the study area. Analysis indicates that the major parts of the area comprise rangeland with the total surface area of 1146585 ha. About 102080 ha of the total area was occupied by rock outcrop and forest land. The remaining surface area was under cultivation. Man has been using land for one purpose or another from time immemorial and the systematization of knowledge relating to land use dates as far back as the imposition of taxes on land according to its use and quality (Singh& Dhilloon, 2004). The beginning of land use studies and surveys may be traced to the regional surveys which were of a purely general academic interest until the planners discovered the value of land use studies (Singh, 1997). However, the idea of a map showing the use of land was mooted by Sauer (1919). Proximate survey technique was the earliest form of a survey technique which accurately marks the location of various objects on the surface of the earth. The new technique of land use mapping was developed to overcome the shortcoming of the proximate sensing technique. The satellites fitted with various remote sensing appliances like electro optical and non photographic sensors have added a new dimension to this technique (Singh& Dhilloon, 2004). Different features such as vegetation, water bodies, rock outcrops, etc. land cover and each such a feature has a different electromagnetic energy (Neameh, 2003). Electromagnetic energy is the means by which information is transmitted from an object to a sensor (Elachi& Zyl, 2006). The sensors produce digital images to be sent to earth’s receivers. In other words, remotely sensed data are measurements of reflected solar radiation, energy emitted by the earth itself. In Iran, like many other developing countries, land use planning is not practiced on a regular basis. In many parts, rangelands are converted into rainfed agriculture. This is often the start point of degradation leading to accelerate erosion; land productivity reduction in case of fertile soil is washed away. Clearly, current land use developments in Tehran province are lacking a firm sustainable basis. In addition, no systematic land use planning has been carried out in the area so far. A systematic inventory and analysis of present land resource and land use patterns is therefore required to be followed by a sound land use planning. In this way, land use can be optimized on a sustainable basis with due consideration of government policy objectives and farmers’ priorities in the area. STUDY AREA The study area covers Tehran province that is one of the thirsty provinces of Iran. The area under study lies between 50?10? and 53° 8? North latitudes and 35? 1?and 36? 20? East longitude. The study area is located to the north of the central plateau of Iran. The province of Tehran has over 12,000,000 inhabitants and is Iran's most densely populated region. Approximately 84.15% population resides in urban areas and 15.85% in rural areas of the province. The highest point of the province is mount Damavand situated at an elevation of 5,678 m and the lowest point of the province in the plains of Varamin, 790 m above sea level. The largest rivers of this province are Karaj River and Jajrud River. Mountain ranges such as the Alborz span the north; Savadkooh and Firuzkooh in the north east; Lavasanat, Qarah daq, Shemiranat, Hassan abad and Name Mountains in the southern areas; Babi shahr Banoo and Alqadr are situated in the south east and the heights of Qaser-e-firoozeh are located to the east of the province. Geographically speaking the study area is located, in a microscopic view, in the depression surrounded by areas of the great Alborz mountain massif, west Zagros highlands and western part of the Kavir salt desert, specified by altitude ranging from 800 m to 4300 m above mean sea level. The highest recorded summer temperature in study area has been 42o centigrade while the lowest has been registered at -8o centigrade. The climate of the area is Mediterranean with air mass brought from west in winter and from east in summer. Pluvial air mass visits the area from west or north with humidity which gives precipitation on the way when crossing Azerbaijan, Zagros and Alborz mountains, loosing its influence as it advances further towards east and south. For this reason intensity and amount of precipitation of the area is controlled by latitude and altitude. The area receives 700mm or more rainfall in the western and northern highlands and 100mm or less in the southern and eastern border near the Kavir salt desert. (Figure 1) Methods of Land use Classification There are different techniques including multi-spectral classification and image enhancement for land use classification. The following flowchart shows the image processing. (Fig.2) Image Restoration Image restoration includes correction of data received from the satellite which can be made before classification. The following corrections be done: i) Geometric Correction Remote sensing data is affected by geometric distortions due to sensor geometry, scanner and platform instabilities, earth rotation, high altitude and etc. and since the images in raw format are not georeferenced, therefore; in order to integrate these data with other data in GIS, in other word to be able to work in a GIS environment, it is necessary to georeference the image, using existing maps. A Universal Transverse Mercator projection (UTM) and affine transformation were used for correcting and georeferencing the image. ii) Haze Correction Due to water vapor and suspended particles in the atmosphere which results in a low image contrast and affect visible and infrared ETM bands, Haze correction was used using “simple haze correction” script of PCI Geomatics. Image Enhancement Image enhancement technique is done to make a raw image better interpretable. It improves its quality and its visual impact for the human eye (Barbe, 1975). There are many techniques and methods of image enhancements used for visual interpretation; however the following techniques are the most suitable:
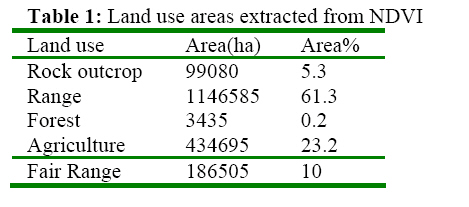
Normalized Difference Vegetation Index (NDVI) NDVI is based on the reflectance properties of vegetated areas as compared to clouds, water and snow on the one hand, rocks and bare soil on the other. Vegetated areas have a relatively high reflection in the near infrared and a low reflection in the visible range of the spectrum. Clouds, water and snow have larger visual than near infrared reflectance. Rock and bare soil have similar reflectance in both spectral regions (Cees & Farifteh, 2001). Vegetation cover can be differentiated from the other ground cover types by NIR/Red ratio. The following simple formula was used to identification of green cover: NDVI = (ETM4-ETM3) / (ETM4+ETM3) *128+127 Where ETM4 is ETM spectral band 4 and ETM3 is ETM spectral band 3 The numbers 127 and 128 are factors, to avoid negative index. After determination of NDVI, the density slicing option was applied for differentiating between areas with varying vegetation densities in order to classify different vegetation covers (Table 1). It is divided to four land use / cover classes: Rock outcrop, rangeland, forest, agriculture (which include both irrigated and rainfed lands) and Fair range. The result of NDVI classification showed that it was not possible to distinguish between dry land farming and the rangeland, as the reflectance between rainfed cropland and rangelands in the Mountain and Hill land are the same and it can’t be used well for agricultural lands. (Table 1) Principle Component Analysis (PCA) PCA can be applied to compact the redundant data into fewer layers and can be used to transform a set of image bands, as that the new layers (also called components) are not correlated with one another (Cees & Farifteh, 2001). High correlation between bands in multi spectral images such as Landsat image cause a lot of redundancy and finally give mixed pixels, which complicate classification. Principal Component Analysis is a statistical method used for compressing the original data set without loosing too much information. A Principal Component Calculation is known as a method to extract or reduce the spectral noise/redundancy (Richards, 1993). Principal Component Analysis is collecting the information of the spectral bands used in a cloud of points in a multi dimensional space and calculates a new optimum set of axis through these cloud data points. The number of Principal Component equals the number of input bands. The first PC is defined by maximum variance of the original data set; the last PC defines the leftover variance (Janssen& Herwijnen, 1994). PC1: Useful for studies of the agricultural land and
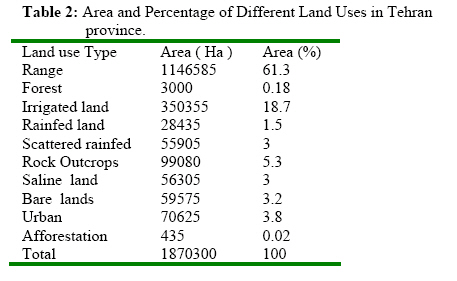
geology. Image Classification Techniques i) Unsupervised classification Classification is done automatically using only information of the digital image. In this type of classification, the computer assigns statistically spectral classes to the features. ii) Supervised classification In the combination of multi-spectral bands, three bands including ETM4, 3 and 2 were used to supervise classification, which is based on ground data collected in the field, from training sample sites. Supervised classification is the procedure that user predefines spectral classes. Training samples are selected, where the known pixels are assigned. Within pre-selected clusters, terrain sampling was done based on field observation knowledge that is named knowledge based classification (Abkar, 1994). After construction of the training samples, the image was classified using Maximum likelihood classification with threshold 100. Present Land Use In the combination of multi-spectral bands, three bands including ETM4, 3 and 2 were used to present land use classification, which is based on ground data collected in the field, from training sample sites. Supervised classification procedure was used to prepare current land use using spectral classes. Table 2 shows the types of current land use and their area. (Table 2) Conclusion Analysis indicates that the major parts of the area comprise rangeland with the total surface area of 1146585 ha. About 102080 ha of the total area was occupied by rock outcrop and forest land. The remaining surface area was under cultivation. Since ETM image was in July, which is at the time of growing crops, thus the problem of distinguishing between dry land farming and rangelands would occur. Therefore it was difficult to differentiate rangeland from rainfed crops. Classification of mixed pixels remains a problem, especially in a country like Iran where the problem of land tenure is not yet fully solved. Another serious problem is the converted rangelands into cultivated lands, which are left behind after a couple of years and used again as poor rangelands. Acknowledgments First, I want to express my gratitude to Mumbai University which providing me a home to develop myself as a researcher. I want to especially thanks to Dr. Ambadadas. S. Jadhav , Head of the Department of Geography at Mumbai University, who gave me the opportunity to work as Research Scholar under his supervision, Thanks for transmit your knowledge and for your pieces of advice as a friend. To my family for their support, patient and their understanding. REFERENCES
Copyright 2008 - Journal of Applied Science and Environmental Management The following images related to this document are available:Photo images[ja08027t1.jpg] [ja08027f2.jpg] [ja08027f1.jpg] [ja08027t2.jpg] |
| |||||||||
