 |
| About Bioline | All Journals | Testimonials | Membership | News |
|
||||||
|
||||||
Journal of Applied Sciences and Environmental Management, Vol. 12, No. 2, 2008, pp. 93-98 A study of the degree of Pollution in Nakivubo Channel, Kampala, Uganda KAYIMA, JOHN; KYAKULA, MICHAEL; KOMAKECH, WILLIAM; ECHIMU, SIMON PETER Department of Civil and Building Engineering, Kyambogo University, Uganda
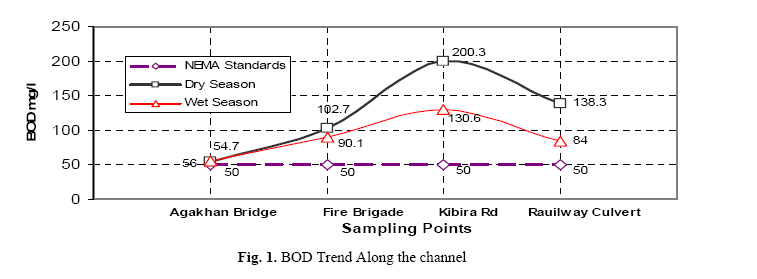
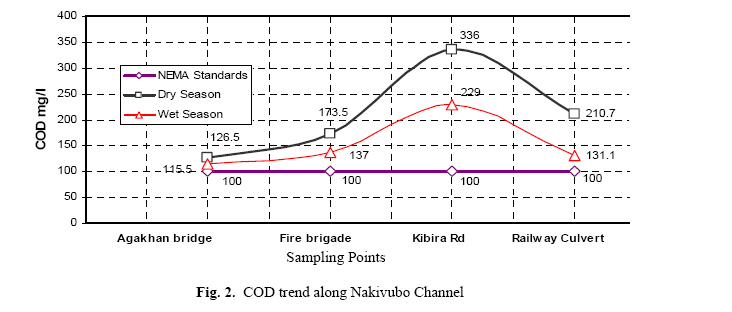
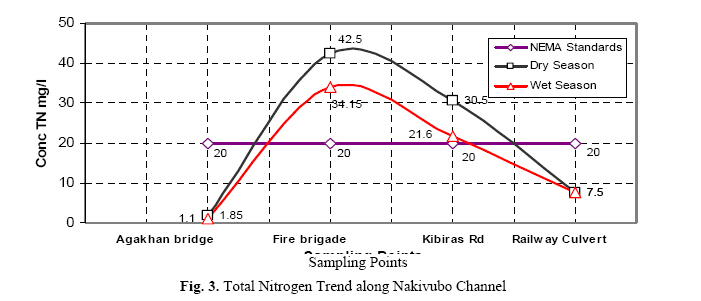
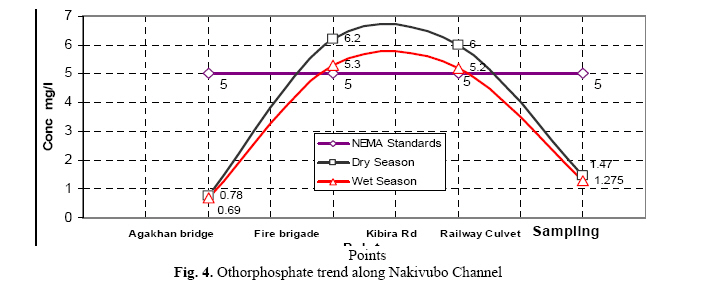
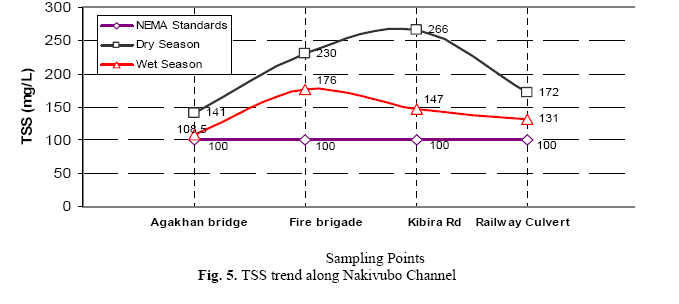
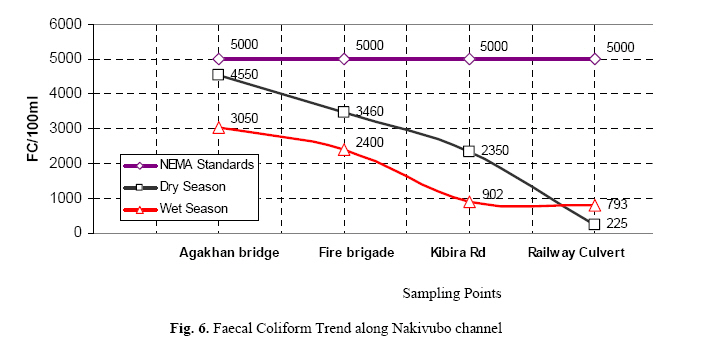
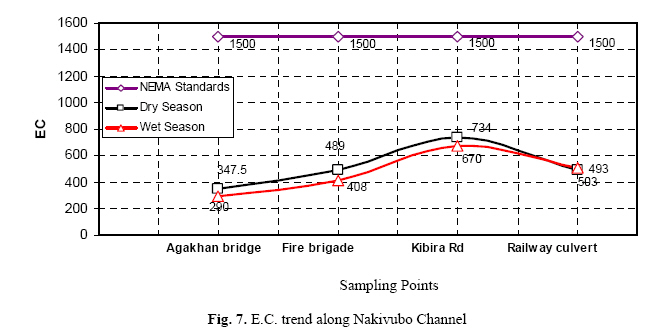
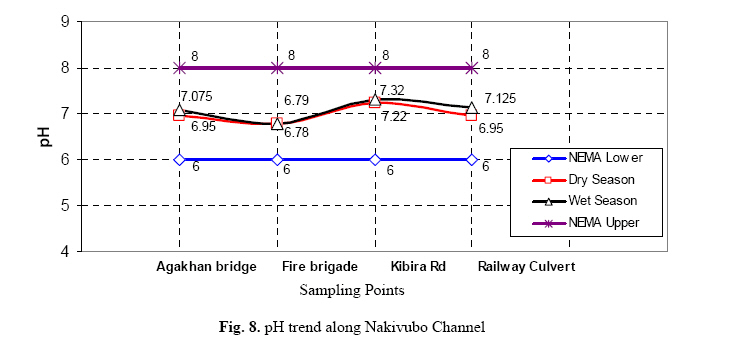
E-mail: mkyakula@yahoo.com Code Number: ja08034 ABSTRACT Nakivubo channel traverses highly populated Kampala slums, markets, industrial areas and a wetland. It discharges its water at Murchison bay in Lake Victoria. The degree of pollution in the channel has a direct effect on the aquatic life in the lake, the health of communities along the channel, and the cost of water treatment since its discharge point is only 2kms from the raw water intake for the city. This research investigated the degree of pollution in the channel so that appropriate purification measures may be taken either at the pollution source or in the channel before discharge to the lake. Samples were taken at four points along the channel during the wet and dry seasons. The samples were tested for pH, BOD, COD, TSS, E-Coli, EC, TN, and O-PO4. These were compared with the standards set by NEMA for waste water. It was found that there is a high degree of pollution in the channel. The wetland before the lake helps to bring down pollution levels but this should be supplemented by pretreatment before discharge into the channel. Recommendations on reduction of pollution in the channel were made. Nakivubo channel is a waste and storm water open channel that has its source at the foothills of Makerere hill. It traverses the highly populated slum of Makerere Kivulu, three busy markets and Kampala industrial area before discharging its water at Murchison bay in Lake Victoria. All these areas are major contributors to the high rate of pollution. Part of Makerere Kivulu slum has a low water table such that the several pit latrines are not dug deep but rather are built up. When full, these are emptied into the channel without any pretreatment. Some sewer lines are old and often break or get blocked, discharging their raw sewerage onto the streets and this ends up into the storm water drains and into the channel. Due to bad building practices some builders have connected their sanitary pipes to tributaries of the channel. Human Excreta has a lot of organic pollutants and pathogenic organisms which subject the communities along the channel to high health risk. The markets, several garages and industries along the channel have the effect of introducing pollutants like solids, oils, organic matter, heavy metals, nitrogen, phosphorus and pathogenic organisms into the channel. During the rainy season, running water washes dirt from city dwelling places, markets, industries into the channel. If this pollution in the channel reaches Lake Victoria, it has a diverse effect on the aquatic life. The pollution also increases the cost of water treatment, because the discharge point is only 4km from where National Water and Sewerage Corporation has its intake for the raw water. (Nalubega M. and KansiimeF, 1999) Moreover the public health of the population may be affected because there are people who live near the channel or lake who use this highly polluted water for various purpose such as car washing. Knowledge of the degree of pollution of a river enables decision on appropriate ways of controlling pollution levels to be made. Thus this study tested and analyzed the Nakivubo channel waters at different sampling points for waste water parameters and compared them with the guidelines set by National Environment Management Authority (NEMA) standards for municipal effluents. Nakivubo channel is about 12.3km long, with a catchment area of about 50km2, It has a number of tributary streams such as Nakulabye, Kitante and Lugogo. It receives Waste water from Soap and oil Industries, the city abattoir; and sewage works at about 2.5km from the start of the upper swamp. It is then joined by untreated sewerage from Luzira prison before crossing Nakivubo swamp. (Taylor, 1991) Taylor also estimated the swamp to be 2.8 km2, though currently it is estimated to be 1.9 km2. The inner Murchison Bay into which the Channel discharges its waters measures 16.8 km2 with a length of 5.6km, width 3.5km, and of depth 6.7m. The catchment area of the bay is about 279 km2 of which 52 km2 is of fringing swamp. The flow in the channel, measured in 1997-1999 at about 0.63 m3/s, which is high, due to constant flow from sewerage treatment plant, industries and domestic sources. According to work carried out by COWI and VKI (1998), the retention time for the channel effluents in the swamp is estimated at two days under calm and dry weather conditions. But under heavy rainfall, whose discharge can be up to ten times the dry weather discharge, the lower extreme of retention time is 12 hours. METHODOLOGY The methodology involved walking the whole length of the channel and some of its tributaries and carrying out a visual inventory of the channel and materials /water into and carried by the channel. It included interviews with government officials and testing of samples collected from various points once a week during the dry and wet month. Location of Sampling Points Samples of the Nakivubo Channel waters were collected, tested and analyzed for various waste water parameters during both the wet and dry seasons, then these were compared with NEMA Standards. The samples were collected from four strategically located points. The first point was located at Agakhan Culvert (Bridges) just after Makerere Kivulu slums. This point is about 400m from the beginning of the channel. This point was chosen to investigate the pollution resulting from the slums. The second point was located at Entebbe Road crossing at fire brigade station. This was after the channel had passed through three markets and part of Kampala central business district. . It aimed at investigating the pollution resulting from these business areas. The third point was located immediately after industrial area at Kibira Road. This aimed at investigating the pollution coming from the industrial area. Finally The fourth point was located at the railway bridge crossing, deep inside the swamp towards where the river joins the lake. The purpose of taking up to four samples and in different seasons was to cater for and be able to explain the variation in the quality of waster water with time and season. Also waste water quality varies along the length of a channel because of some chemical and biological activities. Collection of Water Samples The samples were extracted from a considerable depth below the surface of water to avoid the collection of surface impurities such as oils and tree leaves. They were drawn using a cylindrical container with a weight at the bottom and lowered in the middle of the river using a string. The cylinder was rinsed using water from the sampling point to prevent contamination of the sample with impurities from other places. On each bottle of samples was indicated, the source, date/ time of extraction and the collector’s identity. The samples were tested in the laboratory for Biochemical oxygen demand (BOD5), Chemical oxygen demand (COD), Total Nitrogen (TN), Ortho-phosphate (O- PO4), Total suspended solids (TSS), pH, Electrical Conductivity (EC), Faecal Coliform (FC/100ml) Biochemical Oxygen Demand Test (BOD5) The BOD5 is the amount of oxygen used over a five day period by micro-organisms as they decompose the organic matter in waste water at a temperature of 20° C. If sufficient oxygen is available in wastewater, the useful aerobic bacteria will flourish and cause aerobic biological decomposition of waste water which will continue until oxidation is complete. The test involved filling an air tight bottle of a specified volume to overflowing with the sample and incubating at a temperature of 20° C for 5 days. Dissolved oxygen (DO) was measured before and after incubation and the BOD measured as the difference of the initial and final dissolved oxygen from using equation 1. BOD5 is used to test the strength of untreated and treated municipal and biodegradable industrial wastes. Thus is a measure of the extent to which water is polluted by these wastes. Chemical Oxygen Demand (COD) Test The chemical oxygen demand COD, is he amount of oxygen required to oxidize the organic matter in a waste water by use of a strong oxidant and to convert it to carbon dioxide and water. The oxidant preferred and used in this test is potassium dichromate because of superior oxidizing ability, applicability to a variety of samples and ease of manipulation. Its oxidation of most organic compounds is from 95% to 100% of the theoretical value. In this test a known quantity of waste water was mixed with a known quantity of standard solution of potassium dichromate (K2Cr2O7) and the mixture heated. The organic matter was oxidized by the potassium chromate in the presence of sulphric acid (H2SO4) and the oxygen used in oxidizing the waste water was determined. COD is used as a measure of the oxygen equivalent of organic matter content of a sample that is susceptible to oxidation by a strong chemical oxidant. The value of COD is always higher than that of BOD5because many organic substances can be oxidized chemically but not biologically. Coliform Test A measured volume of the sample was filtered through a fine pore membrane composed of cellulose esters. All the bacteria present were retained on the surface of the membrane which was then placed face uppermost and incubated at 44° C for 12-16 hours for faecal coliforms and 37° C for total coliforms. The coliforms were then counted using magnifying glass. Coliforms were expressed in colony forming units per 100ml of sample (CFU/100ml). Total Suspended Solids (TSS) The Hach DR2010 spectrophotometer was used for measuring the TSS of the sample. 25mls of the sample was measured and placed in theist TSS reading was taken directly in mg/l. The pH Value The ph value indicates the negative log of hydrogen ion concentration present in a waste water. pH = - logH+ or H+ = (10)-pH If pH is less than 7 the wastewater is acidic and if greater, it is alkaline. The determination of the pH value is important because certain treatment methods depend upon the availability of suitable pH value. Waste water with pH values far from the neutral value of 7 is difficult to treat by biological means and if the pH of waste is not altered before discharging in natural water bodies, will alter the pH value of the natural water. Water with low pH values is corrosive to both metallic and concrete structures and is toxic to aquatic life. It reacts with the natural alkalinity of the water and renders it unfit for laundry and boiler. On the other hand, water with pH values greater than 8 combines with free carbon dioxide and further increases the alkalinity of the water. The optimum range of pH for aquatic life is 6.8-8.0 Electrical Conductivity (EC) This is a measure of the ability of ions in a solution to carry electric current. This ability depends on the presence of ions, their total concentration, mobility, valence and relative concentration and temperature. The electrical conductivity was measured using a Hach model conductivity meter. The EC meter was switched on and its probe dipped into the sample contained in a beaker. The electrical conductivity of the sample was read directly and recorded in mho (siemens). Total Nitrogen (TN) 25ml of the sample was mixed with 45ml of concentrated ammonium chloride solution, from this, 25ml were collected and 1.0ml of coloring reagent added to it. The TN concentration was read directly using DR4000 spectrophotometer at 543nm. RESULTS AND DISCUSSIONS Figure I and 2 show the BOD and COD trend respectively along the channel. The study revealed that the values of BOD and COD along the channel are higher than the values allowed by NEMA standards. The relative values of BOD and COD are higher in the dry seasons than in the wet season because rain causes dilution in the stream. There is a general increase in the level of average BOD and COD along the channel from Agakhan Bridge to Kibira road. This shows that the rate at which the channel is being contaminated between these two points is higher than the rate of self purification. There is a shaper rise in COD between fire brigade and Kibira road than the rise in BOD. This is an indication of a higher proportion of organic matter that can not be easily decomposed by biological activities of micro organisms typical characteristics of industrial waste. There is a general decrease in the value of BOD and COD between the point at Kibira road and railway culvert. This is because after Kibira road, the channel enters a swamp and the rate of self purification in the swamp is very high compared to the lined parts of the channel. Wetlands are valuable pollution trap because; their plants absorb excess nutrients and their fine sediments absorb other pollutants. They have plenty of dissolved oxygen and hence oxidation of organic matter within the wetland is higher. Figure 3 shows the Total Nitrogen (TN), while figure 4 shows the Orthophosphate trend along the channel. It is seen that total nitrogen and orthophosphate concentrations are higher than NEMA standards between Agakhan Bridge and just after Kibira road. This place is used as a urinal, by the public, it also indicates the wastes from schools and markets and industrial area along this part of the channel contain these compounds. Both phosphate and nitrogen cause eutrophication in surface water bodies. Figure 5 shows the variation of the total suspended solids (TSS). The TSS along the channel are higher than the requirements of NEMA. Despite the fact that the flow in the channel increases more than 3times during the wet season, the wet season shows relatively higher values of TSS than the dry season, this is because the flood water carries a lot of particles into the stream. The trend increases from Agakhan to Kabira road this contains so much human activity, which include; households, schools, markets, shops and industries, there is a marked decrease in the TSS after Kabira. This is because there is a decrease in flow speed on entering the wetland. At low rate of flow, suspended solids particles in water tend to settle at the bottom of the stream. However this has the effect of choking the wetlands with sediments. Figure 6 shows the variation of faecal coliform per 100mls along the channel. The values of faecal coliform count at all the sampling points fall below the limit set by NEMA. The value of E-coli was highest at Agakhan bridge and steadily decreased along the channel. The high value is due to the fact that at Makerere Kivulu slums there were a number of cases identified where human excreta was discharged from the pit latrines directly into the channel including one case of a government aided Secondary school, Kampala SS. These areas are within 400m before the Agakhan Bridge. The decrease in the value of E-Coli downstream is due to self purification due to the biological processes. Figure 7 shows the electrical conductivity (EC) trend along the channel. The levels of electrical conductivity are high but acceptable since they fall below the maximum allowed by NEMA. The EC levels are slightly higher during the dry season, because dilution during the wet season leads to lower concentration of dissolved substances. Electrical conductivity is used to quantify total dissolved solids (TDS) EC in µS/cm can be converted to TDS as follows:TDS (mg/l) = kEC (µS/cm), where k is a conversion factor depending on the composition of the sample. Since the channel discharge point is near to point of water abstraction by the National Water and Sewerage Corporation (NWSC), a high level of total dissolved salts leads to scaling and corrosion which affect the treatment plant. This may lead to decline in the quality of treated water and high cost of maintenance to the treatment facilities. The pH trend along the channel is shown in Figure 8. The pH of the waste water in the channel falls within the range set by NEMA. The pH reduction between the Agakhan Bridge and fire brigade is due to the fact that in a number of places the area around the channel is used as a urinal. Urine contains uric acid that can increase the acidity of water. Conclusions: There is a high degree of pollution in Nakivubo channel caused by discharge of wastes from slums, markets, schools, shops and restaurants, solids carried by storm waters and industries. The wetland that stretches from just after industrial area to the lake is helping to bring down the level of pollution. This is depicted by the reduced level of pollution towards the railway culvert. The wetland increases the rate of self purification through which pathogens are destroyed and nutrients like nitrogen and phosphates used up by the aquatic plants in the swamp. It also reduces the speed of flow of water, thus enhancing settlement of suspended solids. Recommendations: In the slums, the water table is close to the surface, making it difficult to construct deep pit latrines moreover there is congestion and lack of land. It is recommended that the community be provided with Ecosan Toilets as an alternative the pit latrines that get full easily and are emptied into the channel. The level of pollution in the water could cause serious infection; it is therefore recommended that the public be denied access to the channel constructing a fence around it for the whole of its length. There is need for NEMA to closely monitor the discharge from industries. If need be pre treatment should be applied. It has been noted that wetlands contribute greatly to the purification of the waste waters. Measures to protect the wetland should be more strictly enforced. Also several parallel channels should be constructed up to 25% of the distance into the wetland so as to spread the waste water rather than have the one channel transecting the wetland. Continuous monitoring of the channel and other rivers/ streams in the country be carried out. REFERENCES
Copyright 2008 - Journal of Applied Science and Environmental Management The following images related to this document are available:Photo images[ja08034f2.jpg] [ja08034f6.jpg] [ja08034f4.jpg] [ja08034f1.jpg] [ja08034f7.jpg] [ja08034f8.jpg] [ja08034f3.jpg] [ja08034f5.jpg] |
| |||||||||
