 |
| About Bioline | All Journals | Testimonials | Membership | News |
|
||||||
|
||||||
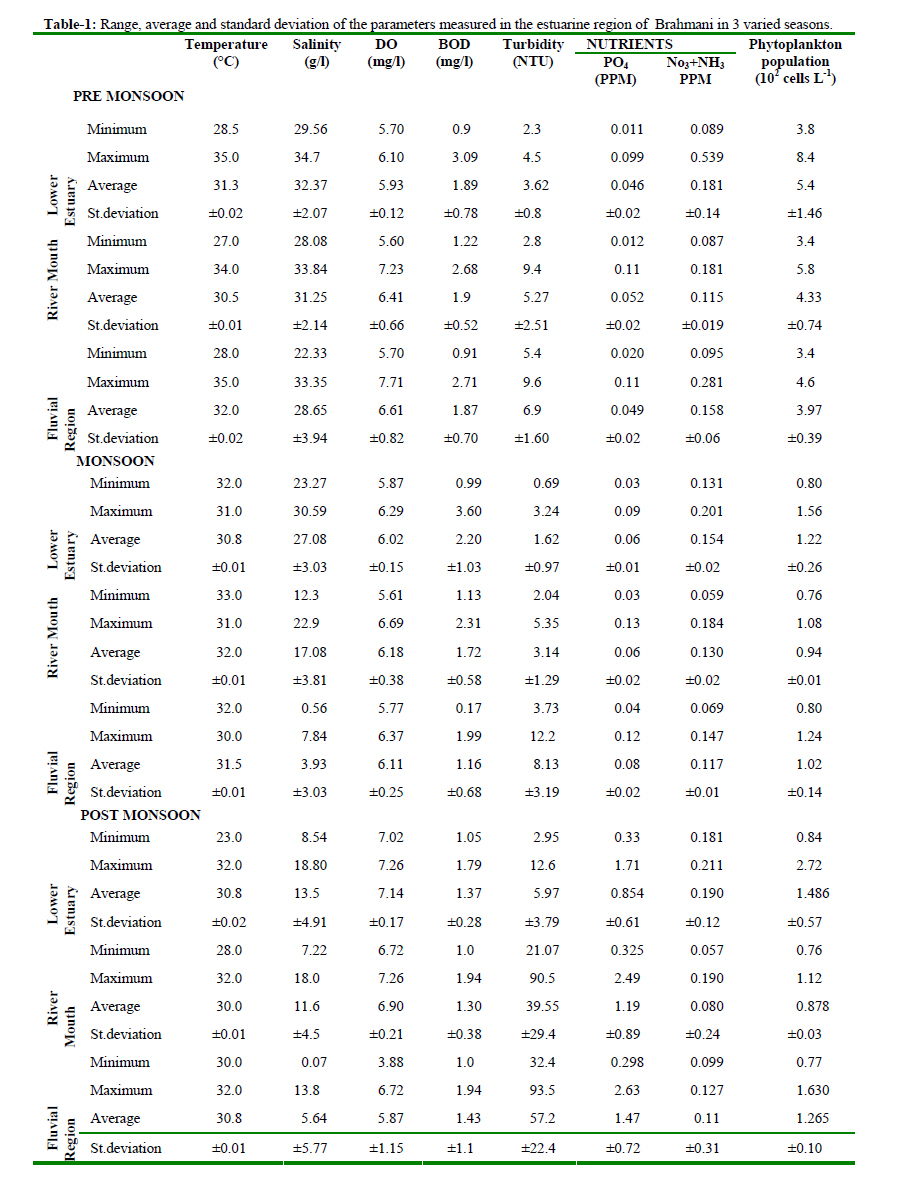
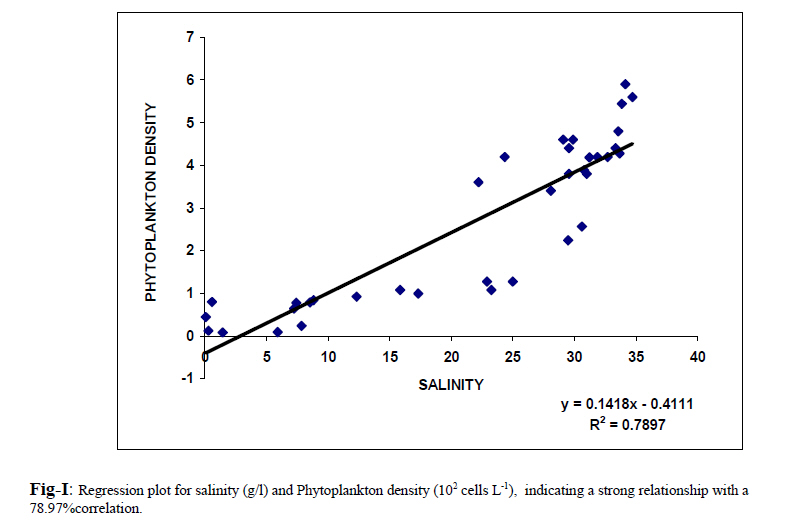
Journal of Applied Sciences and Environmental Management, Vol. 12, No. 3, 2008, pp. 19-23 Seasonal Variability of Phytoplankton Population in the Brahmani Estuary of Orissa, India S. Palleyi, R. N. Kar; C. R. Panda Institute of Minerals & Materials Technology, Bhubaneswar-751013, India Code Number: ja08044 ABSTRACT: The dynamic relationship of water physico-chemical characteristics with phytoplankton has long been of great interest in both experimental ecology and environmental management. This study was carried out at the Brahmani Estuary (East coast, Bay Of Bengal, India) from March 2007 to November 2007. Based on the collected samples from six stations, phytoplankton population, DO, BOD, salinity and nutrient (o-PO4, NO3+NH3) were examined. The phytoplankton abundance varies with the seasonal variation. Due to wave action and circulation patterns DO distribution shows a marginal variation at different sampling points but the DO are relatively higher in the upstream compared to downstream, as oxygen solubility is higher for fresh water. In tropical climates higher light energy and temperature allow faster cycling of nutrients, thus seasonal maxima and minima of nutrient level are more difficult to asses and in general the nutrient concentration are low. Phytoplankton abundance increased through the increasing trend in salinity to the extent found in this investigation. A regression plot analysis exhibit a positive value i.e. R2 = 0.7897, or correlates with each other up to 78.97%. INTRODUCTION Moving from a river through an estuary to the sea demonstrates the major changes in depth, energy (current, turbulence), water clarity, salinity, sediments (organic contents) nutrients and biota. Estuarine communities are some of the most productive and diverse of costal communities, which is a transition zone between freshwater and marine water world. Estuarine habitat can be divided into a marine region (lower) with a direct connection to the seawater, a middle region where salt water and fresh water mix, and an upper or fluvial region dominated by fresh water but subjected to tidal action (Ketchum, 1983; Day et al., 1989). The Brahamani River with Subarnarekha and Mahanadi River grouped together as Central River basins of East coast of India. The river flows with a total length of 480 km, winding around the south & southeast part Bonaigarh and Talcher and then turning towards the east to unite with northern branches of Mahanadi River. It finally empties into the Bay of Bengal at the palmyras point. The significant tributaries of Brahmani river are the Karo, the Sankha and Tirka. The Brahmani, the Mahanadi and the Baitarani rivers together form a big river delta on the Orissa coastal plain. The survey data comprises of physico-chemistry & biology of this large estuarine region. Phytoplanktons, among the primary producers of aquatic ecosystems, depend upon sunlight, water, and nutrients to survive. Besides the availability of nutrients, the physico-chemical variables such as flushing rate, salinity and turbidity also influence the distribution and abundance of plankton communities in estuaries (McLusky, 1971; Cleorn, 1987; Ferreira et al., 2005; Madhu et al., 2007). The dynamic relationship between phytoplankton growth with respect to salinity, turbidity, DO, BOD and nutritional changes in the Brahmani Estuarine region was studied from the month of March 2007 to November 2007 to evaluate the seasonal variations of these parameters. MATERIALS AND METHODS Present study was carried out from March 2007 to November 2007 on Brahamani estuary. The data further grouped into 3 seasons, one during the premonsoon season (March – May), second one during (June – Aug) the monsoon season and finally the post monsoon (Sept – Nov). A total of 6 stations were considered from the freshwater river to the salt-water covering almost the whole salinity gradient. The station-1 and 2 covers the lower estuarine region (marine region) having depth of 63ft at station 1, station-3 and station-4 covers the river mouth region having depth of 27ft and 26ft, respectively. The station-5 (26ft) and station-6 (26ft) were the riverine region or fluvial region dominated by freshwater but subjected to tidal action. Water samples for the measurement of salinity, turbidity and nutrient parametes were collected in Polypropylene bottles and for DO and BOD measurement water samples were collected in DO bottles. The temperature was measured in situ. Salinity was determined by silver nitrate titration according to Oxner's description of Knudsen's method (Oxner, 1920). Turbidity was measured by Nephlometric method. The Dissolved oxygen was analysed by Winkler method, both at start and after 5-days incubation at 20° C in BOD incubator. The amounts of DO reduced after 5 days is calculated in mg/l and termed as BOD. As P and N are important elements for phytoplankton growth, for the simplicity of nutrient (O-PO4, NO3+NH3) we will refer to o-PO4 as total P, and NO3 + NH3 as total N (Dawes, 1981). A sedimentation method was used for phytoplankton counting and species identification. Samples for phytoplankton analysis were fixed with lugol’s iodine and stored in dark bottles. Qualitative and quantitative analysis of phytoplankton were performed using a microscope by Sedgwick-Rafter counting cell. RESULT AND DISCUSSION Coastal areas are highly sensitive against climate change. It was shown that all factors of Brahmani estuary region are affected due to the impacts of climate change and they have different degree of vulnerability. The seasonal shifts in water environment exhibit dramatic changes. Further the Bay of Bengal is traditionally considered to be a region of lesser biological productive oceanic basin. This has been variedly attributed to the light inhibition due to turbidity and cloud cover; narrow shelf etc, the exact physical process is yet unclear (Madhupratap, et al.; 2003). The result describes the variations and interrelation physico-chemical property of water in respect of biological environment, mostly with phytoplankton population density (Table-1). Tide dominated coastal water ways are naturally turbid because of strong tidal amplitude re-suspend fine sediments. At six different sampling points during the dry months (March-June) the turbidity value reaches maximum, i.e. about 329.0 NTU at station -5 (Fluvial region) due to less depth and strong water turbulence (Table-1). During the sampling periods of monsoon season, due to heavy rainfall and insufficient tidal current the value of turbidity highly decreased in the marine region (Lower Estuary) i.e. up to 0.69 NTU and in the Fluvial region dominated by fresh water the turbidity was found to be 3.75 NTU. After monsoon season the turbidity of water samples showed a gradual increase and reached up to 93.5 NTU at the fluvial region (Table-1). Shallow regions are less susceptible to oxygen depletion or wide fluctuation because of wave action and moreover, circulation patterns can easily supply the deeper waters with oxygen as is evident in the observed results. The DO distribution was found to be of marginal variation at different sampling points ranging from 7.71 mg/l to 5.60 mg/l. Further measurement shows that DO is relatively higher in the up streams compared to downstream as oxygen solubility is higher for fresh water. Gas solubility also increases as water temperature and salinity decrease (water shedds: Dissolved Oxygen, elect.comm.2002). The result also depicts that during the month of October (post monsoon) when salinity was low the DO value increased in comparison to other months. BOD is not an accurate quantitative test, although it could be considered as one of the indicators of the quality of water. The result indicated that the maximum value of BOD during pre monsoon season reached up to 3.09 mg/l at lower estuarine region, whereas minimum level was 0.9 mg/l at Station-2. During monsoon season the BOD increased up to 3.60 at lower estuary. BOD value of post monsoon showed a decreasing trend in comparison with dissolved oxygen (Table-1). In tropical climates there is a depletion of phosphorous and nitrogen during the summer season, as a result of which phytoplankton population gets depleted. Since light energy and temperature are responsible for the faster cycling of nutrients it is, therefore, difficult to asses the maximum and minimum level of nutrient, and, in general, the nutrient concentrations are low during the season (Corner and Davis, 1971). There are temporal changes in phosphate levels in the oceans with highest concentration occurring during winter in tropical waters as it reaches up to 0.4012 mg/l (in the month of October), where as during summer it remains in the ranges of 0.012 mg/l to 0.054 mg/l (Table-1).Salinity is a dynamic indicator of the nature of the exchange system. The salinity of the water within the estuary tells us how much fresh water has mixed with seawater. The salinity distribution within coastal waterways reflects the relative influx of freshwater supplied by rivers. Salinity levels fluctuate with the penetration of tidal flow and with mixing of fresh water and marine water by wind and water current. During the pre monsoon periods due to the cessation of river flow, the fresh water was mixed by the tides and winds out of the estuary and bay, replaced by more oceanic water from offshore. So the salinity increased up to 33.83 g/l and ranged between 33.83 to 29.89 mg/l. During the monsoon and right after the season, the river flow often pushed the salt water right out of the estuary rendering it fresh. The salinity reading dropped to 0.07 in the fluvial region where as the downstream (marine region) showed a salinity level of 8.83 g/l during post monsoon season (Table-1). Physical parameters of estuarine water such as salinity, dissolved oxygen, BOD, turbidity provided a strong impact on phytoplankton density. Environmental heterogeneity in estuaries makes an essential contribution to planktonic growth. Phytoplankton abundance in the Brahmani estuary increased seaward through the trend in salinity. Besides salinity there are many other factors that can influence the distribution of phytoplankton, such as turbidity, relative importance of tidal amplitude and freshwater influx volume, water column stratification and grazing rate of Zooplankton. Mostly investigations carried out from the month of March to November identified 31 different phytoplanktonic generas, where majority belongs to Diatoms. During March – April (pre-southwest monsoon), the pole ward flowing East India Coastal current bringing nutrient laden cooler waters to the surface that enriched the coastal region (Helga. R. Gomes et al., 2000) enhances the phytoplankton growth. Hence, the phytoplankton abundance touched peak values during the season, i.e. 8.4 x 10² cells L-1 at the lower estuarine region when salinity of the water had highest values (34.14 g/l). Due to increased river run off during the South West Monsoon (June-August) that suddenly drops the salinity in the fluvial region drastically affects the phytoplankton population. During the pre monsoon season the water column may be dominated by euryhaline or polyhaline phytoplankton species. Huge reverine influx dropped salinity value to 0.56 gm/l and thus the euryhaline phytoplankton density also decreased up to 1.22 x 10² cells L-1 at the lower estuarine region. However, the river mouth region registered lowest value of phytoplankton population (0.94 x 10² cell L-1, average) (Table-1) due to obvious reason.The water column which was dominated by fresh water in monsoon gradually mixed due to reduction in cloud cover, enhanced wind velocity and water turbulence during the unset of post monsoon season. This effect improves the salinity and nutrient in estuarine water, thus enhancing the growth of phytoplankton. In the post monsoon season the phytoplankton density gradually increased up to 1.63 x 10² cells L-1. A regression plot (Fig-I) was drawn to analyze whether the phytoplankton density depends upon salinity. The regression plot exhibits a positive value, i.e. R2=0.7897, which means that the phytoplankton population and salinity value correlate with each other up to 78.97%. It is observed that as salinity increases the growth phytoplankton also increases to the extent found in the present investigation. Therefore, phytoplankton population depends upon the salinity of the estuary. Earlier workers have also reported similar kind of observations in regards to the growth of phytoplankton population with respect to salinity variation (Kinne, 1971; Lionard et al., 2005; Putland et al., 2007). Acknowledgements: The authors are thankful to the Director, IMMT, Bhubaneswar for his kind permission to publish the work. Thanks are also due to the Dhamra Port Co. Ltd., for providing necessary funding to carry out the work. REFERENCE
Copyright 2008 - Journal of Applied Sciences & Environmental Management The following images related to this document are available:Photo images[ja08044t1.jpg] [ja08044f1.jpg] |
| |||||||||
