 |
| About Bioline | All Journals | Testimonials | Membership | News |
|
||||||
|
||||||
Journal of Applied Sciences and Environmental Management, Vol. 12, No. 4, 2009, pp. 25-32 Effect of different levels of phosphorus on growth and mineralization in African giant catfish Heterobranchus bidorsalis (Geoffrey Saint Hillarie, 1809) NWANNA, L.C1; I. A. ADEBAYO2; B. OMITOYIN3 1Corresponding author., Department of Fisheries and Wildlife, Federal
University of Technology, PMB 704 Akure, Nigeria. Telephone: 234/8033582428.
E-mail: drlu2001@yahoo.com
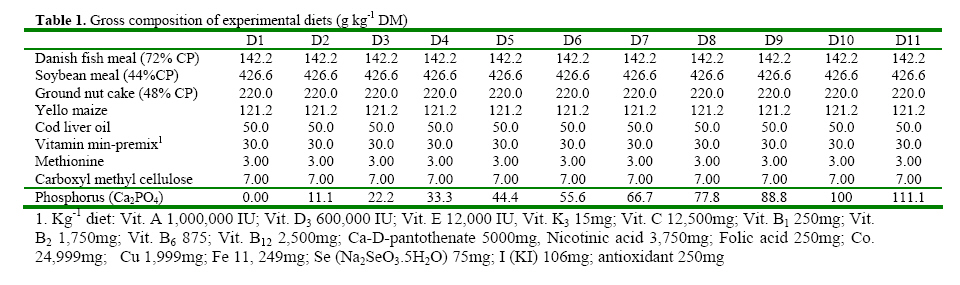
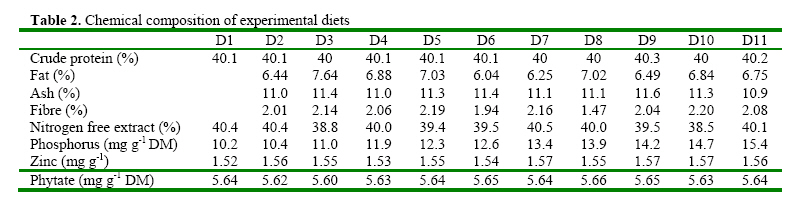
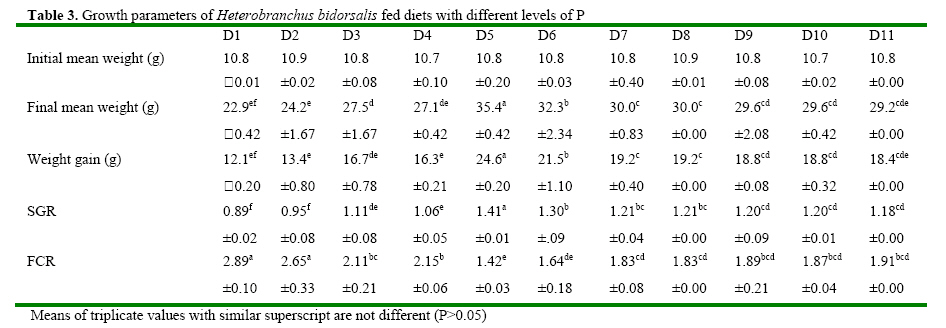
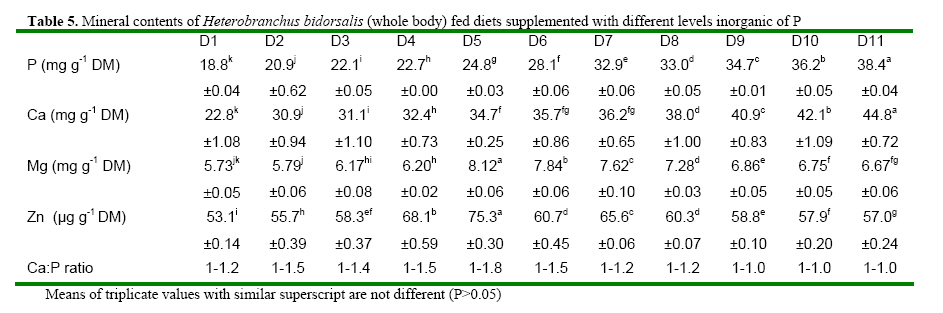
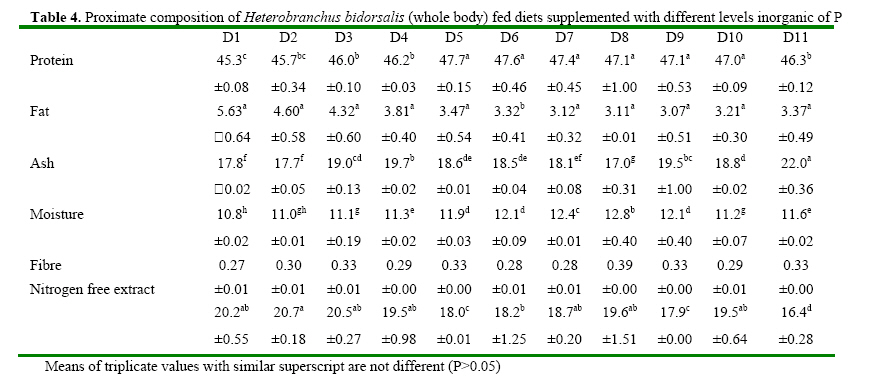
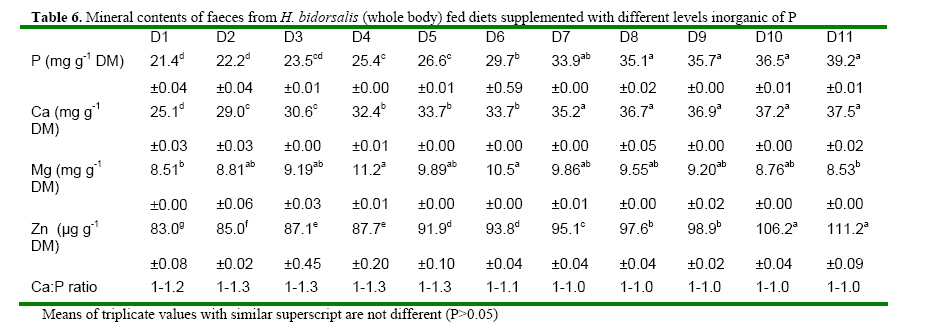
Code Number: ja08061 ABSTRACT: Eleven diets (D1-D11), designated as treatments (T1-T11), supplemented with different levels of inorganic phosphorus (P) (Ca2PO4) were fed to Heterobranchus bidorsalis (10.8 ±0.02 g) to determine the optimum P requirement. D1 - D11 contained total P of 10.2, 10.4, 11.0, 11.9, 12.3, 12.6, 13.4, 13.9, 14.2 14.7 and 15.4 g kg-1respectively. After 84 days of feeding trial, there was increase in fish growth up to T5 with 12.3g P kg-1diet, followed by consistent decline in growth towards T11 with the highest P content. However, fish in T5 had the best (P<0.05) growth performance and feed conversion ratio (FCR). Fish in T1 and T2 had the highest (P<0.05) FCR. Carcass protein was the same in T5, T6, T7, T8, T9 and T10, which was higher (P<0.05) than in T1, T2, T3 and T4. Carcass fat content was highest in fish in T1 which also had the lowest water content. P and Ca concentration in fish carcass increased linearly and was highest (P<0.05) in fish in T11, while Mg and Zn were highest (P<0.05) in fish in T5. Data from the study suggest 12.3 g P kg-1diet as optimum requirement for the growth of Heterobranchus bidorsalis. Phosphorus (P) is an essential and critical nutrient for animal production. Calcium and P make up 70% of the total mineral elements in the body and are essential for the formation of bone, energy transfer through ATP and an essential component of buffer systems in the blood (BASF 2000). P is also involved in the control of appetite, gain and feed efficiency (McDowell, 1992) and inadequate of supply of P may lead to severe consequences in terms of reduced performance, increased condemnations, excessive mortality, and reduction in carcass quality (Waldroup, 1999). However, P is also an antinutritional factor and an environmental pollutant (Wiesmann et al. 1988). Inorganic P is an antinutritional factor because it forms insoluble soaps with calcium and lipids, and the insoluble soaps reduce the digestibility of several nutrients including energy and amino acids. Increasing levels of dietary available P content by the addition of inorganic phosphate consistently lowers apparent metabolizable energy (AME) and amino acid digestibility. Calcium-phosphate –phytate complexes also bind directly to starches (Thomson and Yoon 1984; Thomson, 1988), inhibit alpha-amylase action (Deshpande and Cheryan, 1984) thereby lowering starch solubility and digestibility (Knuckles and Betschart, 1987). Furthermore, aquaculture effluents high in P levels contribute to the pollution of the aquatic ecosystem and, eventually, cause the eutrophication of natural fresh waters (EPA, 1973). Therefore dietary P contents must be the quantity that will neither compromise fish growth nor cause environmental pollution. Coloso et al. (2002) reported that P levels in the effluent can be reduced by lowering of P levels in fish foods, and/or by improving the utilization of dietary P by the fish. This nutritional approach should conform to dietary P requirement levels and should consider the proportion of dietary P that is available to the fish. Vielma et al. (2000) also reported that substitution of fish meal with soybean meal decreases available P and soluble P in the effluent. Discussions on P reduction techniques must include better knowledge of the P requirement by different species of fishes, formulating feeds closer to P requirements and increase in plant P digestibility. Chavez-Sanchez et al. (2000) also noted that correct feeding of fish should take into account the mineral requirements. Sugiura et al. (2000) observed that it is critical to know precisely the dietary requirement of P in order to minimize excess P in diet without risking P deficiency in cultured fish. The two clarrid catfishes of importance in African aquaculture are African giant catfish Heterobranchus bidorsalis and African catfish Clarias gariepinus. Information is scarcely available on the P requirement of African giant catfish, H. bidorsalis, which can grow as thrice big as African catfish under the same culture conditions. Besides, the relative availability of P varies greatly with fish species, diet composition and form of P (Schwarz, 1995). Therefore the present study investigated the effect of different levels of inorganic P (Ca2PO4) on the growth and mineral concentration of H. bidorsalis with a view to determining the optimum P requirement for the growth of the fish. MATERIAL AND METHODS Analysis of Phytate For the quantification of phytate, 8g of finely ground sample (of the 11 samples of the experimental diets) was soaked in 200ml of 2% HCL for 3h and then filtered using Whatman No1filter paper. 50ml of the filtrate was pipetted into 400ml beaker and 10ml of 0.3% ammonium thiocyanate solution was added as an indicator. 107ml of distilled water was added to give PH 4.5. The solution was then titrated with standard ferric chloride solution containing 0.00195g Fe\ml until a brownish yellow colour persisted for 5 min. The Fe equivalent was multiplied by 1.19 to get phytate-phosphorus. This was converted to phytate by multipling the value of phytate-phosphorus by 3.55, Young and Greaves (1940). This analysis was done at the Central Laboratory, Federal University of Technology Akure. Experimental Diets All raw materials used in feed preparation (Table 1) were purchased from fish feed vendors in Ibadan, Nigeria and transported to University of Ibadan where the study was conducted. All the diets contained the same proportions of the same feed ingredients. The differences in the diets were the different levels of dicalcium phosphate P (Ca2PO4 ) supplemented into the diets.The basal diet (diet 1) (negative control treatment without supplemental P) was prepared to contain 40% crude protein. Then the basal diet was supplemented with Ca2PO4 at 0.2, 0.4, 0.6, 0.8, 1.0, 1.2, 1.4, 1.6, 1.8 and 2% to obtain diets 2-11. The diets were prepared by thoroughly mixing the dry ingredients with cod liver oil and then adding cold water until a stiff dough resulted. The dough was then pelleted using Hobart A-200 pelleting machine with a 2.0mm die. After pelleting, the diets were immediately sun dried (27 ±2 ° C) and later broken mechanically into small sizes and packed in dry, air tight small containers (labelled) prior to use. Inclusion of the different levels inorganic P in the diets resulted in dietary P of 10.2, 10.4, 11.0, 11.9, 12.3, 12.6, 13.4, 13.9, 14.2 14.7 and 15.4 g kg-1for diets 1-11 respectively (Table 2). Diets 1-11 made up treatments 1-11. Feeding experiment The experiment was conducted at the University of Ibadan, Nigeria in recirculation systems. Thirty three glass tanks of 70 L water capacity were used for the feeding trials. There were eleven treatments and each was in triplicate. Water flow into the tanks was adjusted at 1.5 L per minute. Air stones were used to aerate the tanks throughout the feeding period. About 350 fingerlings (10.82± 1.02g) of Heterobranchus bidorsalis were purchased from a reputable fish farm in Ibadan. The fish were acclamatized in the 70 litres capacity glass tanks for two weeks. After that, 330 fish were weighed individually and grouped into 10 fish per tank according to the eleven treatments with three replicates per treatment. The fish were fed to satiation twice daily between 0900 and1100 and 1600 and 1800 six days a week, for 84 days. Weight of the fish was measured bi-weekly and used to calculate the weight gain, specific growth and feed conversion ratio. Weight gain = final weight – initial weight, SGR = 100 x (Loge finial weight-Loge initial weight/culture period (days). Feed conversion ratio = weight of feed fed (g)/fish weight gain. Dissolve oxygen, temperature and pH of the experimental tanks were measured weekly and the results obtained ranged between 6.3-8.0 mg g-1, 25-27° C and 6.85-8.88 respectively. Proximate and Mineral analysis At the end of the experiment fish were not fed for 24h. The catfish were weighed and an equal number of fish from each tank was collected. A total of twelve fish from each treatment were sacrificed. Three replicates of the fish carcass ( whole body), diets and faeces were analysed for proximate and minerals composition according to the methods of AOAC (1990). About 2.0g of the samples were ashed for 48h at 480° C. After the ash had cooled to room temperature, 6ml of HCl was added and the mixture was brought to boiling point. After cooling to room temperature, another 2.5ml of 6N Hcl was added and the mixture was warmed to dissolve all the solutes. The solution was then cooled and diluted to 25ml with distilled deionized water. Then the minerals ( Mg, Ca, Zn and Mn) were measured in Atomic Absorption Spectrophotometer (AAS). Phosphorus content of the eleven diets, fish and faeces were analysed using the Vanadomolybophosphoric acid colorimetric method 4500-p with slight modifications. To 3ml of the diluted solution of the sample, 3ml of vanadatemolydate reagent was added and phosphorus concentration was measured spectrophotometrically at 430nm, after the reaction mixture was thoroughly mixed and allowed to stand at room temperature for 10min Statistical Analysis Data ( Mean weight gain, SGR, FCR, carcass minerals and mineral concentration in the faeces resulting from the experiment were subjected to one way analysis of variance(ANOVA) test using the Statistical Package for Social Science (SPSS) 1998 version). Individual differences (p= 0.05) among treatment means were separated using Duncan’s multiple range test (Duncan, 1955). RESULTS Chemical concentration of the experimental diets (Table 2) showed closely related values of protein, fat, ash, fibre and nitrogen free extract among the diets. Zn and phytate contents of the diets were almost the same. Therefore differences in the performance of the fish may not be as a result of differences in the dietary composition. The growth parameters (Table 3) indicated that weight gain and specific growth rate increased steadily with increase in dietary phosphorus (P) levels up to 12.3 g P kg-1diet in treatment 5 and then declined consistently to dietary level of 15.4 g P kg-1diet in treatment 11. Feed conversion ratio (FCR) showed a decreasing trend from fish in treatment 1 fed diet without P supplement to fish in other treatments. However, FCR was best in fish in treatment 5 fed diet with 12.3 g P kg-1. Fish in treatments 1 and 2 had the highest (P<0.05) FCR, an indication of dietary P deficiency. The table highlighted the optimum P requirement for the growth of the fish to be 12.3 g kg-1diet. Proximate composition of the fish after the experiment (Table 5) showed that addition of 12.3-14.7 g P kg-1in the diets significantly increased the body protein concentration in comparison to other treatments. Fat content of the fish was statistically the same, but showed a decreasing trend from fish in treatment 1 fed diet without supplemental P to fish fed other diets. Consequently, fish in treatment 1 contained the highest level of fat. Ash content was significantly highest in the fish fed diet with the highest level of dietary P, while moisture content indicated an increasing trend from fish in treatment 1, so that fish in that treatment had the lowest moisture content. There were no significant differences in fibre content of the fish while the carbohydrate content of the fish showed a decreasing trend with increasing dietary P levels. The mineral content of fish whole body is presented in table 4. The table showed that P and Ca contents of the fish increased linearly with increase in dietary P levels so that fish in treatment 11 with the highest P content had the highest significant body P and Ca concentration. However, Mg and Zn concentrations were highest in fish in treatment 5 that had the best growth performance. Zn concentration in the fish also showed increasing trend up to fish in treatment 5, and then reduced continuously towards fish in treatment 11 with the highest dietary P content. The table showed that Ca: P ratio of the fish whole body ranged between 1-1.0 and 1-1.8, with fish in treatment 5 having the highest ratio. Table 6 presents the mineral contents of the fish faeces which indicated increasing levels of faecal P and Ca as a result of increase in dietary P levels. The table also showed that Mg concentration in the faeces did not follow any definite trend, while Zn concentration increased with increasing levels of dietary P. The faecal Ca: P ratio ranged between 1:1.0 and 1:1.3. This also showed an increasing trend with increase in dietary P levels up to treatment 5 and then declined towards treatment 11. Summary of the results expressed that suboptimal or subtoxic levels of dietary P can negatively affect growth performance of the fish. The study also established a positive relationship between Ca:P ratio and the growth of the fish, so that the fish with the highest body Ca:P ratio of 1:1.8 had the best growth performance. DISCUSSION Suboptimal mineral supply leads to biochemical changes in the metabolism and inadequate storage of minerals without showing clinical symptoms (Kirchgessner et al. 1980), while over supply of minerals at subtoxic levels can be evidenced by metabolic changes without leading to external symptoms (Schwarz, 1995). The study investigated the effect of different levels of phosphorus (P) (Ca2PO4) on growth and mineral concentration in African giant catfish, Heterobranchus bidorsalis with a view to determining the optimum P requirement for the growth of the fish. The result obtained from the study indicated that suboptimal or subtoxic levels of dietary P can negatively affect the growth performance of the fish. The relative availability of P varies greatly with fish species, diet composition and form of P (Schwarz, 1995). Dietary P requirements ranging from 0.5 to 0.8 percent have been reported for rainbow trout (Ogino and Takeda, 1978), Atlantic salmon (Ketola, 1975), Rainbow trout (Lall and Bishop, 1976), Chum salmon (Watanabe et al. 1980), Carp (Ogino and Takeda, 1976), and sea bream (Sakamoto and Yone, 1978). Mgbenka et al. (2005) described the requirement of hybrid African catfish (Clarias gariepinus x Heterobranchus bidorsalis) as about 6-8 g P kg-1diet. Delince et al. (1987) also reported estimated P requirement for African catfish fry and fingerlings as between 10-12 g P kg-1. The present study indicated the P requirement of H. bidorsalis juveniles as 12.3 g kg-1diet. The discrepancy between this value and that reported by Mgbenka et al. (2005) could be attributed to the sizes of fish used as 2.5g of the hybrid catfish was used while 10.8 g of H. bidorsalis was used in the present study. It is also possible that the parent stock/pure breed requires higher P than the hybrid. The P requirement as observed from the present study is slightly higher than that reported for African catfish. This suggests that H. bidorsalis may have higher requirement than African catfish since it grows bigger and needs more P for growth and bone development. Wilson et al. (1982); NRC (1983) and Lovell (1978) reported values of 0.42- 0.50% P as the requirement for channel catfish (Ictalurus punctatus), while Andrews et al. (1973) reported 1.50%. The differences between these values reported for channel catfish and that from the present study could be attributed to species differences. Chavez-Sanchez et al. (2000) also reported optimum level of P in the diet of American cichlid as 1.5 g kg-1. Reported P requirements vary from about 0.25-1.0% (Chavez-Sanchez et al., 2000) and this range explains that P requirement is species specific. P is a growth promoter when supplied at optimal concentration in animal feeds. Coloso et al (2002) described that increasing the concentrations of available dietary P from 0.24% to 0.88% modestly enhanced the growth of rainbow trout; and recommended total P of 0.88% and 0.58% estimated available P as the optimum for the fish. This observation is in line with the result of the present study which showed increase in growth performance H. bidorsalis as a result of increase in dietary P content of the diets up to 12.3 g kg-1. The consistent decrease in the growth of the fish beyond the optimal P requirement as obtained from the study is in consonance with the observation of Coloso et al. (2002) who stated that the biomass gain per amount of P fed rainbow trout was significantly lower in fish fed with the diet containing the highest supplemental P, indicating an important trade off. The decrease in the weight gain and specific growth rate of the fish fed diets deficient in P is in line with the report of Lovell (1978) which described that dietary deficiencies in P caused reduction in growth rate, body content of Ca and P of the fish. Andrews et al. (1973) also stated that channel catfish (Ictalurus punctatus) fingerlings fed low amount of P exhibited reduced growth, poor feed efficiency and low bone ash. In Chavez-Sanchez et al. (2000) diet deficient in P resulted in reduced growth and high conversion ratio in American cichlid, Cichlasoma urophthalmus. The positive relationship between Ca:P ratio and the growth of the fish as expressed in the present study is line with Chavez-Sanchez et al. (2000) who reported that Ca and P requirements per unit of growth and Ca and Ca:P ratio are positively correlated. Increase in carcass fat and reduction in water contents observed from the present study as dietary P deficiency symptoms is in accordance with increase in fat content and decrease in carcass water of fishes reported by Ogino and Takeda (1976) and Takeuchi and Nakazoe (1981). Onishi et al. (1981) observed that P deficiency in carp accompanied accumulation of lipid in muscle and viscera, and increase in the activity of the hepatopancreatic enzyme. In Sakamoto and Yone (1980) high lipid was deposited in carp fed diet deficient in P. Similarly, Chavez-Sanchez et al. (2000) reported inverse relationship between carcass lipid levels and dietary P. Increase in carcass ash as observed from the study supports the work of Chavez-Sanchez et al. (2000) which explained that bone ash and scale mineralization in American cichlid are highly correlated with P level in the diet. Andrews et al (1973) determined that a P deficiency produced lower bone and ash in channel catfish while Ketola (1975) described that supplemeantary P in the diets significantly increased bone ash content in Atlantic salmon. Similarly, Watanabe et. al. (1980) observed that dietary P levels greatly affected the ash content of the bones of chum salmon. Ogino et al. (1979) reported that due to the function of P in the bone structure, an increasing supply of P significantly increases the P content of the bone and its mineralization, leading to concomitant increases in ash and Ca. In the present study, increasing levels of P similarly increased the P, Ca and ash contents of the fish. In experiment with chum salmon, Watanabe et al. (1980) showed that dietary P levels significantly affected the Ca and P contents of the bones of the fish. Reduction in the carcass Zn levels of fish fed diets with high dietary P contents as observed from the present study is in consonance with observation by Satoh et al. (1996) that excess amount of dietary P inhibited Zn utilization in rainbow trout. Cabell and Earle (1965) also reported that P in diets increases the Zn requirement in animals. Nwanna et al. (2007a,b) also observed inverse relationship between high dietary P levels and Zn mineralization in common carp Cyprinus carpio. Increasing faecal P levels due to increase in dietary P levels support the works of Coloso et al. (2002) which stated that faecal P concentrations tended to increase with dietary P concentrations. Bureau and Cho, (1999) explained that in trout-fed practical diets containing CaHPO4, soluble P in the effluent increased as the digestible dietary P increased. Coloso et al. (2002) similarly reported that soluble P production per kg fish is a linear function of dietary P and is independent of the type of diet used (purified (egg white-based), semipurified or practical) and apparently on the size of fish. The increasing level of faecal P as a result of increase in dietary P as observed from the study is in agreement with previous works (Ketola and Richmond, 1994; Rodehutscord et al. 2000; Sugiura et al. 2000). Increasing faecal P and Ca levels due to increase in dietary P levels is in line with observation of Sugiura et al. (2000) who described that faecal P content significantly increased when diet fed to rainbow trout was supplemented with calcium phosphate. REFERENCE
Copyright 2009 - Journal of Applied Sciences & Environmental Management The following images related to this document are available:Photo images[ja08061t6.jpg] [ja08061t5.jpg] [ja08061t4.jpg] [ja08061t3.jpg] [ja08061t2.jpg] [ja08061t1.jpg] |
| |||||||||
