 |
| About Bioline | All Journals | Testimonials | Membership | News |
|
||||||
|
||||||
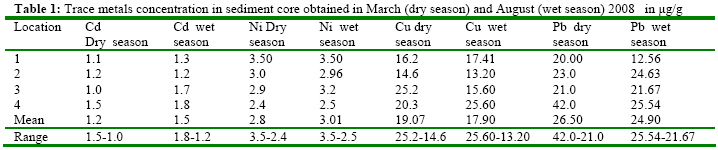
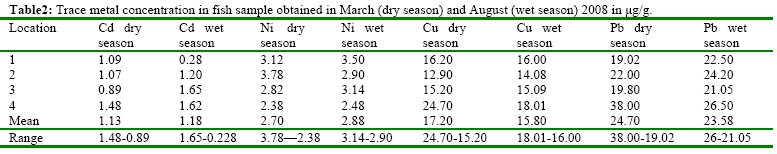
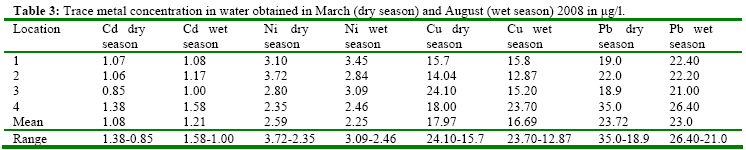
Seasonal Variation of Cd, Ni, Cu and Pb in Catfish, Sediment and Water Samples from Ipo Stream in Ikwerre District of Rivers State, Nigeria. Kpee, Friday; Ozioma, Ekpete; Ihunwo, Loveday. Chemistry Department Rivers State College of Education, P.M.B 5047 Port Harcourt. Phone: 08037921952 Code Number: ja09026 ABSTRACT The variation of some heavy metals Cd, Ni, Cu and Pb was conducted on sediment, cat fish and water samples from four stations in Ipo stream in dry and wet seasons. Atomic Absorption Spectrophotometry model 3700 was used to analyzed the samples The result revealed that the average metal concentrations in sediment in both seasons was in the order Pb > Cu >Ni > Cd which were 25.73µg/g, 18.48µg/g, 2.91µg/g and 1.35µg/g respectively. In fish sample the metals also occurred in the order Pb ,Cu , Ni and Cd which were 24.14µg/g ,17.85µg/g, 2.79µg/g and1.15µg/g respectively, while in the water sample similar trend of heavy metals concentrations also occurred which were 23.32µg/l for Pb,17.32µg/l for Cu, 2.42µg/l Ni and1.15µg/l for Cd respectively. These values were below the established standard for aquatic environment by W.H.O and FAO. The result indicated that the consumer of fish and water from the stream is not at risk of being poison by these metals. @ JASEM The distribution and partitioning of heavy metals in ambient water system had been conducted world wide. Heavy metals have been known to be distributed to the environment as a result of natural and human processes. Wittman, 1979 and Robinson, 1996 identified causes of heavy metal pollution of river system to include complex industrials processes, mining, agricultural practice, leaching of metal from garbage dump, domestic waste, atmospheric precipitation and discharge of petroleum products to the environment. Various environmental factors like temperature, pH, water hardness, dissolved oxygen, light, salinity and organic matter can influence the toxicity of metals in aquatic medium (Bryan, 1971).Freshwater have been known to exhibit a high natural variability in their physical and chemical properties due to local differences in geology and climate. They are therefore more susceptible to anthropogenic influence than the marine environment (Rainbow and Dallinger 1993). The main pathway to human contamination by organic and inorganic pollutants associated to aquatic system is the consumption of contaminated food(Mackey,1991).Aquatic organisms tend to concentrate trace metal to a high magnitude and man is the ultimate consume of these aquatic organisms. Foran (1990) reported that the potential human health associated to the consumption of contaminated food is 20 to 40 times higher than the ingestion of contaminated water. This is due to the capacity of some aquatic organisms to concentrate heavy metals such as Fe, Cu, Zn etc. up to 105 times the concentration present in the water (Gillimarães et al, 1985).These heavy metals are generally considered to be less toxic than non-essential metals (Bartley,1983).They are toxic when present in elevated concentration in the environment (Bryan,1971, Du Preez and Van Vuren,1994; and Sander, 1997).It is important to monitor pollution levels of heavy metals in aquatic system carefully so that approximate measures of the potential hazard can be attained. These measures should give an estimation of the type of effect that could be expected after exposure of heavy metals. In Nigeria, studies have been conducted on both fresh and brackish water fish to determine the levels of heavy metals. Kakulu et al, 1987,Obasohen and Okonsaye, 2004 have evaluated concentrations of heavy metals in Nigerian rivers where they reported levels of cadmium as follows 0.074mg/kg to 0.13mg/kg for Oreochromics niloticus, 0.07mg/kg to 0.15mg/kg for Hemichronis fasciatus. While in USA Low et al, 1978 found freshwater fish collected from rivers to contain cadmium as follows in 1978 0.41ppm ,in 1979 0.41ppm in 1980 0.03ppm and in 1981 0.35ppm, on the other hand lead detected had a mean concentration of 0.19ppm in 1978, 0.16 in 1979 and 0.17ppm in 1980 and 1981 respectively. The main purpose of this paper was to evaluate the concentration of Cd, Ni, Cu and Pb in different matrix of Ipo stream which include sediment, water and cat fish to determine their pollution status. MATERIALS AND METHODSDescription of the study area Ipo stream is located in Ipo community in Ikwerre district of Rivers State situated in Niger Delta area of Nigeria. The Niger Delta area lies between latitude 4º 15´N and 6º 30´N and longitude 5º 00´E and 8º 00´E.The area falls within the tropical rainforest which normally experienced two seasons yearly which are the dry and wet seasons. The dry season normally starts from November to April, while wet season starts from May to October. The annual rainfall is usually about 2106mm.The Ipo stream occupies an area of about 850m per square area and is located about 3 kilometers from Port Harcourt International airport Omuagwa. The stream receives domestic, industrials effluent, air burn particulate matter and storm water runoff from the immediate environment. The sediment of this stream has been developed from sand, dead leaves and organic black silt that are affected intensively by exploration activities. In the early 1990’s the inhabitants of Ipo community rely solely upon water and fish from the stream for their survival. SAMPLE COLLECTIONThe samples streambed sediment, water and fish were collected from four sites in dry (March) and wet (August) seasons in 2008.Top inches of sediments composite samples were collected from each site and stored in plastic containers that were washed with distill water. The water samples were collected with plastic containers and few drops of nitric acid (HNO3) were added immediately after collection, while the fish samples were caught from each site with a fishing trap. The fish were killed and washed with water from the stream and were placed in a cooler containing ice blocks and were taken to the laboratory. SAMPLE PREPARATIONThe composite sediment samples were wet sieved with ambient water by using 63-µm nylon mesh sieve. These samples were analyzed for partially extractable metals by using a 5-percent (0.6N) hydrochloric acid digestion (Hornberger et al ,1999).Metals analyzed with this procedure (weakacid extraction) include silver, cadmium, chromium, iron, copper, manganese, nickel, lead and zinc. This method extracts the mostly easily mobilized metal from the sediment surface which has the potential for exposure to and uptake by resident biota. The fish samples were oven dried at 105ºC and ground. The ground samples were sieved and digested according to the method of Association of Official Analytical Chemist (AOAC,1995).The water samples were digested using method described in (APHA,1992).The levels of the element were determine using Atomic Absorption (Perkin Elemer Model 3700) with flameless graphite furnace (GA-2). RESULTS AND DISCUSSIONS The result of the analysis of water, sediment and fish samples in two seasons are presented in table 1, 2 and 3.The results indicated that there were relatively low levels of all the trace metals from the sampling stations. Cadmium concentration varies between samples analyzed. Cadmium concentration in sediment sample ranged from 1.5 ± 1.0µg/g to 1.8 ±1.2µg/g in the dry and wet seasons with their mean concentration of 1.2 µg/g and 1.5µg/g respectively in which site 4 had the highest concentration of 1.5µg/g and1.8µg/g.A similar trend of cadmium concentration was also recorded in fish samples in the two seasons. In fish sample Cd concentration ranged from 1.48 ± 0.89 µg/g to 1.62 ± 0.28 µg/g with their mean concentration of 1.13µg/g and 1.18µg/g respectively in which the highest concentration was recorded in site 4 in both seasons and site 3 had the lowest concentration in the dry season .Cadmium concentration in water also showed similar distribution pattern in which site 4 recorded the highest concentration of the metal in both seasons which were 1.38µg/l and 1.58µg/l, while sites 3 and 2 recorded the lowest concentration in both seasons. In water Cd concentration ranged from 1.38 ± 0.85µg/l to 1.58 ± 1.18µg/l with their mean concentration of 1.09µg/l and 1.37µg/l respectively. The distribution of cadmium in the samples collected from the studied indicated that the metal had irregular pattern in which no specific site was found to record highest/ lowest concentration of the metal. The average mean concentration (AMC) of the metal in the various samples was in the order sediment > fish > water which were 1,35µg/g, 1.15µg/g and1.14µg/l respectively. The result obtained in this study agreed with those obtained by Akporhonor et al, 2007 and Obansohen and Okonsaye, 2004 where they reported low levels of Cd in different fish species caught from Nigerian rivers. The concentration of Cd found in fish was below the permissible proposed by FAO, 1983 and WHO 1983.However, nickel concentration in the various matrix examined showed similar trend of distribution in both seasons. In sediment samples showed in table 1.0, nickel concentration ranged from 3.50 ± 2.4µg/g to 3.50 ± 2.5µg/g in the dry and wet seasons with mean concentration of 2.8µg/g and 3.04µg/g respectively. The highest concentration in both seasons occurred in site 1 which were both 3.50µg/g ,while the lowest concentration occurred in site 4 which were 2.4µg/g and 2.5µg/g.There was no correlation of cadmium with nickel in sediment sample, nickel concentration were relatively higher compared to cadmium at each site. In streambed sediment from site 1, 2, 3 and 4, the total nickel concentration decrease from 1 to 4 which was quite different from what was obtained for Cd which had irregular distribution pattern. In fish sample, relatively higher levels of nickel were recorded in the two seasons. Nickel concentration ranged from 3.87± 2.38µ/g to 3.5 ± 2.48µg/g with mean concentration of 2.70µg/g and 2.48µg/g respectively. In both seasons, location 2 recorded the highest concentration of the metal which was 3.78µg/g and 3.50µg/g respectively. The average mean concentration (AMC) of Ni was 2.79µg/g as indicated in table 2.0.The result of Ni obtained by Du Preez and Van Vuren 1994 was slightly above those found in this study. However, this result agreed with those reported by Kakulu et al, 1987 where they reported similar concentration of trace metal in fish and shellfishes from Niger delta environs. Copper concentrations varies between samples analysed. In fish samples, cu concentration ranged from 24.70 ±15.20 µg/g to18.01 ±16.0 µg/g in dry and wet seasons respectively. The highest concentration of copper occurred at location 4 in both seasons which were 24.70 and 18.0µg/g respectively, while in the sediment sample the concentration of copper also varies from one location to another. Copper concentration ranged from 25.2 ± 14.6 µg/g to 25.60 ±13.20µg/g in dry and wet seasons respectively. In water samples, the concentration of cu also varies in both seasons, copper concentration ranged from 24.10±15.7µg/l to 23.70±12.82µg/l in the dry and wet seasons respectively with the highest concentration occurring at location 3, while location 4 had the highest concentration in the wet season which was 24.10µg/l and 23.70µg/l respectively. From the result, copper concentration followed the trend sediment > fish > water which agreed with the finding of Kakulu et al (1987) where they reported highest concentrations of metal from aquatic medium in Niger Delta River. The availability of copper to fish is influenced by a number of factors: alkalinity, hardness, and pH being of primary importance as well as chemical processes, including absorption onto particulate matter, precipitation and complexation with inorganic and organic ligand (Stiff, 1971).Hawarth and Sprague (1978) determine by experimentally with rainbow trout, that high hardness decreases toxicity at any pH. However, at a high pH of 9 and at high hardness levels, cu’s toxicity increases. Higher temperature results in decreasing oxygen levels, leading to in increase in the metabolic rate. Because of this, fish take up greater amounts of cu as a result of the increased diffusion or active uptake associated with high rates of water movement across the gills or other cells. Furthermore, the properties of the cu metal itself may directly influenced by temperature, by changing the equilibrium effect between molecular and ionized form (Cairns et al, 1975).The higher the temperature ,the more ionized copper form are produced resulting in greater toxicity to the fish (Prosi,1979).lower temperature would in induce lower metabolic as observed in table 1, 2 and 3 all the average concentrations of copper was lower in the wet season when the temperature of the study is relatively low. A similar result was reported by Obasohan and Okonsaye, 2004 Lead concentrations in sediment, fish and water showed an irregular fluctuation from site to another. In sediment sample, Pb concentration ranged from 42.0 ± 20.0µg/g to 25.54 ± 22.56µg/g in dry and wet seasons respectively. The highest values of lead occurred at site 4 with the values of 42.0µg/g , while the lowest values occurred at site 1.In the wet season, the highest values of Pb occurred at site 4 which was 25.54µg/g, while the lowest value occurred at site 1 which was 12.56µg/g. Pb mean concentration in both seasons were 26.56µg/g and 24.90µg/g respectively and with their average mean concentration of 25.73µg/g.In fish sample, Pb concentration also fluctuate from one site to another. Pb concentration ranged from 38.0 ± 19.20µg/g to 26.0 ±21.05µg/g in which site 4 recorded the highest concentration in both seasons which were 38.0µg/g and 26.50µg/g respectively. In water sample values, of Pb also varies from one site to another. Pb values ranged from 35.0 ±18.9µg/l to 26.40 ±21.0µg/l in dry and wet seasons. The result obtained showed that site 4 had the highest concentration of Pb in both seasons which were 35.0µg/l and 26.40µg/l respectively. The mean concentration of Pb in both season were also recorded, dry season had the values of 23.72µg/l while wet season recorded the values of 23.32µg/l.The result obtained in this study agreed with those reported by Horsfall and Spiff 2002 from Niger delta environs. There was a comparison between the average mean values of the four heavy metals in all the stations, the result revealed that station 4 had the highest concentrations of most metals in the samples analysed. There was no significant difference in the concentration of metals observed between stations. However, Pb was observed to be the most abundant of the metals in the study area. The general trend of metals in Ipo stream was in the order Pb, Cu, Ni and Cd. The result shown in table 1, 2 and 3 indicated that Cd , Ni and Pb, Cu had similar distribution pattern were they had relatively low concentrations in all the samples analyzed. This may suggest that these elements were derived from the same source of distribution such as agricultural in flux, waste of fish or sewage via the surrounding cultivated land. CONCLUSIONThe levels of heavy metals obtained in this study were generally below W.H.O and FAO recommended levels of trace metals in fish and water. This implies that fish and water from this stream will not pose any health hazard to the user’s .However; more studies should be conducted on these metals and other pollutants in the stream to provide more information on the pollution status of the stream. REFERENCE
Copyright 2009 - Journal of Applied Sciences & Environmental Management The following images related to this document are available:Photo images[ja09026t3.jpg] [ja09026t2.jpg] [ja09026t1.jpg] |
| |||||||||
