 |
| About Bioline | All Journals | Testimonials | Membership | News |
|
||||||
|
||||||
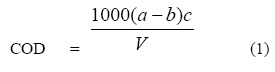
Adsorption and Treatment of Organic Contaminants using Activated Carbon from Waste Nigerian Bamboo. Ademiluyi, F. T.; Amadi, S. A.; Amakama, Nimisingha Jacob Department of Chemical/Petrochemical Engineering, Rivers State University of science & Technology, Port Harcourt, Nigeria. ademuluyi@yahoo.com. 08055339435/08034561089 Code Number: ja09036 ABSTRACT The adsorption and treatment of organic contaminants using activated carbon from waste Nigerian bamboo was investigated. Waste Nigerian bamboo was carbonized at 400oC-500oC and activated with acid at 800oC to produce granular activated carbon (GAC). Adsorption of organics from the refinery waste on the activated carbon produced was examined at 28oC. The experimental batch equilibrium data was correlated by Freundlich and Langmuir isotherms. The adsorption data fitted well into the Freundlich isotherm. Breakthrough time of about 1.5 hours was observed for the fixed bed adsorption process. The organic concentration expressed as chemical oxygen demand (COD) was reduced from an initial value of 378 mg/l to 142 mg/l for the first hour, 143 mg/l for the second hour, 152 mg/l for the third and fourth hours, and 156 mg/l for the final hour., which also compare favorably with the refinery effluent specification of 150 mg/l Results from the study shows that waste Nigerian bamboo can be converted into high capacity adsorbent and used for the remediation of polluted industrial waste waters. @ JASEM Industrial wastewater is often contaminated with various compounds such as: phenol, chromium, suspended solids, dissolved organic compounds, etc, and it is imperative that it should be treated to an environmental acceptable limit. The current problems in wastewater treatment stem primarily from the increasing pollution of waters by organic compounds that are difficult to decompose biologically, because these substances resist the self-purification capabilities of the rivers as well as decomposition in conventional wastewater treatment plant (Olafadehan and Aribike, 2000). Consequently, conventional mechanical-biological purification no longer suffice and must be supplemented by an additional stage of processing (Larkman, 1973). Among the physicalchemical processes that have proved useful for this, adsorption on activated carbon is especially vital because it is the dissolved and, difficult-todecompose organic substances in particular that can be selectively removed by activated carbon. The removal of pollutants from aqueous waste stream by adsorption unto granular activated carbon (GAC) in fixed beds is an important industrial wastewater treatment process (Yeh and Thomas, 1995). The adsorption of a single component from an aqueous solution unto activated carbon has been performed experimentally with different systems. Activated carbon was used to remove highly odorous dissolved organic compounds from industrial wastewater (Baker et al, 1973). Adsorption test also showed that GAC removed colour and phenol. The adsorption equilibrium and kinetics of methylene blue dye on such carbon were then examined at 30°C. Ibaraj and Sulochana (2002) used activated carbon produced from Jack fruit peel (carbonized by chemical method) to treat and remove malachite green from wastewater obtained from a dye industry. Equilibrium data obtained tend to follow Freundlich, Langmuir and Redlich Peterson isotherms. Mohammed, et al (2005), studied aqueous phenol adsorption trend using local granular activated carbon produced from palm date pits and compared it to a commercial sample (Filtrasorb – 400). For phenol, the former exhibited a slightly higher adsorption than the latter. The use of locally prepared activated carbon from palm date pits results showed that it is more efficient than the commercial sample. The phenol removal efficiency was investigated at several PH values, carbon dosages and contact times. Amuda and Ibrahim (2006), compared the adsorption efficiency of coconut shell-based granular activated carbon (Acid and barium chloride activation), with the adsorption efficiency of commercial carbon, (Calgon carbon F-300), with respect to organic matter from a beverage industrial wastewater. Freundlich adsorption isotherm was used to analyse the adsorption efficiencies of the two activated carbons. The studies indicated that the acid activated coconut shell carbon had higher adsorption for organic matter expressed as chemical oxygen demand (COD), than calgon carbon (F – 300) at all carbon dosages used. Hameed et al. (2006) studied the adsorption of methylene blue on Malaysia bamboo based activated carbon. The equilibrium data for methylene blue adsorption well fitted to the Langmuir equation, with maximum monolayer adsorption capacity of 454.2 mg/g. The adsorption of methylene blue could be best described by the pseudo-second-order equation. The kinetic parameters of this best-fit model were calculated and discussed. A more efficient use of granular activated carbon requires an understanding of the adsorption process as well as the pre calculation of the concentration curves. Hence, this research examines the adsorption and treatment of dissolved organic pollutants in wastewater from a refinery in Nigeria using granular activated carbon produced from waste Nigerian bamboo. MATERIALS AND METHOD Materials and equipment The materials used for the experiment were: Granular activated carbon produced from Nigerian waste bamboo, industrial wastewater from a petroleum refining industry in Nigeria (that have undergone biological, mechanical treatment), distilled water, hydrochloric acid, phenol crystals for calibration of standard phenol. The equipment used in the experiments were: two electronic weighing balance, Ohaus top loading Balance (+0.01) was used to weigh the bamboo before pyrolysis, while a more sensitive (+0.001) balance (Adams AFP 360L) was for other analysis A laboratory electrical oven (Gallenkamp), Laboratory electric muffle furnace (Type: OH85TR), locally fabricated pyrolysis reactor with thermocouple, mortar and pistol, PH meter, refractometer. conductivity meter, spectrophotometer. Waste water analysis was carried out at institute of pollution studies (IPS) and the Chemical/petrochemical laboratory, Rivers State University of science & Technology, Port Harcourt, Nigeria Carbonization Carbonization (1000 grams of washed, cut and dried bamboo) was carried out in a pyrolysis reactor. The bamboo was carbonized at about 400-500oC. Carbonization lasted for two hours after which the charred products were allowed to cool to room temperature. The charred material was crushed using mortar and pistol. Chemical activation 100g of carbonised bamboo was carefully weighed and put in beaker containing 120cm3 of 0.1M HCI. The content of the beaker was thoroughly mixed until it forms a paste. The paste was then transferred to a crucible and the crucible was placed in a Muffle furnace and was heated to 800oC for two hours activated sample was then cooled at room temperature, and washed with distilled water to a pH of 6 – 7, and dried in an oven at 105oC for three hours. The final product was kept in an air tight polyethylene bag, ready for use. Adsorption of organic contaminants A schematic diagram of the experimental set up for the fixed bed adsorption of organic compounds in refinery wastewater effluent is shown in Fig.1. The adsorption material was granular activated carbon manufactured from Nigerian waste bamboo and fiber glass was used at the end of the column to support the activated carbon The wastewater sample used in this investigation was obtained from a refinery company in Port Harcourt, Nigeria. Wastewater samples labelled A and B were collected at different locations and periods along the effluent flow line. Sample pH and temperature was measured at source. Before the experiment, the bed was wetted by passing distilled water through the column to improve the wetting characteristics of the granules. This is necessary for the provision of high interfacial area. The distilled water was allowed to drain and the feed (wastewater) sample was allowed to flow through the bed from the reservoir by gravity. The flow rate of the feed through the bed was determined by collecting known volume of water for a specific time. An average feed flow rate of 7.1464 x 10– 4 m3/hr. was maintained by the input valve. Effluent from the bed was collected at different time intervals for almost three hours. The height of the bed used was measured and recorded. Batch adsorption equilibrium studies were also carried out by using granular activated carbon produced of mass 2, 3, 5, 10 and 15g. Each mass was placed in a 250cm3. Erlenmeyer flask containing 100cm3 of wastewater sample. The flask containing the 15g carbon was shaken continuously while the flasks containing 2, 3, 5 and 10g of activated carbon were shaken intermittently for 3 hours. The activated carbon samples were percolated with the wastewater effluent until equilibrium was achieved and this occurred within 3 hours of shaking. Samples were taken at some five minutes interval and the resulting mixture from each flask was filtered and the COD of the filtrate was determined. The amount of organic removal achieved at the varying dosages of carbon gave an indication of the activated carbon usage rate required to treat a wastewater to a specified effluent quality, as well as the type of solid-fluid phase equilibrium that exists for the particular case under consideration. The kinetic and equilibrium data obtained were processed to understand the adsorption of the contaminant onto the activated carbon produced using the equilibrium isotherms equations of Freundlich and Langmuir, which are commonly applied in water and wastewater treatment. Determination of COD To determine the COD, 10cm3 of 0.25N standard potassium dichromate solution was added to 20cm3 of wastewater sample in a 250ml round-bottom flask. 1g of silver sulphate and 40cm3 of concentrated sulphuric acid were added in small portions with thorough swirling, until the silver sulphate was completely dissolved. A few glass beads were added to serve as anti-bumping aid, and the flask was connected to reflux condenser. The mixture was heated gently for 10 minutes, after which the content of the flask was now cooled. 50cm3 of distilled water was flushed through the condenser, and the cooling was completed under running tap water. 2 drops of indicator solution were added and the resulting mixture titrated with standardized ferrous ammonium sulphate solution until there was a change of colour from yellow-green via blue-green to reddish brown. A blank value was determined in the same way with 20cm3 of distilled water. The COD values of the respective samples were calculated using equation (1).
In equation (1), a and b are the respective volumes of ferrous ammonium sulphate used for the blank and sample (cm3), V is the volume of sample (cm3), and c the normality of ferrous ammonium sulphate. (1). RESULTS AND DISCUSSION Granular activated carbon characteristics The characteristics of the granular activated carbon (GAC) made from waste bamboo (bulk density, porosity, pore volume, ash content, PH, etc.) are given in Table 1 below. From the table, it can be observed that the GAC produced from waste bamboo has properties within the limit of the reference activated carbon. Results of waste water analysis Table 2 shows the amount of pollutants present in the refinery wastewater obtained from the fluid catalytic cracking (FCC) unit of the plant before treatment with activated carbon. The samples A and B were collected at different points along the effluent line. Sample A was collected from the exit of the last biodisk of the waste treatment plant. Sample B was collected from the entrance into the sedimentation tank of the waste treatment plant. But mechanical and biological treatment has been carried out on sample A and B at refinery before collection. The analysis shows that sample A has a higher concentration than Sample B. Batch equilibrium study The experimental batch adsorption data obtained for samples A and B are presented in Tables 3 and 4. The batch adsorption experiments carried out to establish the nature of equilibrium that existed in the wastewater – granular activated carbon system, indicated that 2g of activated carbon could remove 3.281 mg and 3.241 mg of the total organic content of the wastewater i.e. sample A and B respectively. It can be observed from Table 3 that the equilibrium concentration of adsorbate in solution after adsorption (Cs) decreases with increase in carbon dose, this indicates that concentration of organic pollutants decreases with increasing granular activated carbon dose from waste bamboo; similar result was obtained by Aribike and Olafadehan (2000) during the treatment of industrial waste water with commercial activated carbon. it can also be observed from Table 4 that the concentration of organic pollutants decreases with increasing granular activated carbon dose. It was observed that the COD of waste water in sample A drop from an initial value of 0.301 kg/m3 to 0.134 kg/m3, while COD of waste water in sample B drop from 0.264kg/m3 to 0.111kg/m3 where M is the mass of carbon dosage (kg), Cp is the concentration of liquid in equilibrium with that of the solid phase (kg/m3), Q is the mass of solute adsorbed per mass of carbon (kg adsorbed/kg carbon), q is the quantity of solute adsorbed (kg) and C* S is the equilibrium concentration of adsorbate in solution after adsorption (kg/m3). Figure 2 shows a plot of equilibrium concentration of adsorbate in solution after adsorption (C* S) against concentration of liquid in equilibrium with that of the solid phase (Cp) for sample A. The figure presents the contaminants removal efficiencies by the granular activated carbon produced from Nigerian bamboo. It is observed from Fig 2 that the removal efficiency of contaminants by the activated carbon generally improves with increasing dosage. This is evident in the linear graph. Fig. 3 below shows a plot of equilibrium concentration of adsorbate in solution after adsorption ( C* S) versus concentration of liquid in equilibrium with that of the solid phase (Cp) for sample B. Figure 3 presents the contaminants removal efficiencies by the granular activated carbon produced from Nigerian bamboo. As in Sample A, it can be observed that the removal efficiency of contaminants by the granular activated carbon improve with increasing carbon dose. Adsorption Isotherm Modelling The Freundlich (equation 1) and Langmuir (equation
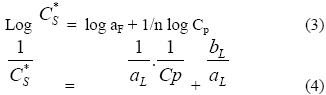
where C*S is the equilibrium concentration of adsorbate in solution after adsorption , Cp is the concentration of liquid in equilibrium with that of the solid phase, aF is a constant (Freundlich capacity factor) , 1/n is a constant (Freundlich intensity parameter), aL and bL are empirical constants from the Langmuir model. In linear form, these isotherms are expressed as:
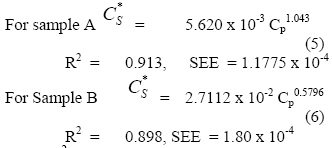
The values of aF , 1/n, aL and bL (Freundlich and Langmuir parameters) are constants, the values of which are equal to the intercept and slope of the plot of log C*S versus log Cp , and 1/C*S and 1/Cp respectively. The constants in Freundlich and Langmuir isotherms were determined by fitting the experimental data in Tables 3 and 4 to equations (3) and (4). The following Freundlich adsorption isotherms were found to correlate the equilibrium data.
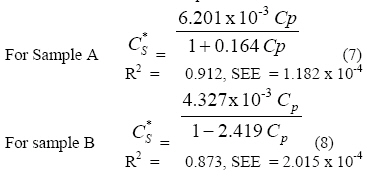
where R2 is the correlation coefficient and SEE is the standard error of estimate. The following Langmuir adsorption isotherms were also found to correlate the equilibrium data.
From the result obtained, it can be deduced that for both samples, the Freundlich isotherm gave a better fit to the experimental data than the Langmuir isotherm owing to the higher R2 values obtained in the former. Similar observation was recorded by Olafadehan and Aribike, (2000), and McCabe et al (1985). Fixed bed adsorption results The fixed bed adsorption column was set up as shown in Fig. 1 and the feed waste water from the refinery sample C, was allowed to flow under gravity for 5 hours while samples were taken every 1 hour for analysis. The specification for the fixed bed column is presented in Table 5 Table 6 shows the physical and biochemical properties of refinery effluent (sample C) before and after adsorption process in the fixed bed reactor using the activated carbon from Nigerian based bamboo. The refinery has its effluent specifications. Table 7 shows the amount of organics and inorganic contaminants that is present in the refinery feed before treatment and effluent before discharge to the river. The waste water from the Refinery facilities are treated mechanically, biologically and chemically to meet effluent specification and FEPA (Federal passing through the unit observation pond. Environmental Protection Agency) standard, before passing through the unit observation pond. The following observations can be concluded from Table 6, with respect to the physical and biochemical properties of refinery effluent sample C, after adsorption process using the newly produced activated carbon from waste Nigerian bamboo. Temperature The temperature of the wastewater after adsorption process was constant (28.0 oC), while the effluent specification is 38oC. This is due to the fact that, the analysis was carried out at room temperature. Hydrogen ion (pH ) Comparing the result obtained from Table 6 with the effluent specification on Table 7, it can be observed that the pH at all hours is within the refinery designed basis of 6 – 8.5. Total Dissolved solid (TDS) The results obtained showed that there was a remarkable decrease in the amount of total dissolved solid after treatment. It was reduced from 637 to 179 for the first hour and 384 for the fifth hour. Chemical Oxygen Demand (COD) From the experimental result in Table 6, with respect to COD in waste water before and after treatment, it can be observed that the COD was reduced from 378 mg/l to 142 mg/l for the first hour and 156 mg/l for the fifth hour. The refinery effluent specification on Table 7 is 150 mg/l. This show the efficiency of the activated carbon produced from Nigerian based bamboo. Dissolved Oxygen (DO) The result obtained from the experiment on Table 6 shows that the dissolved oxygen was increased from 3.9 mg/l to 6.9 and 8.1 mg/l after the fixed bed adsorption. Biochemical oxygen Demand (BOD) The BOD in the feed waste water was reduced from 58.7 mg/l to 16.1 mg/l for the first hour and 11.5 mg/l for the last two hours. This compares favorably with the refinery effluent specification on Table 7 which is within the standard range of 10 – 20 mg/l. Turbidity The turbidity reduced from 62 to 0 in the first 4hours. Experimental results from Table 6 showed that the turbidity was relatively removed. Odour and Appearance The result from Table 6 shows that the activated carbon produced from Nigerian bamboo completely removed the offensive odour in the waste refinery water, with clear appearance. Breakthrough curve The experimental breakthrough data obtained for the continuous fixed bed adsorption system using granular activated carbon of waste bamboo are presented in Figure 4. This figure shows the plot of dimensionless phenol concentration in sample C against time. The curve is somewhat smooth and gave a characteristic sigmoid shape, with varying degree of steepness and breakthrough time for the sample C. Experimental breakthrough times of 60-90 minutes was obtained for phenol on the adsorbent. This indicated that it would take the carbon bed about 1.5 hours to get saturated for the case being considered. Similar observation was recorded by Olafadehan and Aribike, (2000) CONCLUSION This research work has revealed some latent facts about the usefulness and effectiveness of granular activated carbon produced from waste agricultural materials. From the experimental information gathered, it has been shown in this study that granular activated carbon of <1.18mm particle size produced from waste Nigerian bamboo can effectively removed organic pollutants from industrial waste water effluents before the discharge into the river. Both the Freundlich and Langmuir isotherms were found to correlate the batch adsorption equilibrium data. The equilibrium data for the adsorption fitted better into the Freundlich equation. Breakthrough time of about 1.5 hours was observed for the fixed bed adsorption process. it was observed for the fixed bed adsorption that the organic concentration expressed as COD was reduced from an initial value of 378 mg/l to 142 mg/l for the first hour, 143 mg/l for the second hour, 152 mg/l for the third and fourth hours, and 156 mg/l for the final hour. Hence significant pollutant removal efficiency rates of 62.4%, 62.2%, 59.8% and 58.7% were achieved, which also compare favorably with the refinery effluent specification of 150 mg/l. Therefore, the effectiveness of the activated carbon produced from waste bamboo in the removal of organic contaminants has been established. Works continue on the effect of particle size, bamboo type, and fixed bed height on the efficiency of the treatment. REFERENCES
Copyright 2009 - Journal of Applied Sciences & Environmental Management |
| |||||||||

