 |
| About Bioline | All Journals | Testimonials | Membership | News |
|
||||||
|
||||||
Physicochemical Characteristics of groundwater quality from Yola Area, Northeastern Nigeria 1Gabriel I. Obiefuna, 2 Donatus M. Orazulike 1 Department of Geology, Federal University of Technology, Yola, Nigeria
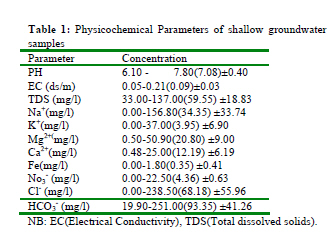
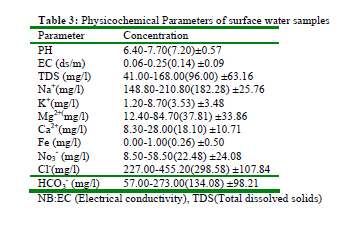
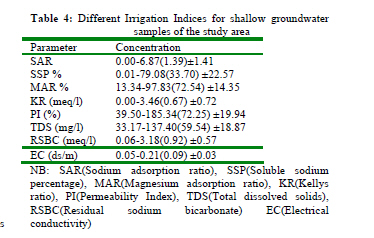
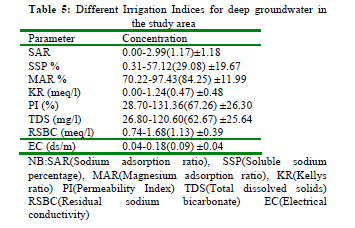
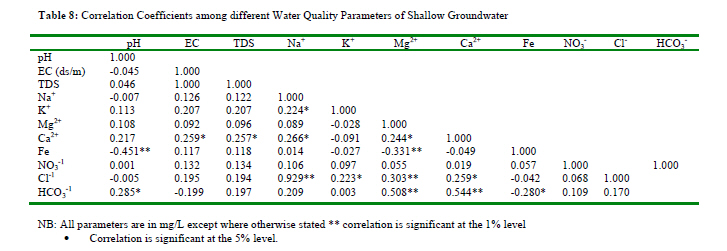
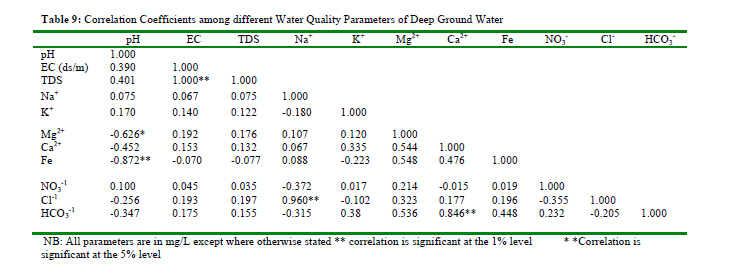
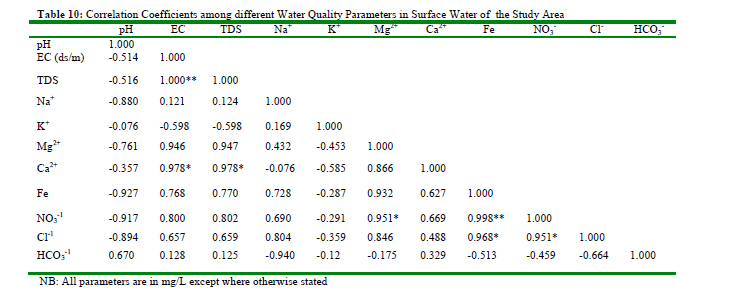
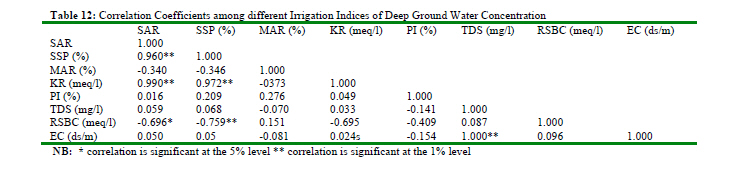
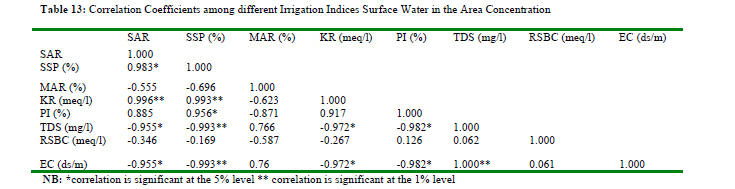
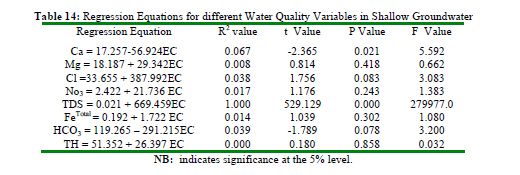
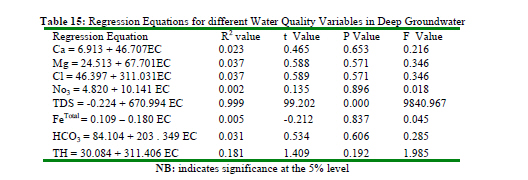
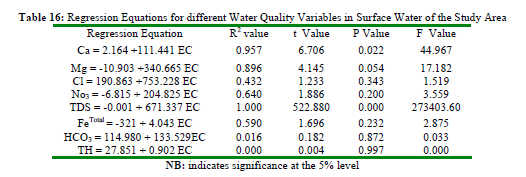
Code Number: ja10001 Abstract Some physicochemical parameters related to groundwater quality obtained from Yola Area of Northeastern Nigeria was investigated for the purpose of drinking and irrigation. An attempt was also made to develop linear regression equations to predict the concentration of water quality having significant correlation coefficients with electrical conductivity (EC). The TDS and EC has perfect correlation coefficients whereas Na+and Cl-, are highly correlated in all the water sources. Furthermore while Ca2+ and HCO3 are highly correlated in both the shallow and deep groundwater they have relatively lower correlation coefficients in the surface water samples. It was equally observed that Mg2+, Ca2+, NO3-, Cl-and Fe are highly correlated with EC in surface water samples. The data also indicated that apart from surface water bodies Ca2+, NO3-, Cl- and HCO3 are poorly related with electrical conductivity at 5% level of significance. These data has shown that linear regression equations can be applied in predicting groundwater quality in any location @ JASEM Groundwater quality has become an important water resources issue due to rapid increase of population, rapid industrialization, unplanned urbanization and too much use of fertilizers and pesticides in agriculture (Joarder et al 2008). In many developing countries, agricultural chemical use has been low in comparison to levels in industrialized countries. Concerns over groundwater pollution from agricultural chemicals were raised as a major issue in the study area more than five years ago (Yenika et al 2003) but few data were available. At that time, the level of agricultural chemical use was still relatively lower. However how much of this pollution is related to agricultural pollution and how much to domestic or other sources is unknown. Apart from non-point-source considerations, it is important to recognize that nitrate and other nutrient pollution in groundwater is often related to agricultural practices other than the use of chemical fertilizers. Any location where animal wastes are concentrated such as feed lots or poultry farms, can release high levels of nutrients, pesticides and herbicides as well as other major sources of groundwater pollution related to agriculture. In some circumstances, soils can absorb or immobilize a large fraction of such agricultural chemicals. It follows that many pesticides and herbicides break down slowly under aquifer conditions or transform into more toxic compounds. As a result, they persist over long time periods. Thus since groundwater pollution data are generally scarce, chemical analysis of water samples need to be specific to detect their presence. This is because the environment, economic growth and development of Nigeria are all highly influenced by water including its regional and seasonal availability as well as its antecedent quality. Groundwater quality is thus analyzed for its physical, chemical and biological parameters which are closely interlinked. All the research work so far carried out on groundwater quality in different parts of Nigeria is largely based on physicochemical parameters. No attempt has as yet been made to predict the groundwater quality of the study area with precision using any econometric analysis except depicting the correlation coefficient of different water quality parameters (Yenika et al 2003). A few number of research however are available regarding the analysis of groundwater quality data using regression techniques for prediction purposes in different parts of India and Bangladesh ( Kumar et al 1994; Rao and Rao 1994; Jain and Sharma 1997; Jain and Sharma 2000 and Joarder et al 2008). Thus since routine chemical analysis is time consuming it would be necessary to establish relationships between a common and easily determinable parameter(independent variable) and other parameters(dependent variable). The developed regression equations for the parameters having significant correlation coefficients can thus be successfully used to estimate the concentration of other constituents. In the present study, the objective is to determine the relationship between electrical conductivity (EC) and some physicochemical characteristics of groundwater resources from the Yola Area of Northeastern Nigeria. The Study Area: The study area fall within longitudes 12°20'E and 12°34'E and latitudes 9°11'N and 9°24'N and lies about 50km south of the Hawal Massifs. It is bounded to the east by the Republic of Cameroun and to the west by Ngurore town. The northern boundary is demarcated by Gokra town and the southern boundary by the Mandarare town and occupies approximately 431km2 of the land surface. Materials and MethodsWater samples (total 96) which were collected from shallow hand-dug wells, deep wells, surface waters and precipitation were subjected to chemical analyses. Samples collection was aimed at covering and representing the lateral and vertical extent of the hydrostratigraphic units within the study area along with surface water and rainfall. The samples from the deep wells in which pumps are already installed, were collected after about two hour of pumping and the screen interval of the well represents the average sample depth. Samples from the shallow hand-dug wells were bailed, using a stainless steel bailer, from a depth of two meters below the water table, which more or less indicates the sample depth. The samples were collected in 1000-ml plastic bottles and field filtration was carried out through filter papers (0.45um) to remove suspended solids. They were then carefully sealed, labelled and taken for analyses. Chemical analyses were performed in the laboratory employing standard methods, Atomic Absorption Spectrophotometry for cations and conventional titration for anions. Ions were converted from milligram per litre to milliequivalent per litre and anions balanced against cations as a control check of the reliability of the analyses results. In this study we have applied the linear regression approach to develop a relationship between electrical conductivity and different water quality variables. We have also used the Ordinary Least Square (OLS) regression with one regressor (Independent Variable) in the form of y1=â0+â1E+e. There are both practical and theoretical reasons to use OLS estimators of â0 and â1. Results and Discussion The study involve regression analyses of the water quality data of three water sources namely surface water, shallow groundwater and deep groundwater of Yola Area of Northeastern Nigeria. The minimum and maximum concentration ie the range of the different physico-chemical parameters of water quality constituents such as pH, EC, TDS, Total Hardness, Fe, Ca2+, Mg2+, K2+, Na+, HCO3 ,Cl-, NO3- and different water quality indices including Sodium Adsorption Ratio (SAR), Soluble Sodium Percentage (SSP), Residual sodium Bicarbonate (RSBC) Permeability Index(PI), Total Hardness (TH), Magnesium Adsorption Ratio (MAR) and Kellys Ratio (KR) in Yola Area for irrigation purposes are given in tables 2 to 7 [Tables 2, 3, 4, 5, 6, 7] along with the mean and standard deviation of each parameter. The pH values range from 6.10 to 7.80 for the shallow groundwater, 6.60 to 7.80 for the deep groundwater and 6.40 to 7.70 for the surface waters indicating slightly acidic to neutral waters. The conductivity varies from 0.05 to 0.21ds/m for the shallow groundwater, 0.04 to 0.18 ds/m for the deep groundwater and 0.06 to 0.25 ds/m for the surface water bodies indicating relatively low mineralization in the area and largely suitable for both drinking and irrigation purposes. The estimated values of TDS ranged from 33 to 137 mg/l for the shallow groundwater, 27 to 121 mg/l for the deep groundwater and 41 to 168 mg/l for the surface water respectively indicating TDS values below the desirable limit of 500 mg/l. The systematic calculation of correlation coefficients between water quality variables and regression analyses provide an indirect means for rapid monitoring of water quality. The correlation matrix for different groundwater quality variables for different water sources in Yola Area are shown in tables 8 to 13 [Tables 8, 9, 10, 11, 12, 13]. It was evident that the distribution of hardness, calcium, magnesium, sodium, chloride, bicarbonate, nitrate and sulphate were largely poorly correlated (r <5) with electrical conductivity in both the shallow and deep groundwater. The similarity in correlation matrix between the two groundwaters thus indicate that mineral dissolution is the dominant process influencing water quality. However, the surface waters of the study area largely exhibited significant positive correlation (r >5). The surface water samples disclosed a good correlation between EC and NO3- (r= 0.80) which further indicated that variation in EC concentration is controlled by both Cl- and NO3- concentration. Another fairly good correlation also observed between Cl- and NO3-(r= 0.95) confirm a common primary source which is both domestic effluent/sewage and/or fertilizer application. The level of significance are taken at 1% and 5% respectively. Perfect positive correlation coefficient was observed between EC and TDS (r =1) whereas high positive correlation was observed between Na+ and Cl-(r >0.80) virtually in all the different water sources. In the shallow groundwater low positive correlation coefficient was observed between Na+ and K+ (r = 0.22); Ca2+ and Cl2-( r= 0.26); Ca2+ and EC (r=0.26); Na+ and TDS (r=0.12); TDS and K+ ( r=0.21); NO3- and TDS (r=0.13); C2+ and Mg2+ (r=0.24) while low negative correlation coefficients are seen among Ca2+ and K+ (r= -0.91), Fe and K+(r= -0.03); pH and EC (r= -0.05); Mg2+ and K+ (r= -0.03); Na2+ and pH(r= -0.01); Cl2-and pH (r= -0.01); Fe and HCO3-(r= -0.28) and Cl2- and Fe(r= -0.04) The deep groundwater also revealed low positive correlation coefficient between Ca2+ and Cl- (r=0.18); Ca2+ and EC(r=0.15); Na2+ and TDS (r=0.04); TDS and K+(r=0.12); NO3- and TDS(r=0.04) while low negative correlation coefficients exist between Na2+ and HCO3 - (r= - 0.10); Na2+ and NO3- ( r= - 0.37); K+ and Cl-(r= - 0.10); Cl- and NO3-(r= -0.36); HCO3 - and Cl-(r= - 0.21); NO3 - and Ca2+(r= -0.02) and Ca2+ and pH (r= -0.45). The surface water samples however indicated highly positive correlation coefficient between Mg2+ and EC(r=0.95); Ca2+ and TDS(r= 0.98); Ca2+ and Mg2+(r= 0.87) Fe and Mg2+(r= 0.93); Fe and Na2+(r= 0.73); Na2+ and NO3-(r=0.69); Na2+ and Cl- (r= 0.80); Mg2+ and Cl-(r=0.85); Ca2+ and EC(r= 0.98) and Mg2+ and TDS (r= 0.95) while strong negative correlation coefficients was observed between Na2+ and HCO3- (-0.94); Cl- and HCO3-(r= -0.66); Ca2+ and K+(r= -0.59); K+ and TDS (r= - 0.60) and EC and K+(r= -0.60). Further statistical study of the shallow groundwater employing the Pearson correlation indicates highly positive correlation between the following irrigation indices SAR and SSP (r= 0.90); KR and SSP (r= 0.95); KR and SSP (r= 0.89); and EC and TDS (r= 1.00) and low negative correlation among MAR and SAR (r= -0.21); MAR and SSP(r= - 0.28); KR and MAR(r= -0.25); PI and MAR (r= - 0.44); RSBC and SSP (r= -0.21); TDS and PI ( r= - 0.04); RSBC and TDS (r= -0.12) and EC and PI (r= -0.04).The deep groundwater also indicate a closely similar picture as follows: SSP and SAR (r= 0.96); KR and SAR (r= 0.99); SSP and KR (r= 0.97) and EC and TDS (r= 1.00) whereas a strongly negative correlation exist between the following SAR and RSBC (r= -0.70); RSBC and SSP (r= -0.76); RSBC and KR (r= -0.70). The surface water samples exhibit strong positive correlation among SSP and SAR ( r= 0.98); KR and SAR (r= 0.99); KR and SSP (r= 0.99) and TDS and EC (r=1.00) whereas a strong negative correlation was found to exist between SAR and MAR (r= 0.56); SSP and TDS (r= -0.99); KR and MAR (r= -0.62); KR and TDS (r= -0.98); EC and SAR (r= -0.96); SSP and EC (r= -0.99); EC and KR (r= -0.97) and PI and EC (r= -0.98). Thus based on the above data set it was concluded that the correlation studies of the water quality parameters and irrigation indices have a great significance in the study of water resources. The relatively high positive correlation between some chemical parameters and irrigation indices signifies a common origin or progressive enrichment of both parameters. Furthermore the relatively high negative correlation between some chemical parameters and irrigation indices indicate evidences of groundwater mixing or pollution from anthropogenic activities. The R2 parameter was employed as a more desirable goodness- of- fit measure because it considers the degrees of freedom in estimating the desired parameters. The R2 uses variations instead of variances ( variance equals variation divided by the degrees of freedom) ( Joarder et al 2008). The R2 values of different water quality parameters with electrical conductivity for the three water sources are given in tables 14, 15 and 16. It follows the electrical conductivity is the most appropriate variable predicting or explaining the TDS values in the samples of both shallow and deep groundwater. It is also evident that the electrical conductivity is the most appropriate variable predicting or explaining about 100%, 96%, 90%, 64%, 59%, and 43% values of the dependent variables such as TDS, Ca2+, Mg2+, NO3-, Fe and Cl- respectively in the surface water sample of the data. However apart from TDS electrical conductivity poorly predicted the above parameters in both the shallow and the deep groundwater samples. It further explained the fact that the variance of the residual is small compared to the variance of the dependent variable. Thus while correlation techniques do not involve an implicit assumption of casuality the regression techniques do. Pindyck and Rubinfeld (1997) pointed out that while the dependent variable is a variable to be explained the independent variable is a moving force. It thus follows that the choice of a dependent and independent variable in a regression model is therefore crucial. Two variable least squares approach was used to develop a relationship between electrical conductivity as an independent variable and different water quality variables such as Ca2+, Mg2+, Cl-, NO3-, TDS, HCO3-, TH, Fe as a dependent variable. The cross-section of the results obtained are presented in tables 14, 15 and 16. The first column of the tables indicate the results of the ordinary least squares (OLS) regressions with only the EC as the controlling variable and a constant. The second column indicate the values of the R2. Regression results for Ca2+, Mg2+, Cl-, NO3-, TDS, Fe, HCO3- and TH show that apart from both deep and shallow groundwater samples, they are all significant at 1%, 5% and 10% levels. All the regression equations are obtained for 96-2= 94 degree of freedom. The significance of the relationship is also supported by F test ( Tables 14, 15 and 16 ). Furthermore Whiteneys test for heteroskedasticity in the residuals of the basic specification rejects the null of no heteroskedasticity and thus all standard errors of coefficients are calculated using whiteney test. The robustness of the results obtained was checked which indicated a fairly satisfactory outcome between the observed and the computed values. Conclusions: The linear regression equations for predicting the concentration of different parameters based on electrical conductivity can successfully be applied in the study area with fairly reasonable certainty. In most of the water sources of the study area the problems of bicarbonate, Chloride, nitrate and iron were noticeable. It is however less appropriate variable for predicting values of the dependent variable in both the shallow and deep groundwater samples. It further explained the fact that the variance of the residual is small compared to the variance of the dependent variable. Similar linear regression techniques have been applied in other parts of the world especially India and Bangladesh to predict the level of significance of water quality variables. Acknowledgements: The Authors are grateful to my beloved wife Mrs. Obiageli Obiefuna for typing the manuscript and to the Authorities of the Federal University of Technology Yola for granting the first author study fellowship to carry out his doctorate degree research work at ATBU Bauchi Nigeria. The authors are also grateful to the anonymous reviewer for his constructive criticisms that contributed to the success of this paper. References
The following images related to this document are available:Photo images[ja10001t4.jpg] [ja10001t11.jpg] [ja10001t14.jpg] [ja10001t1.jpg] [ja10001t5.jpg] [ja10001t9.jpg] [ja10001t6.jpg] [ja10001t13.jpg] [ja10001t3.jpg] [ja10001t16.jpg] [ja10001t2.jpg] [ja10001t10.jpg] [ja10001t12.jpg] [ja10001t8.jpg] [ja10001t15.jpg] |
| |||||||||
